

Flags are relatively simple patterns; therefore, they are widely used, even by traders with little experience. This FXOpen guide will inform you about the psychology behind these formations and their standard trading rules.
What Is a Flag Pattern?
A flag pattern is a technical analysis tool. Although it goes against the overall trend, it provides signals of a trend continuation. This formation has two essential components — the flagpole and the flag itself. The flagpole reflects strong price movement in the trend direction, while the flag stands for a short-term price movement against the main trend, where the highs and lows move in parallel. The flag is framed by trendlines, which serve as support and resistance levels.
Bullish Flag vs Bearish Flag
There are two flag types: bearish (bear) and bullish (bull).
- A bull flag appears in an uptrend and is characterised by two falling trendlines. The upper boundary connects lower highs, while the lower one goes through lower lows.
- A bear flag or reverse bull flag occurs in a downtrend and can be identified with two upward sloping trendlines, where the upper line connects higher highs while the lower goes through higher lows.
Flag Psychology
An understanding of pattern psychology may help traders grasp the concept in a straightforward way. The flag formation starts with a significant price movement that forms a solid trend. However, the trend can’t last indefinitely, so the price starts correcting. This is where the flag appears. Bulls in a downtrend and bears in an uptrend try to turn the price around; however, if there are no fundamental factors for a trend to reverse, the trend recovers.
Note: although the flag is a continuation pattern, its signals can be compromised. Therefore, traders check fundamental events to be sure that there is no reason either for a reversal or a trend continuation.
How to Spot Flags
Flags are among the simplest formations by appearance. To determine a flag, a trader needs to:
- Find a solid trend. A pattern can be found in any timeframe. Still, if it’s higher, the trend will be more reliable.
- Look for a correction. In a downtrend, the price should form higher highs and higher lows; in an uptrend, the price should form lower highs and lower lows.
- Draw trendlines. Any trendline goes through at least two points. Thus, to confirm a flag formation, there should be at least two swing highs and two swing lows so traders can draw trendlines.
How to Trade with the Flag Pattern
Like most chart patterns, flags have particular entry and exit points. Although bull and bear flags are different, their trading rules are the same. They can be changed according to the trading approach. However, if you don’t have sufficient experience, you can use the common rules.
Entry
Flags are breakout chart patterns, meaning traders wait for the price to break either an upper or a lower flag boundary, depending on the trend, to enter the market. The idea behind the pattern is to go long after the price rises above the resistance level in a bullish formation and go short after the price falls below the support level in a bearish setup.
The entry point itself depends on the trader’s approach. Some open a position as soon as the breakout occurs. However, this is the riskiest method, as a breakout may turn into a fakeout. Traders usually enter the market just after the breakout on short-term charts. Otherwise, the pattern may fail.
A fakeout is a market situation whereby a price breaks beyond a certain level but doesn’t continue moving in this direction and then reverses.
Another approach is more conservative. Traders enter the market after either the breakout candlestick or several candles in the breakout direction are closed. This allows them to be sure the pattern worked.
Take Profit
A take-profit target is based on the length of the flagpole. Traders measure the distance between the start of the trend and the end of the flag and place the same distance from the breakout trendline in the trend direction.
The rule can be changed if the flagpole is too long for the timeframe you trade in. As the trend can’t exist indefinitely, a reversal will occur anyway. The larger the flagpole, the more likely the price will reverse before reaching the target. In this case, you may consider using trailing take-profit orders and close your trade partially.
Stop Loss
A stop-loss level can be identified according to a risk-reward ratio. The ratio will depend on your willingness to take risks and the current market conditions. However, the most common ratios are 1:2 and 1:3.
Another option is to identify a certain number of pips you will always set when trading with the flag formation. For this, you can use the TickTrader platform, which offers all the essential technical analysis tools and charts of various assets, including currencies, cryptocurrencies*, stocks, indices, ETFs, and commodities.
Note: regardless of your approach, the theory suggests that a stop-loss order should be placed beyond the pattern, thus, below the lower trendline in an uptrend and above the upper trendline in a downtrend.
Bull Flag Pattern vs Bear Flag: Trading Examples
Any pattern on a live chart differs from ideal tutorial pictures. Let’s consider how the formations may look in a real market.
Bull Flag
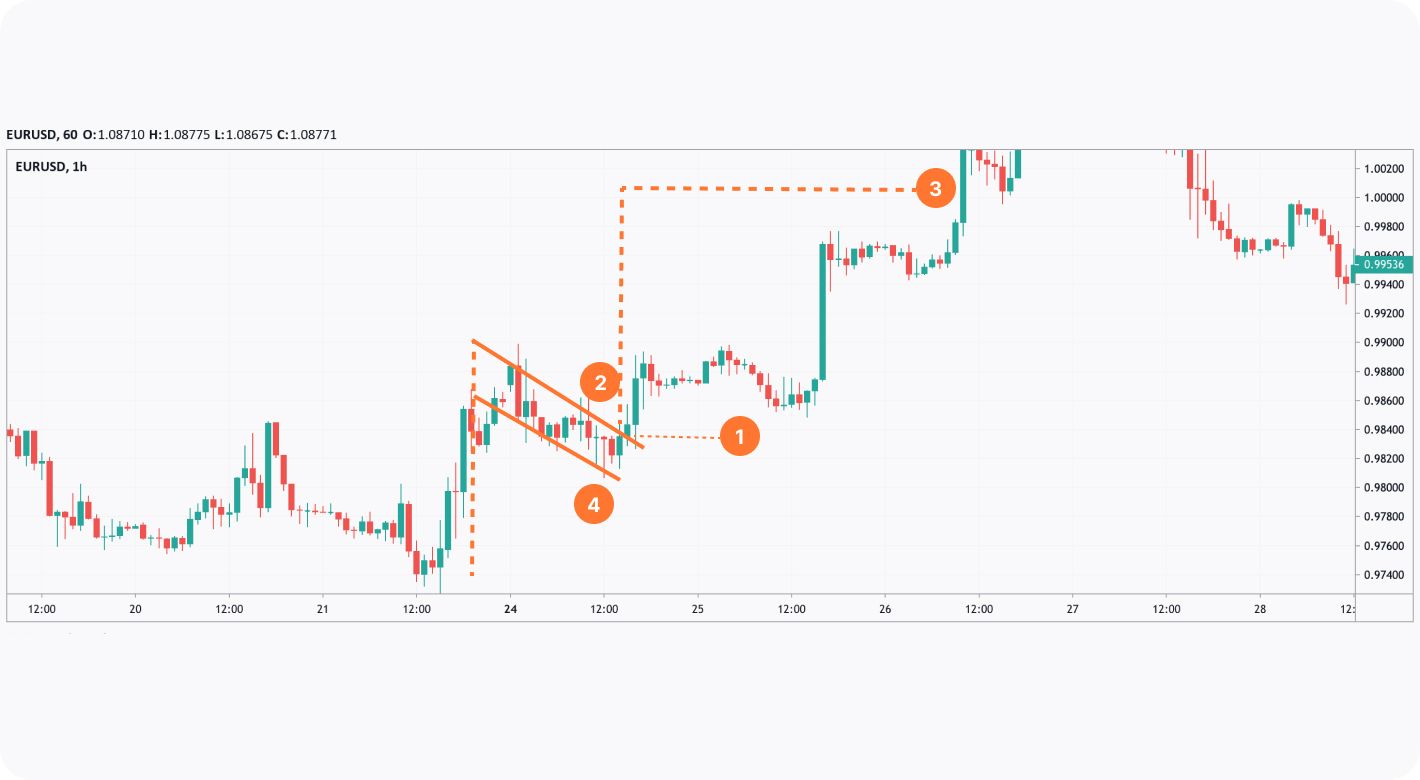
The chart above shows the bull flag on an hourly chart of the EUR/USD pair. A trader could open a buy position after the breakout candlestick (1) or the second candlestick after the breakout (2). The second candle is bullish and long, which could confirm a trend continuation.
A take-profit target would equal the flagpole length (3) and would be measured from the upper trendline. A stop-loss level could be calculated based on the risk-reward ratio. As the trend is solid but not in place for a prolonged period, a higher ratio of 1:3 would work better. Also, a trader could place the stop-loss level just below the lower trendline (4).
Bear Flag
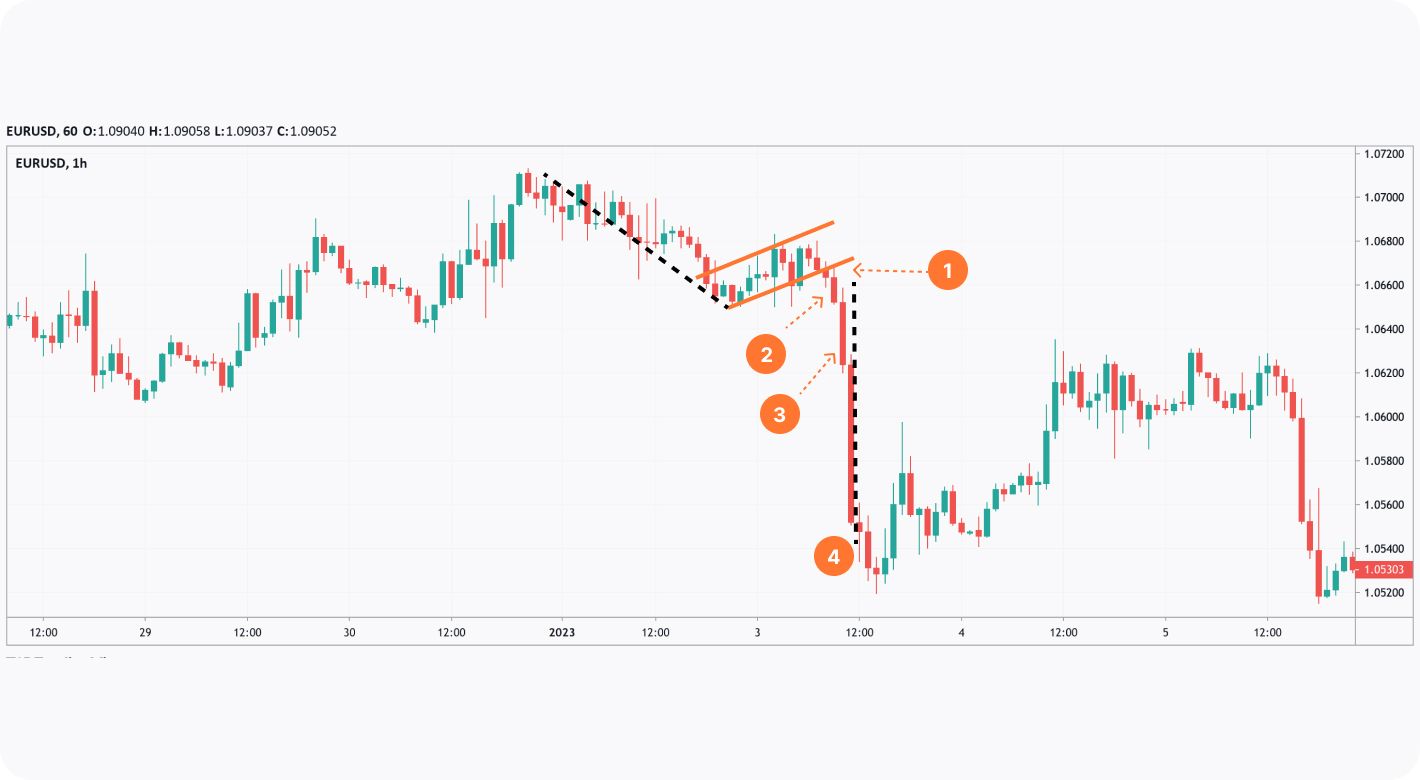
The hourly chart of the EUR/USD pair reflects a bear formation. A trader could go short after the breakout, second or third candles (1, 2, or 3). The choice would depend on the overall market sentiment and the trader’s risk aversion.
A take-profit level would equal the pole length (4). A trader could use a trailing take-profit order. A stop-loss level could be defined by the risk-reward ratio. Again, the trader could use a higher ratio as the downtrend is strong.
How to Confirm Bull and Bear Flag Pattern Signals
The primary flag signal is a trend continuation. However, the pattern may fail if market conditions change. Therefore, it’s vital to validate it.
- Volumes. A breakout is a key pattern signal that allows traders to open a trade. As there are risks of a fakeout, traders should be sure the breakout is valid. Volumes are the first tools that can confirm a breakout. If the volumes grow when the price breaks a trendline, there is a high chance it will continue moving in the breakout direction.
- Trend indicators. As flags confirm a trend continuation, oscillators won’t help traders to confirm their signals, but trend indicators may be effective. The widely used Bollinger Bands, moving averages, and Fibonacci retracements may be used. You can open an FXOpen account and test these and other indicators on live charts.
Final Thoughts
The flag pattern is one of the most popular chart patterns. Like most formations, it has specific rules that help traders determine entry and exit points. One of its advantages is that it can be formed in any timeframe of any asset. A trader can use flags in stock, index, ETF, commodity, and forex trading. Still, flags may fail. Therefore, they are validated by various technical analysis tools and fundamental events and news.
*At FXOpen UK, Cryptocurrency CFDs are only available for trading by those clients categorised as Professional clients under FCA Rules. They are not available for trading by Retail clients.
Be the first to comment