

marrio31/iStock via Getty Images
By Blu Putnam
At a Glance
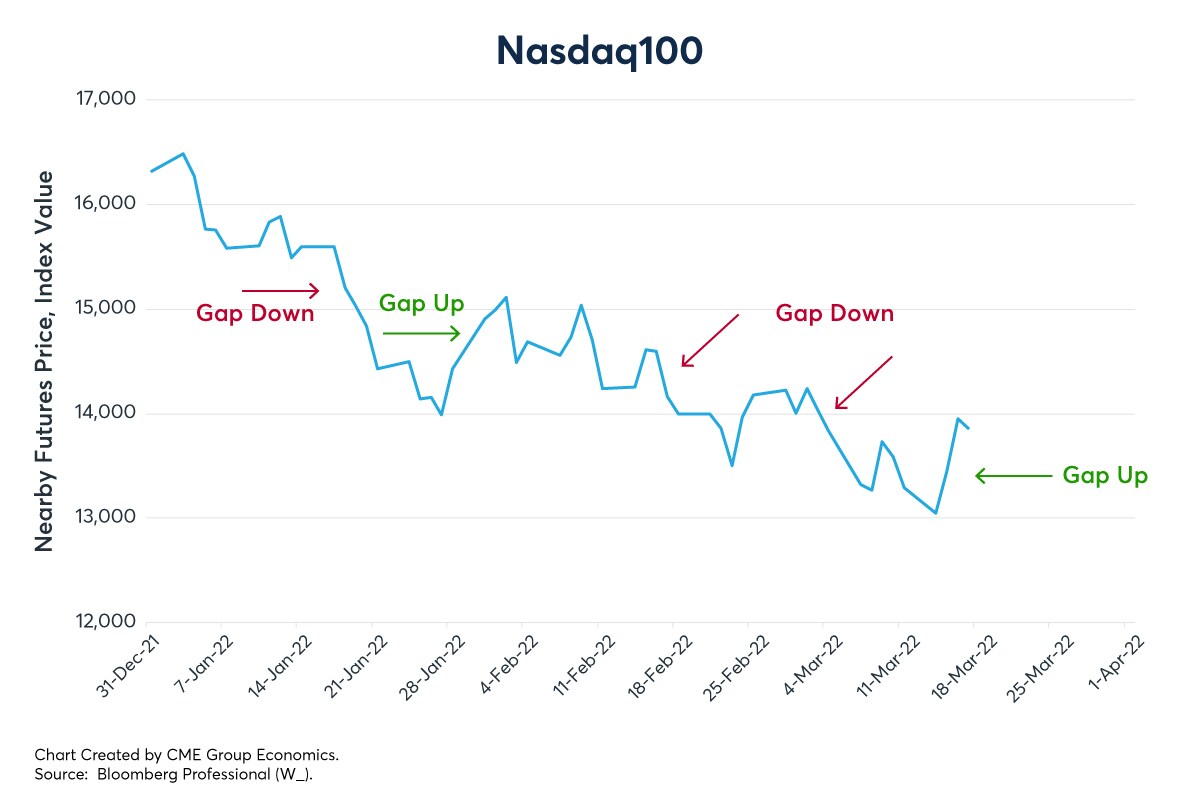
- Recent abrupt price moves in equities, energy and agriculture markets show the volatility of the current event risk environment.
- Implied volatility based on options is a strong measure of the type of uncommon market events we are seeing.
The Russian invasion of Ukraine countered by the aggressive use of sanctions by the U.S. and European Union has brought a very different type of volatility to markets.
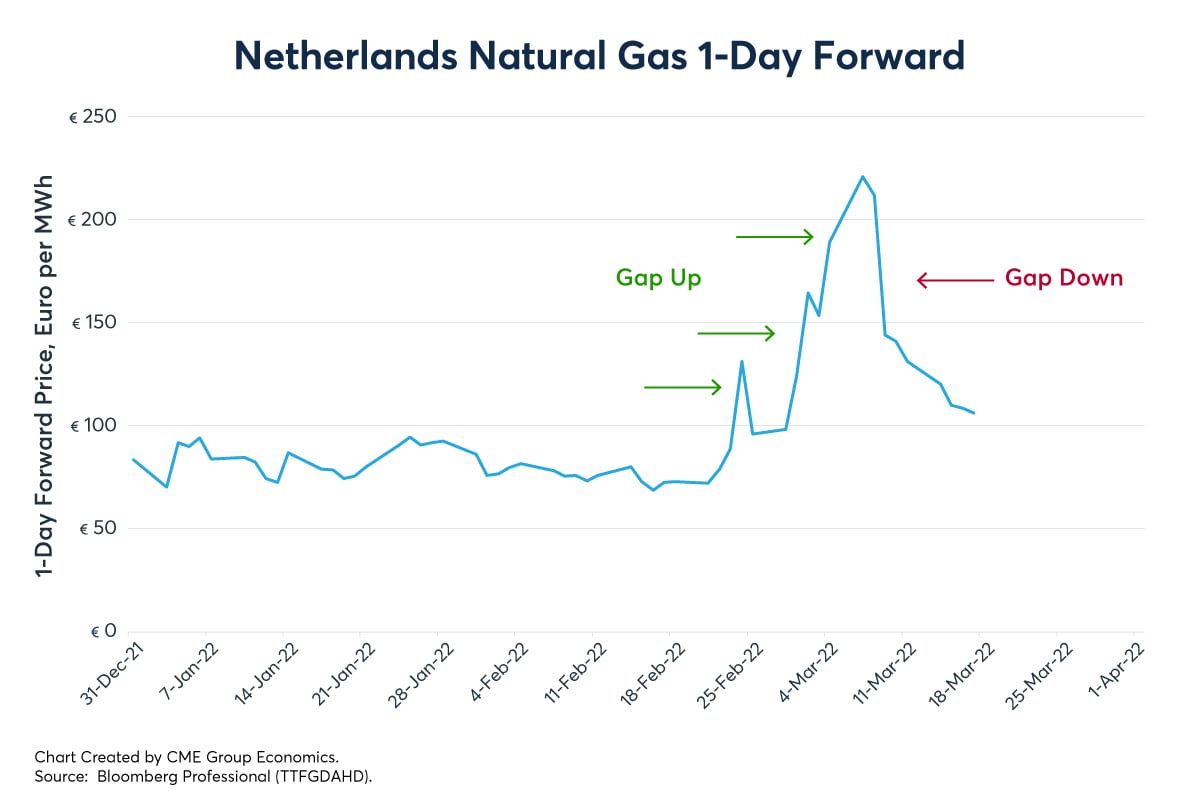
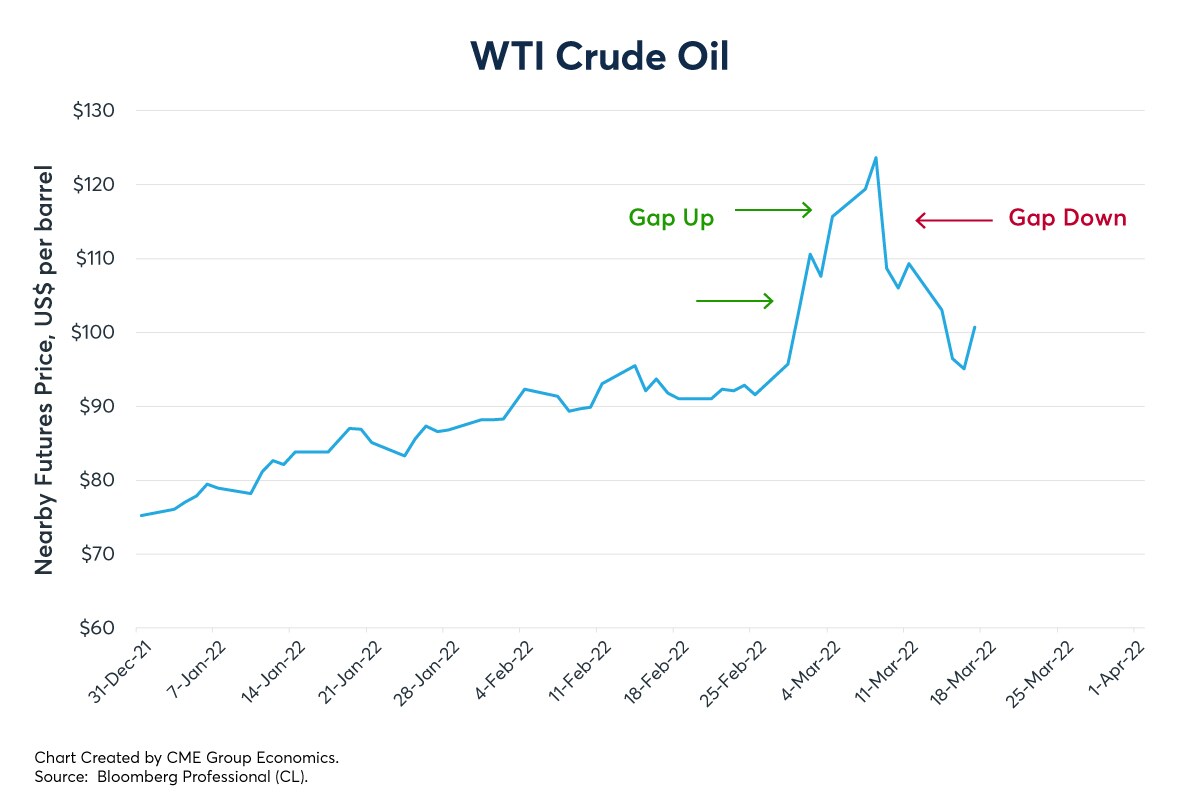
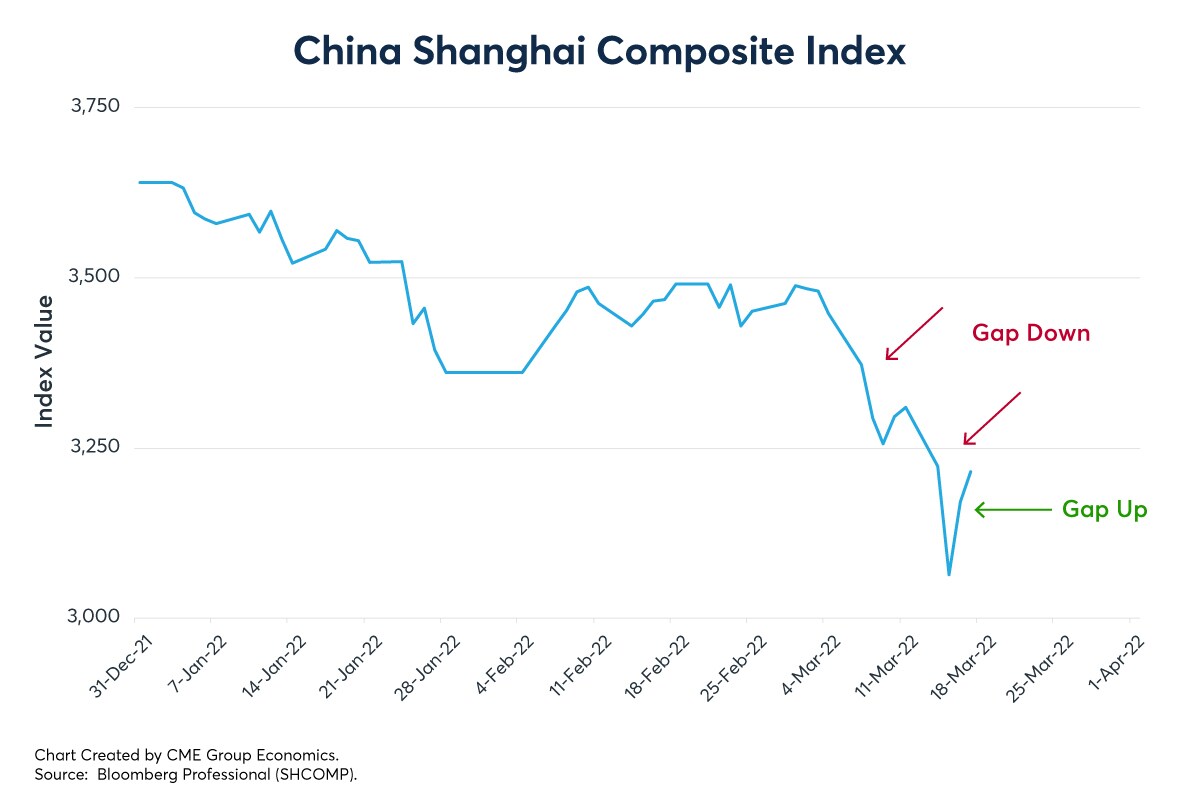
We are experiencing an environment with a sharply higher probability of large, abrupt price moves related to event risk. We call these price gaps, and interestingly, they can go big up, or big down in a New York minute. In energy markets, we see this in natural gas and WTI crude oil.
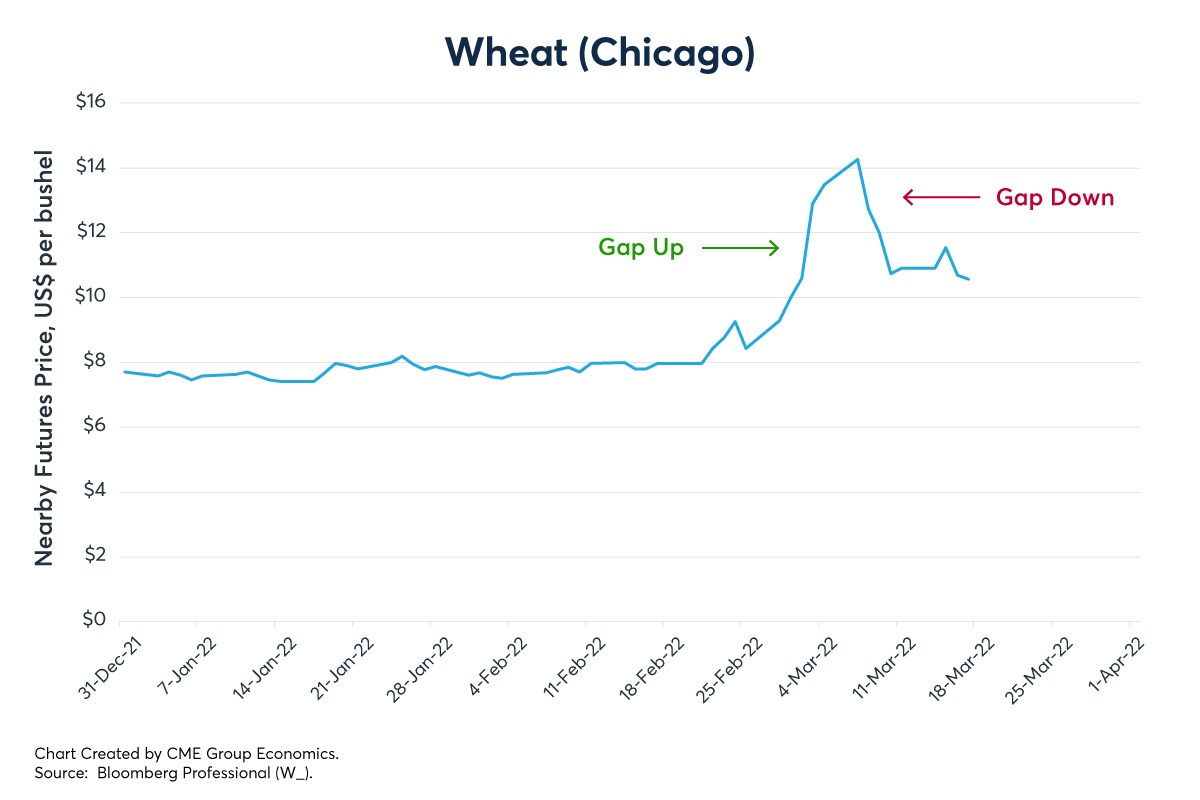
In agricultural markets, this phenomenon occurred in wheat markets through the early part of March.
Here is the management challenge for event risk.
Volatility typically reflects a simple measurement of the average of the ups and downs. Statisticians use the standard deviation. Traders look at implied volatility based on options.
The standard deviation is an average of ups and downs, and unfortunately, it is an extremely poor measure of the type of volatility we are now seeing.
What we are seeing are a few really big, abrupt price moves and then a bunch of small ones.
The Black-Scholes-Merton option model even assumes these price gaps never occur. They do, and price gaps are happening more and more in this event risk environment.
Editor’s Note: The summary bullets for this article were chosen by Seeking Alpha editors.
Be the first to comment