

Parradee Kietsirikul
By Rob Isbitts
I thought about telling this “story” through technical charts: support and resistance levels, trading ranges, technical indicators that are historically very overvalued, etc. But there’s plenty of time for that in future articles. Instead, here’s a different way to communicate the same conclusion:
Future stock market returns may disappoint many investors for years to come
This is not a prediction. It is, however, a high probability, based on my decades of studying both markets and market participants (I was an investment advisor for 27 years, and have written in the public sphere for over 20 years). You see, trees don’t grow to the sky. And stock market returns don’t typically moderate over time…they crash. That sequence can take a few years. Yet the current group of market participants may not have a sense of history, other than the flash-crash of 2020 and the single-year bear market of 2022. As we invest, “old-timers” might say…but wait, there’s more. Here’s the more for you. I hope it helps bring perspective that aids in understanding where we are in history, and what could come next. Not only in 2023, but over the next several years, even the next decade.
A conducted a research study that sought to answer the following questions regarding the S&P 500 Index:
1. Is a down year in 2022 such a big deal?
2. What does stock market history tell us about one down year that follows a very strong multi-year period?
3. Is market history really a good guide?
Methodology
I went back to 1975, in order to get enough of a sample size of annual returns. I converted that annual data into “rolling” periods of 5, 10 and 15 year. This is a long-term study, though as you will see, it has some serious immediate implications for some investors.
I used price returns, not total returns. That is, I excluded dividends. I wanted to focus on the price changes, since dividends on stocks are historically low and have been so for a long time. Dividends may indeed be a bigger factor in returns going forward, but I did not want to put that bias in this backward-looking review. I’ll be writing plenty about dividends in the months ahead. I am, after all, the founder of Modern Income Investor.
Punch Lines
Modern Income Investor (Rob Isbitts). Source for all data: YCharts
The chart above is for investors who just want the “punch lines” here. The information below gets more and more granular. So, take your pick on how far down you want to read. I’ll repeat the 3 questions from above and deliver my answers.
1. Is a down year in 2022 such a big deal?
Yes. Because this year has been driven by a true sea change. Inflation, higher interest rates, and the Fed keeping everyone on their toes (or, viewed another way, confusing the heck out of all of us), via a constantly-changing rhetoric. And, as my study shows, stock market investing tends to be more feast versus famine, with far less in between. In that chart above, notice those boxes at the bottom. Those summarize the nearly 50 years of annual return data that I highlight here but show in detail in a table at the bottom of this article.
Nearly 1/3 of the time, the S&P 500 has produced a price return of less than 15%. This is a cumulative return figure, not annualized. So, a return of less than 3% a year for 5 years, excluding dividends. That’s below the current inflation rate by a mile. And it is likely to frustrate the heck out of today’s more immediate-gratification investor masses. This is what is frustrating many of us market veterans right now: that the market has not flushed itself out, so that a true, new bull market in stocks can begin. Instead, we have this endless dance, with garbage stocks popping on any signs of life it interprets from the Fed. This obsession is not long-term healthy. As I see it, one down year is no big deal to many investors. Give them a second, and it will start to infect the psyche.
And that’s what this data tells me. Because once the assumed-to-be forever good times start to fade away, that boiling frog analogy starts to seep into market psychology. That is, the market’s emotions go from “I’m OK with a drop in my stock portfolio, because it always comes back strong.” This chart shows that is false, historically-speaking. Because not only do we have the data that shows that 1/3 of the time you earn a meager return over 5 years for taking all of that market risk. When you look out 10 and 15 years, you see that mediocre returns can be contagious. I chose a 10-year price change of 40%, and a 15-year price change of 60% as the dividing line between “I’m Ok with that” and “why am I bothering to invest in the stock market anymore.”
As you can see, around 25-30% of the time, you can look back at your S&P 500 Index fund and what have you earned, excluding dividends? Less than 4% a year if you use a simple average, and more like 3% or so if you use a return compounding approach. There was a time when investors not only said they were “long-term investors,” they meant it. We have yet to see if the modern investor is that patient. Call me skeptical. That’s why I have devoted the rest of my career to thinking outside of this box. Because someone has to.
2. What does stock market history tell us about one down year that follows a very strong multi-year period?
That these weaker time frames of 5,10 and 15 years tend to come in bunches. And, that they tend to start with a single down year that follows a historically ebullient period for the S&P 500. You know, like we have right now. Here is the 5-year price return of the S&P 500 going back a very long way. Notice that when that 5-year figure has crossed over 100% and then starts to fade down, that’s usually the start of a trend.
S&P 500 5-year rolling (YCharts and Seeking Alpha)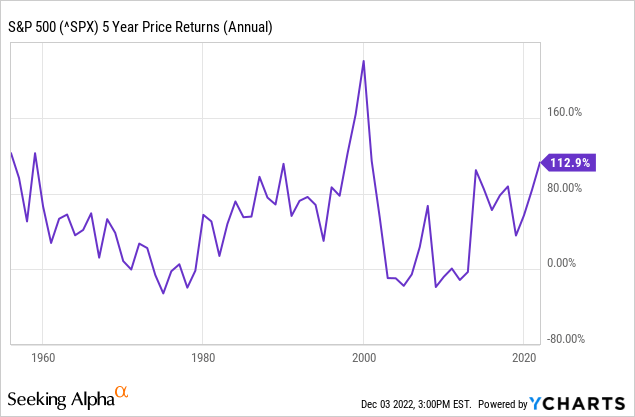
Now, take a look back at the table above. That yellow-highlighted area tells us that, barring a miracle run the next few weeks of December, that 5-year rolling return is going to crash from 113% to less than half of that. Historically, this is how the longer-term trend change starts.
I’ll also add this: it is rare that the 5, 10 and 15-year returns all fall in the same year. When it does, it usually means we are in the middle of a bigger deal than one down year that simply revives when the next year begins. See the “busy” history chart at the bottom of this article for that detail. Or, if you prefer, visualize it by looking at the rolling 10-year and 15-year price charts for the S&P 500 here.
S&P 500 10-year rolling (YCharts and Seeking Alpha)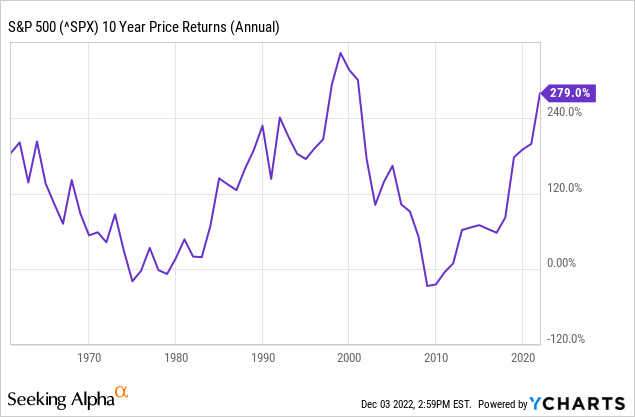
S&P 500 15-year rolling (YCharts and Seeking Alpha)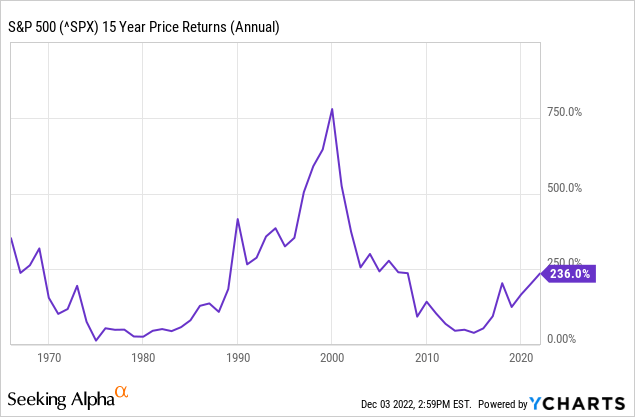
3. Is market history really a good guide?
We’re about to find out. Years ago, all of that Fed rhetoric and 24/7 markets coverage that didn’t matter because most people were not investors. And, we didn’t have 24/7 coverage. You looked at the Wall Street Journal or your local newspaper to find out what happened yesterday.
We did not have the army of self-directed traders and investors we have now. While the acceptance of investing in the mainstream is great to see, it also calls into question what still works.
Then, instant communication came on the scene, and gave the investment business its biggest “hold my beer” moment ever. You want up-to-the-minute? Now you have all you can handle. And frankly, more than most can handle, based on how poorly many investors have done this year, the first time in their investing lives that the wind was not at their back.
Next year, we should find out a lot more. 2022 will either be an anomaly in a continued secular bull market, or it will conform more to what has happened in the past. My hunch is that 2023 will be another down year for the stock market. I’ll have plenty more to say about that as we transition from 2022 to 2023. But for now, my bottom-line is that despite all of the modern adjustments to how markets, investing and communication work, there is still an element of human emotion and thought behavior patterns that never goes away. That’s the case, no matter how much a few big companies try to shift how our brains function.
Conclusions (for now)
This stock market is in trouble. One down year is likely not enough to purge the decade of easy money and the investment market speculation it has wrought. We’ve gone from the days of buy-and-hold to 2022, where you can trade S&P 500 options contracts that expire any trading day of the year. That’s progress…of some sort, anyway. But as I see it, it is all part of the risk-unwind that past investing eras teach us, but that are largely in denial as a calendar year decline in the stock market concludes.
What can change this course? If the market has shifted to a permanent state of positive vibes. I know the past pretty well. I don’t know if my take on the present is accurate, yet. I think we will all find out soon where this is going. That is, whether history is the best guide, a good guide or has been rendered irrelevant.
Finally, here’s that more detailed chart to back up my figures and opinions above. Enjoy.
Modern Income Investor (Rob Isbitts). Source for all data: YCharts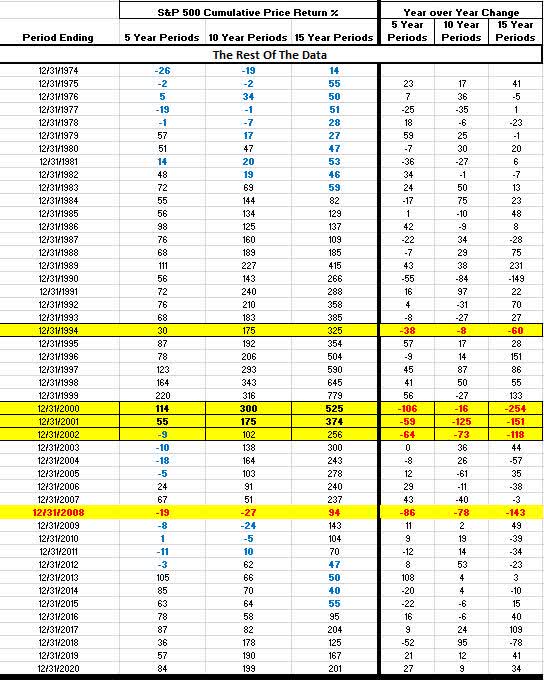
Be the first to comment