


NicoElNino
Article Purpose
Most dividend investors own more than one ETF but figuring out which one to add to best improve diversification can be tricky. The ETF Research Center offers a useful Fund Overlap Tool, but even that has its limitations. Stocks held in the same sector often move in tandem, and that’s even more true when we examine a portfolio at the industry level. Essentially, adding stocks from different industries is your best chance at improving diversification and reducing risk. Still, to my knowledge, no such tool exists for ETFs, at least not for free.
Today, I’d like to summarize the industry concentrations, by sector, for the ten largest dividend ETFs by assets under management. In addition, I will name each fund’s most complimentary ETF from a diversification perspective, present the fundamentals of a hypothetical equal-weight two-ETF portfolio, and let you decide which one looks most attractive. The concept is straightforward, but this article is full of unique information I hope you’ll find valuable. As always, I will look forward to your comments at the end.
Dividend ETF List
The ten-largest dividend ETFs by AUM and their dividend yields are the following:
- Vanguard Dividend Appreciation ETF (VIG): 1.88%
- Vanguard High Dividend Yield ETF (VYM): 3.04%
- Schwab U.S. Dividend Equity ETF (SCHD): 3.29%
- iShares Core Dividend Growth ETF (DGRO): 2.09%
- SPDR S&P Dividend ETF (SDY): 2.67%
- iShares Select Dividend ETF (DVY): 2.99%
- iShares Core High Dividend ETF (HDV): 3.07%
- First Trust Value Line Dividend ETF (FVD): 1.85%
- ProShares S&P 500 Dividend Aristocrats ETF (NOBL): 1.98%
- First Trust Rising Dividend Achievers ETF (RDVY): 1.55%
I have reviewed them all at some point, and my favorite all-around ETF is SCHD. Others like DVY and HDV can further enhance yield, but you don’t have to pick just one. It’s about getting the balance right to achieve your investment objectives. That’s what I hope you’ll get out of this article, so with that said, let’s start with each ETF’s industry concentration in the Communication Services sector.
Industry Concentrations By Sector
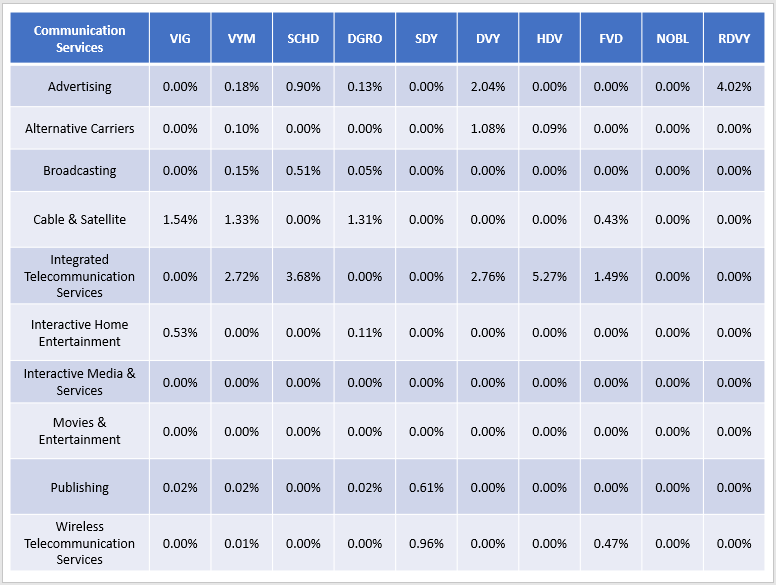
Communication Services
Dividend ETFs aren’t known for their high exposure to Communication Services stocks. HDV and RDVY have the highest total exposures of the ten funds analyzed at 5.36% and 4.02%, respectively. With HDV, Verizon Communications (VZ) explains nearly all of this exposure, while Omnicom Group (OMC) and The Interpublic Group of Companies (IPG) each have 2% weightings in RDVY.
The Sunday Investor
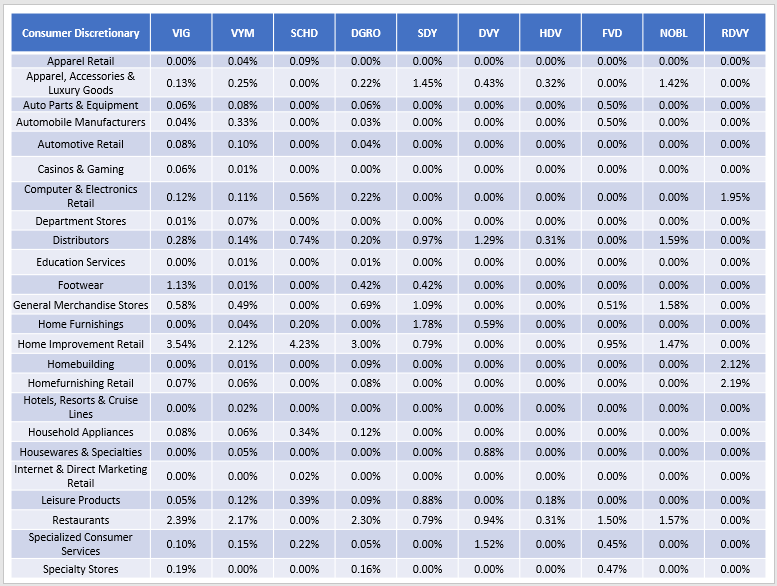
Consumer Discretionary
All ten ETFs have less than 10% exposure to the Consumer Discretionary sector, but some are better balanced than others. For example, VIG, VYM, SCHD, DGRO, and NOBL all have exposures between six and nine percent. Key holdings are often in the Home Improvement Retail industry with stocks like Home Depot (HD) and Lowe’s Companies (LOW), along with Restaurant stocks like McDonald’s (MCD) and Starbucks (SBUX).
The Sunday Investor
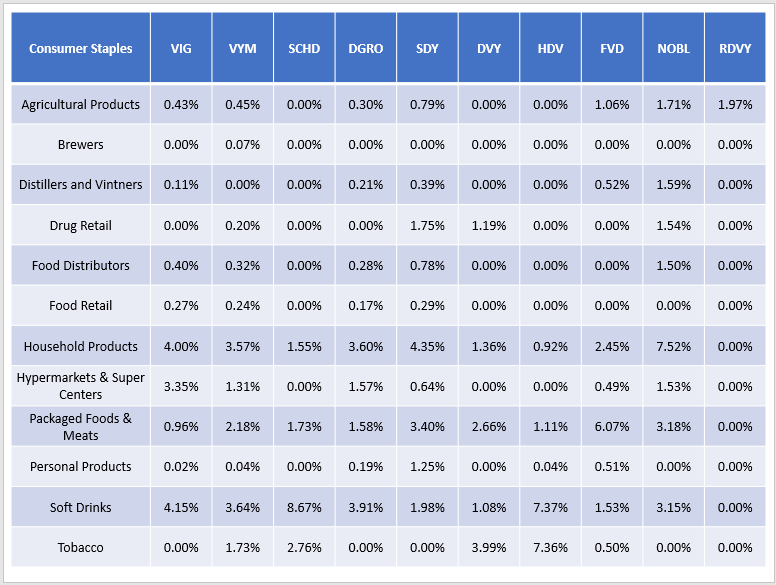
Consumer Staples
The Consumer Staples sector is a favorite among dividend investors because it’s traditionally defensive and tends to pay above-average yields. Most exposure is in just four industries:
- Soft Drinks: PepsiCo (PEP), Coca-Cola (KO)
- Household Products: Procter & Gamble (PG), Colgate-Palmolive (CL)
- Packaged Foods & Meats: Hormel Foods (HRL), McCormick & Co. (MKC)
- Tobacco: Altria Group (MO), Philip Morris (PM)
The Sunday Investor
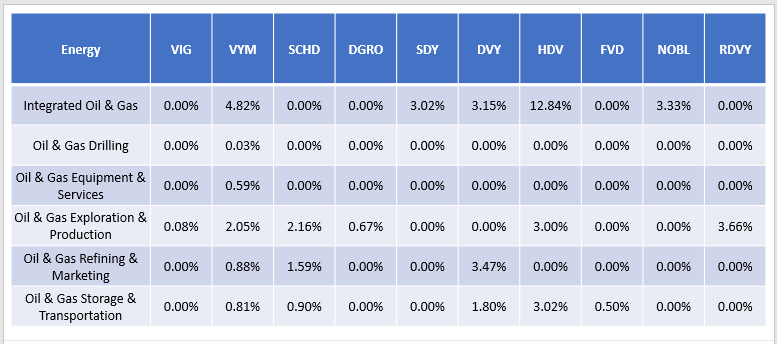
Energy
Energy has proven to be an excellent defender against high inflation this year. This small sample of ETFs helps illustrate this point, given how HDV and its 18.86% exposure to the sector squeaked out a 4.17% YTD gain through July. In contrast, VIG and DGRO registered 9.96% and 8.06% losses, primarily due to their near-zero Energy exposures.
The Sunday Investor
The leading Integrated Oil & Gas stocks are Exxon Mobil (XOM) and Chevron (CVX). For investors looking to take on more risk, you could turn to E&P stocks like EOG Resources (EOG) and Pioneer Natural Resources (PXD), found most prominently in SCHD and HDV, respectively.
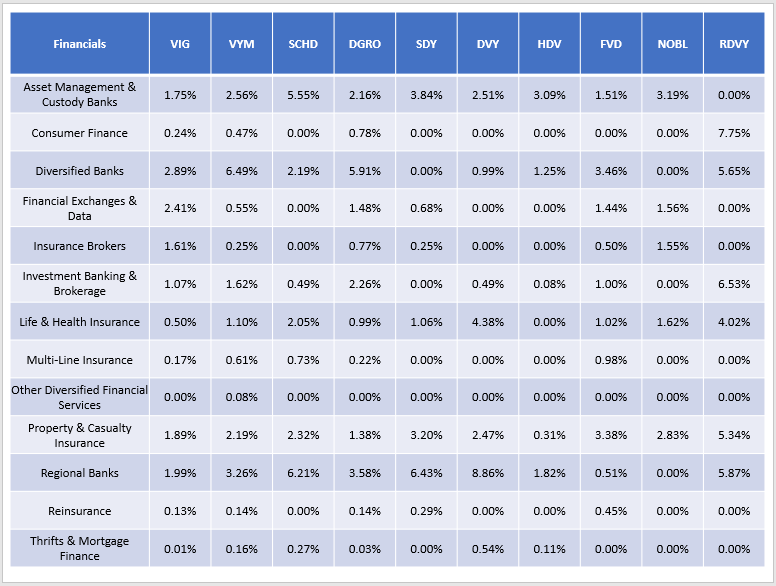
Financials
The Financials sector is interesting because its industries offer vastly different risk-return profiles. To illustrate, ETFs like SCHD, SDY, and DVY rely heavily on regional banks, but these are very risky and tend to underperform substantially in recessions. The SPDR S&P Regional Banking ETF (KRE) lost over 60% during the Great Financial Crisis and took more than six years to recover, according to Portfolio Visualizer.
The most popular ones are KeyCorp (KEY), PNC Financial Group (PNC), and Regions Financial (RF), with betas averaging 1.29. Asset Management & Custody Banks are also quite risky, while I consider Diversified Bank stocks like JPMorgan Chase (JPM) and U.S. Bancorp (USB) to be safer picks.
The Sunday Investor
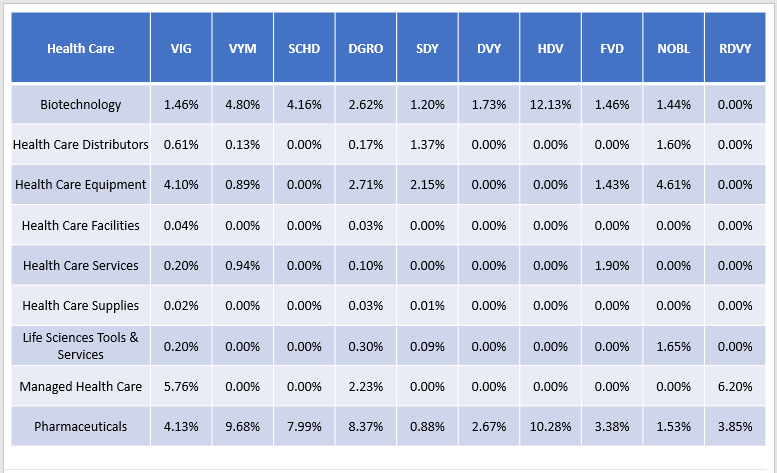
Health Care
The Health Care sector is led by Biotechnology stocks like AbbVie (ABBV), Amgen (AMGN), and Bristol-Myers Squibb (BMY). All three are in VYM and HDV for their 3.94%, 3.03%, and 2.88% dividend yields. Another key industry is Pharmaceuticals, which includes Johnson & Johnson (JNJ), Merck & Co. (MRK), and Pfizer (PFE). Unfortunately, that’s pretty much it. The average Health Care exposure for these 10 ETFs is about 12%, so you may even consider buying these individual stocks on your own.
The Sunday Investor
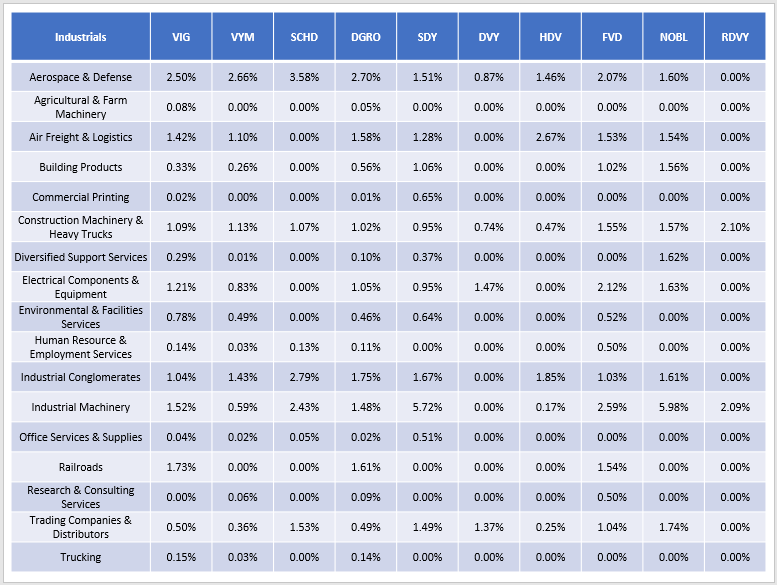
Industrials
Dividend-paying Industrial stocks include those from the Industrial Machinery, Aerospace & Defense, Industrial Conglomerates, Construction Machinery & Heavy Trucks, and Air Freight & Logistics industries. Think Illinois Tool Works (ITW), Lockheed Martin (LMT), 3M (MMM), Caterpillar (CAT), and United Parcel Service (UPS). On average, Industrials make up over 11%, though NOBL has 18.86% exposure across 12 stocks and nine industries.
The Sunday Investor
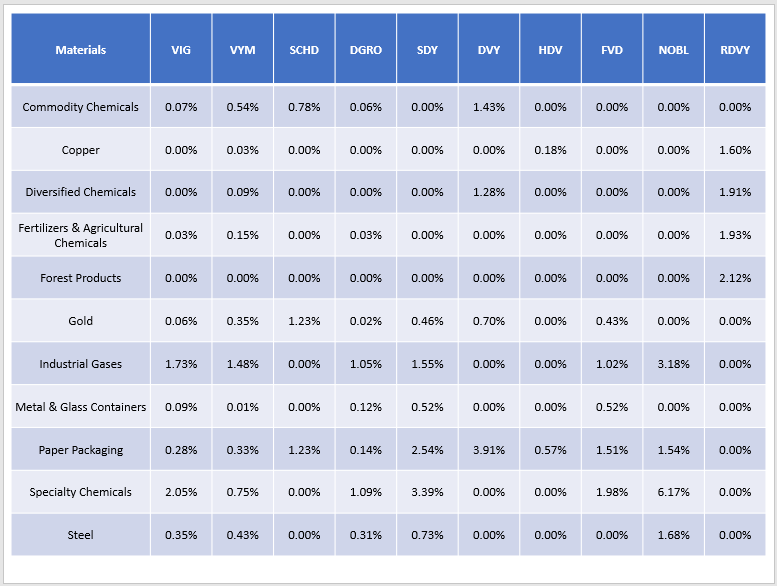
Materials
The Materials sector isn’t prevalent in dividend ETFs right now. Still, like Energy, this sector can be a vital hedge, and it’s an area where the Dividend Aristocrats ETFs (SDY and NOBL) have an advantage. If you’re looking to add individual stocks, Amcor (AMCR), Air Products & Chemicals (APD), Linde (LIN), Nucor (NUE), and PPG Industries (PPG) are the five most common holdings.
The Sunday Investor
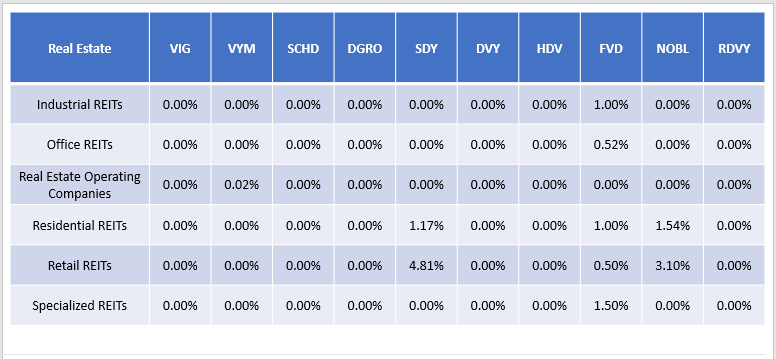
Real Estate
REIT distribution income isn’t qualified, so finding a dividend ETF with significant Real Estate exposure is challenging. Again, the Dividend Aristocrat ETFs are your best bets, but it’s still under 6%. The three most notable securities are Essex Property Trust (ESS), Federal Realty Investment Trust (FRT), and Realty Income (O), with yields of 3.10%, 4.11%, and 3.99%.
The Sunday Investor
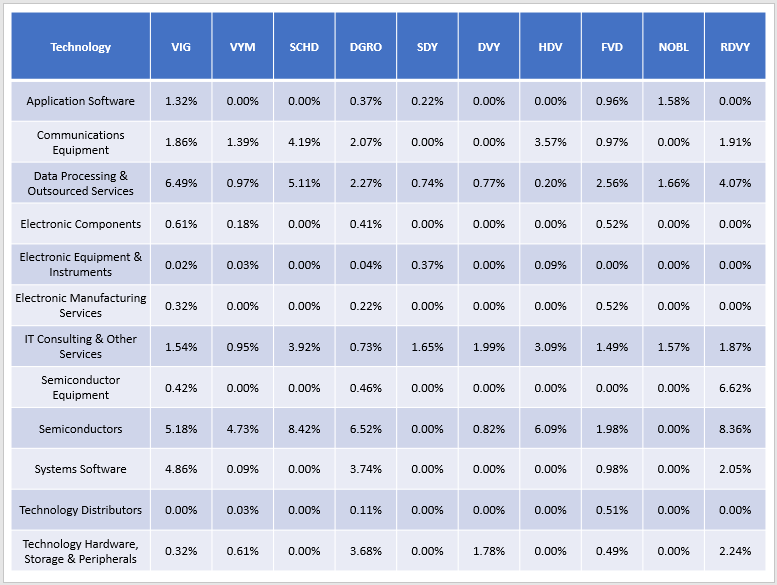
Technology
Most investors first bring up an ETF’s five- or ten-year chart and use that to help predict future returns. They realize the dangers of this, but it’s often hard to justify buying an underperforming ETF, thinking it will turn around soon. However, I must remind readers that most of a portfolio’s performance is explained by sector and industry allocations. Over the last five years, SCHD and HDV were the best- and worst-performers, but their fortunes have reversed in the last year. Look no further than each ETF’s Technology sector exposures in the table below.
The Sunday Investor
Dividend investors often favor semiconductor stocks because of their below-average valuations. For example, the semiconductor stocks in RDVY currently trade at 20.30x forward earnings, while its semiconductor equipment stocks trade even cheaper at 14.46x forward earnings. The downside is they don’t offer much yield, with one or two percent being the norm. You could go as high as 3.96% with Intel (INTC), but most of us know how that can turn out.
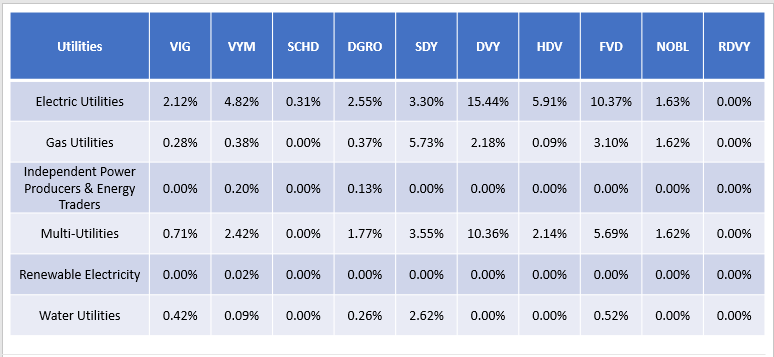
Utilities
Finally, Utilities are prevalent in most, but not all, dividend portfolios. ETFs that follow the market (VIG, DGRO, SCHD) tend to have minimal exposure. However, you can differentiate by owning SDY, HDV, and especially DVY, which has a 28% exposure to the sector.
The Sunday Investor
The five most popular Utilities stocks and their dividend yields among these ten ETFs are:
- NextEra Energy (NEE): 1.87%
- Southern Co. (SO): 3.44%
- Consolidated Edison (ED): 3.19%
- Eversource Energy (ES): 2.73%
- American Electric Power (AEP): 3.09%
Creating A Diversified Two-ETF Portfolio
For each ETF, I’ve determined what would be the most efficient addition that would minimize industry overlap. I’ve also calculated each portfolio’s fundamental metrics, which I will summarize near the end of the article.
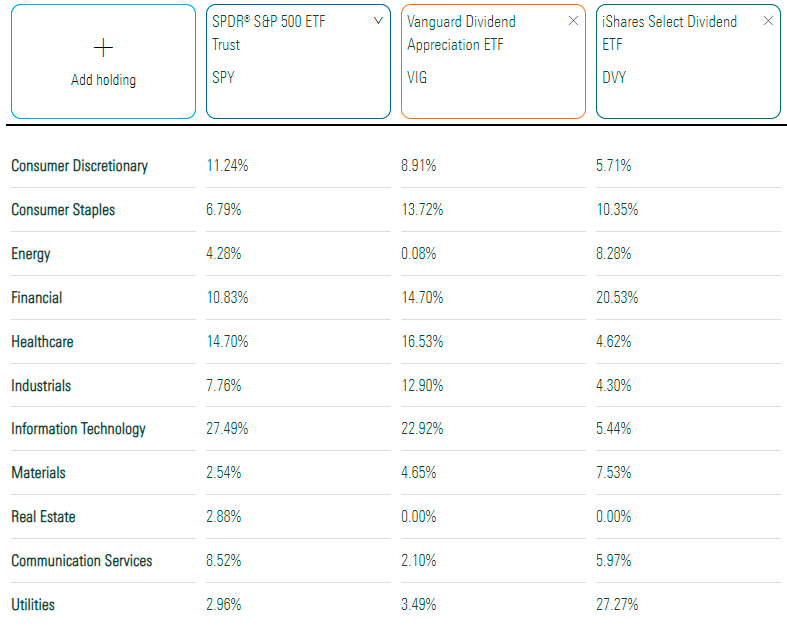
VIG
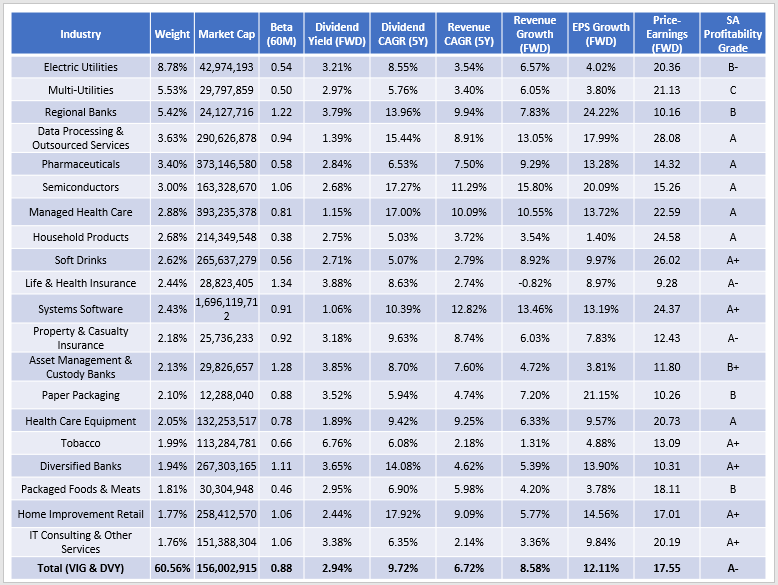
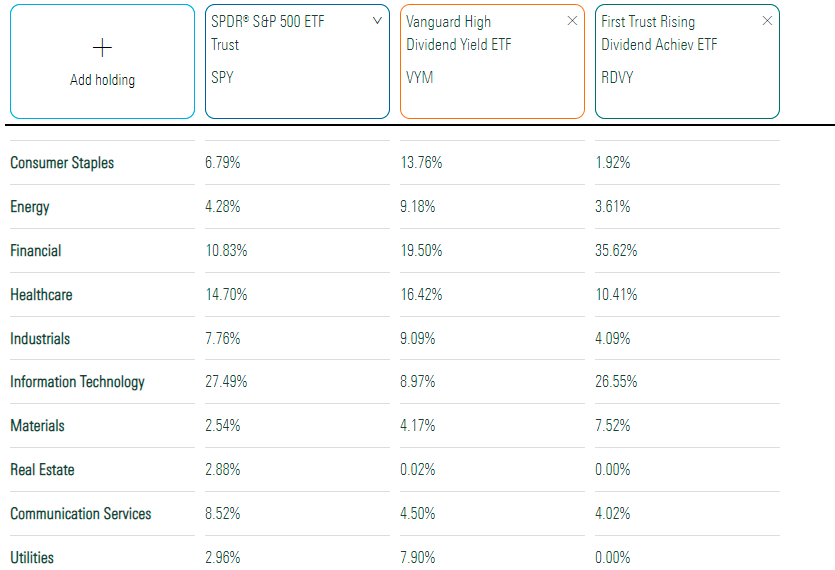
VIG’s biggest weakness is its lack of defensive protection through the Energy and Utilities sectors. DVY helps solve this, with 8% and 24% more exposure.
Morningstar
This two-ETF portfolio is pretty well diversified at the industry level, with 60.56% of assets in the top 20. This figure is an improvement on VIG’s concentration (67.45%) and DVY’s (79.67%) and makes it more diversified than the SPY (61.48%) despite fewer holdings (360 vs. 500).
The Sunday Investor
VYM
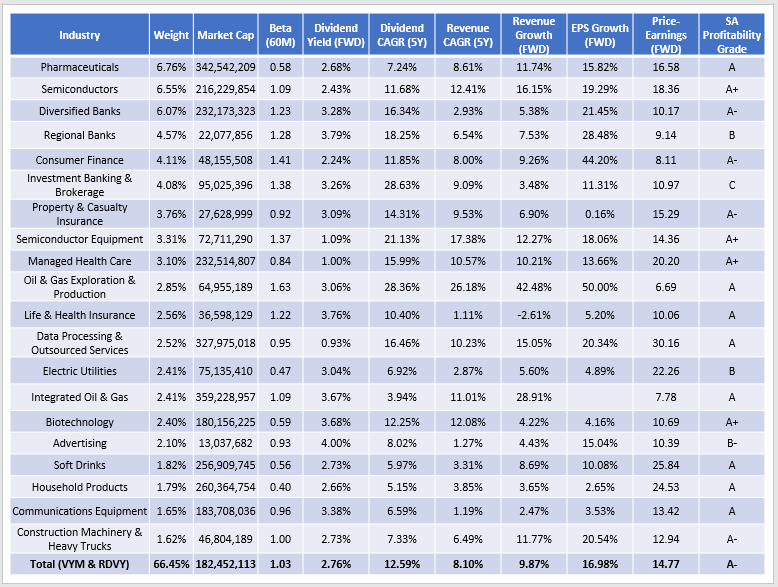
VYM is a well-diversified ETF on its own, but it lacks a significant Technology component. For that, RDVY can assist.
Morningstar
The resulting portfolio would have pretty good fundamentals, as it combines a low-beta ETF with a high-beta ETF to net out close to one. The estimated one-year revenue and earnings per share growth rates are 9.87% and 16.98%, and the gross yield of 2.76% is solid. However, you’ll have to account for RDVY’s high expense ratio, which at 0.50%, may be an unreasonable ask.
The Sunday Investor
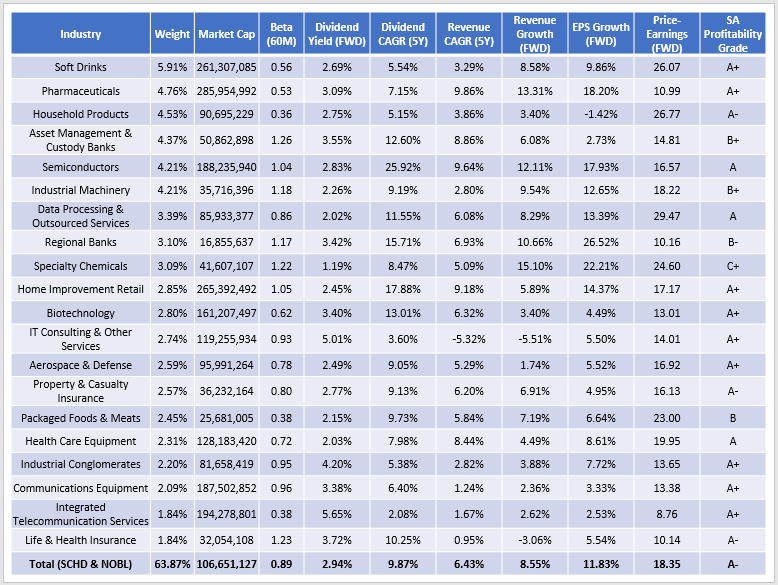
SCHD
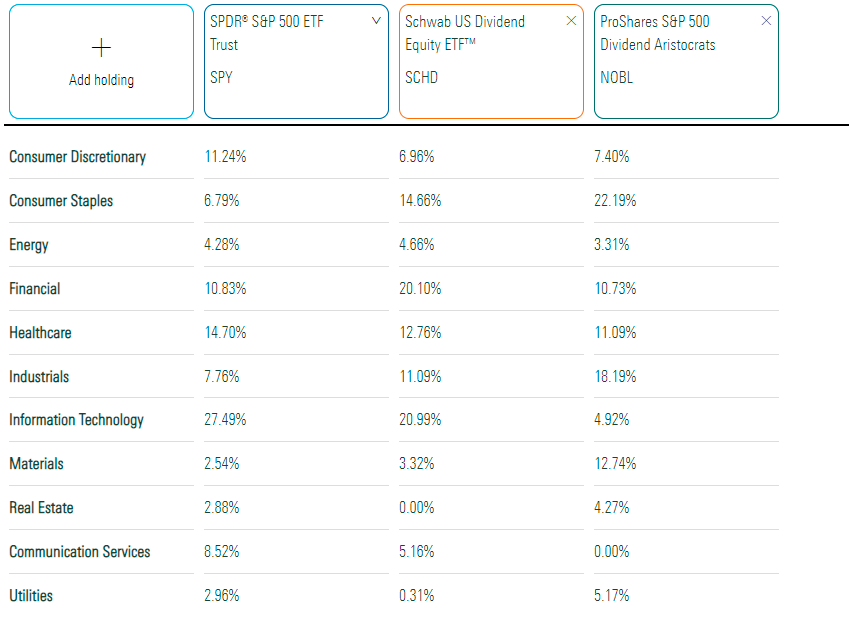
The most efficient complement to SCHD is NOBL, which has 16% less Technology exposure and 9% less Financials exposure. It adds some Real Estate and Utilities exposure, plus some more in Industrials and Materials.
Morningstar
At the industry level, here is how the two-ETF portfolio looks. Instead of Electric Utilities as the top industry, Soft Drink stocks like PepsiCo are the dominant holdings, followed by Pharmaceuticals and Household Products.
The Sunday Investor
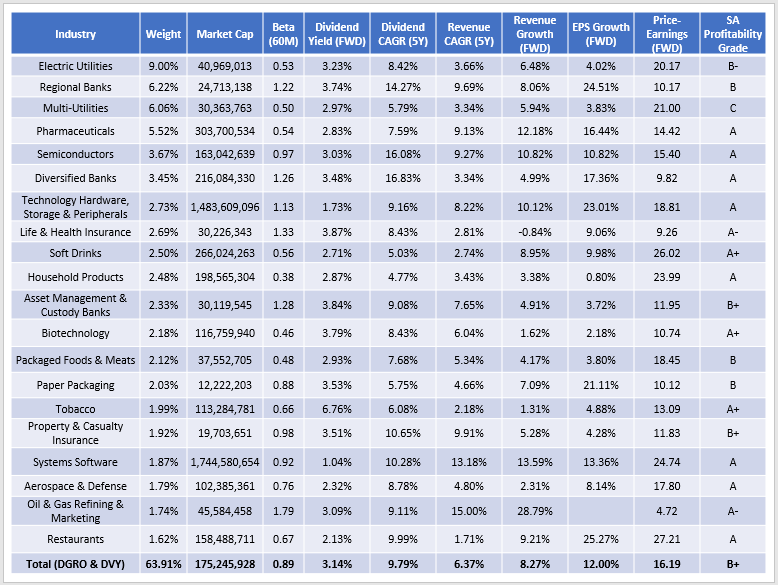
DGRO
Like with VIG, the most efficient addition for DGRO holders is DVY, which isn’t surprising given its similarities. Adding DVY to your portfolio boosts Energy and Utilities exposure and could be helpful if inflation continues to run hot.
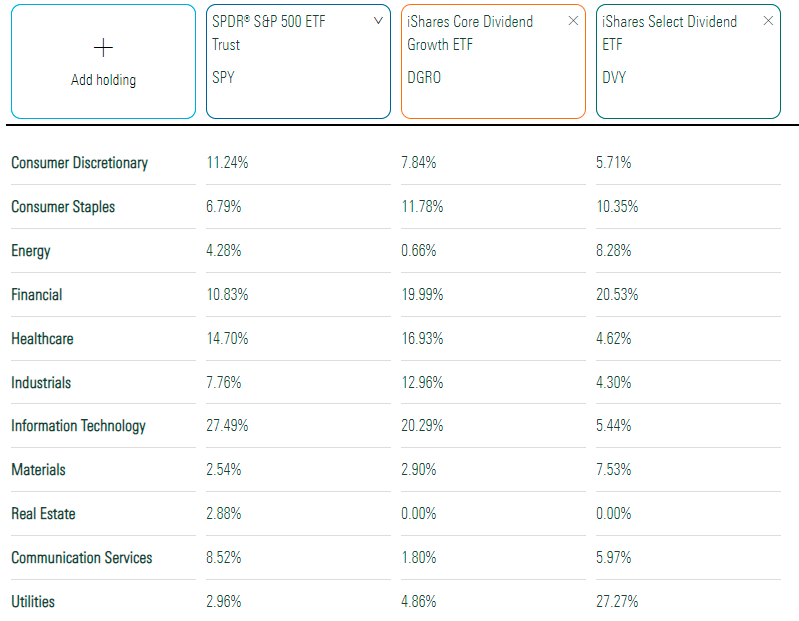
Morningstar
DGRO & DVY combine to form a portfolio that yields 3.14% before fees with a 16.19 forward price-earnings ratio. However, we see profitability sacrificed for the first time, as the weighted-average Seeking Alpha Profitability Grade dropped to a B+. When the yield increases, profitability often decreases, which high-yield investors should keep in mind.
The Sunday Investor
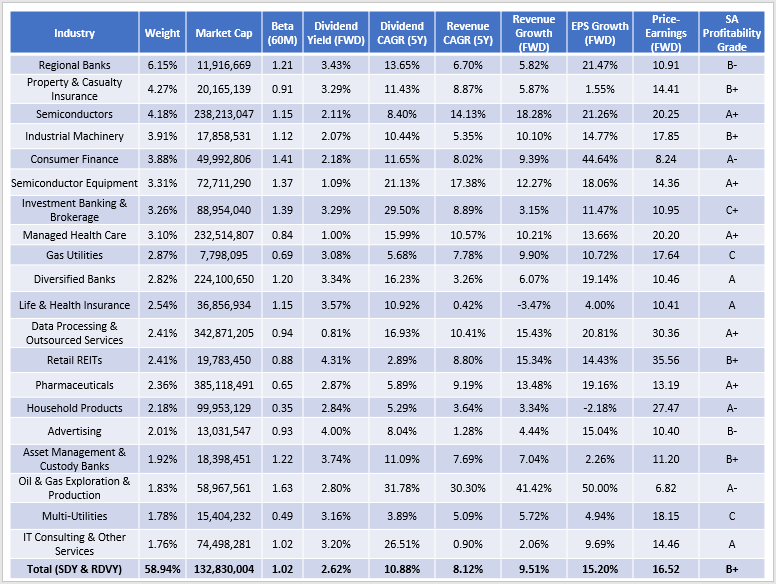
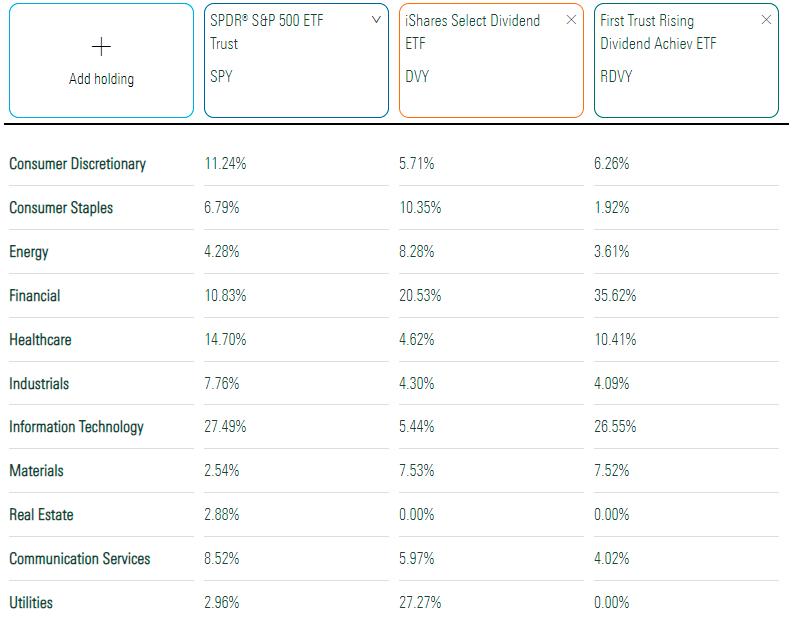
SDY
By far, the most efficient addition for SDY shareholders would be RDVY. This all-cap Dividend Aristocrats ETF requires 20 consecutive years of dividend growth, so it’s unlikely to include many Technology stocks for several years. RDVY’s 26.55% Technology exposure addresses that structural problem.
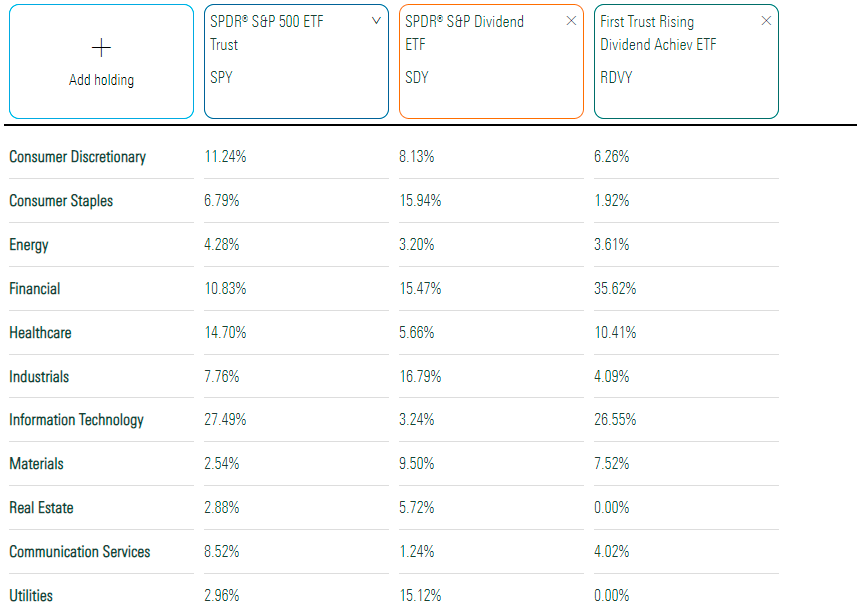
Morningstar
This is the most diversified portfolio yet, with 58.94% of assets in the top 20 industries. The 1.02 five-year beta aligns with the broader market, but you’re getting 15.20% earnings growth at a 16.52x forward earnings valuation.
The Sunday Investor
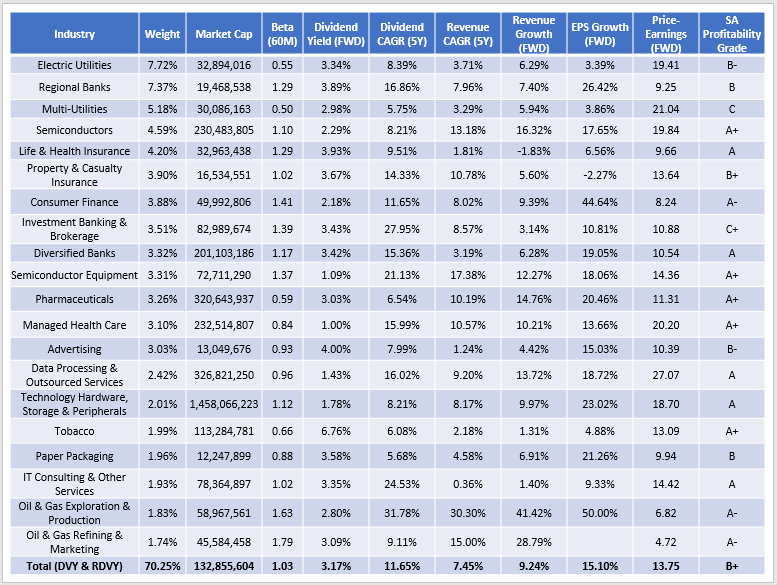
DVY
Earlier, I showed how DVY was an excellent addition to VIG. However, if you already own DVY and have no intentions of selling, RDVY also works well. The key reason is that DVY plays on the Utilities sector, while RDVY is the opposite. One of the criteria for RDVY is for constituents to have a cash to total debt ratio above 50%, which isn’t easy to achieve in this capital-intensive sector.
Morningstar
DVY and RDVY combine to form the least-impressive diversified portfolio, with the top 20 industries totaling over 70%. Perhaps this indicates that both are better satellite rather than core holdings. Nonetheless, here are the fundamentals for this two-ETF portfolio. Note how it’s the cheapest so far, with a 13.75x forward earnings valuation.
The Sunday Investor
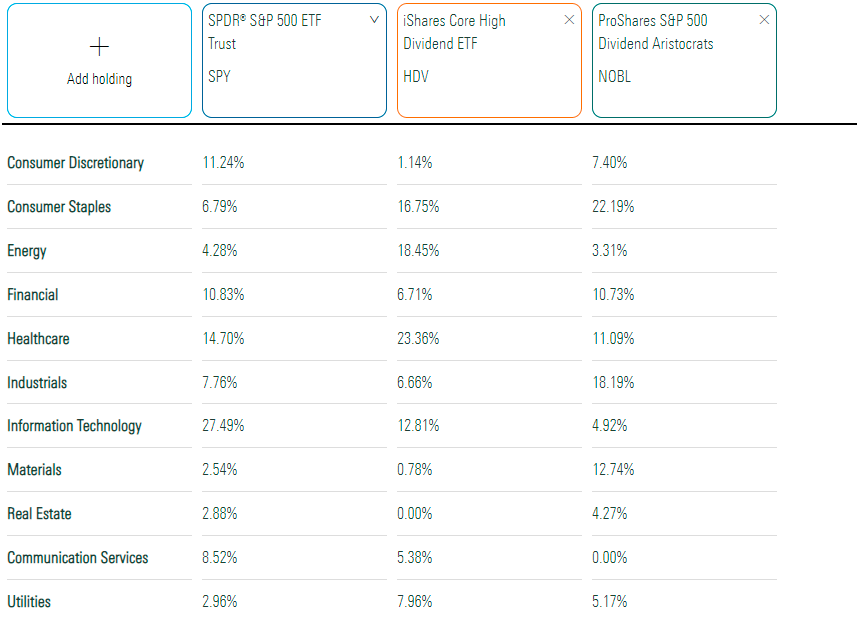
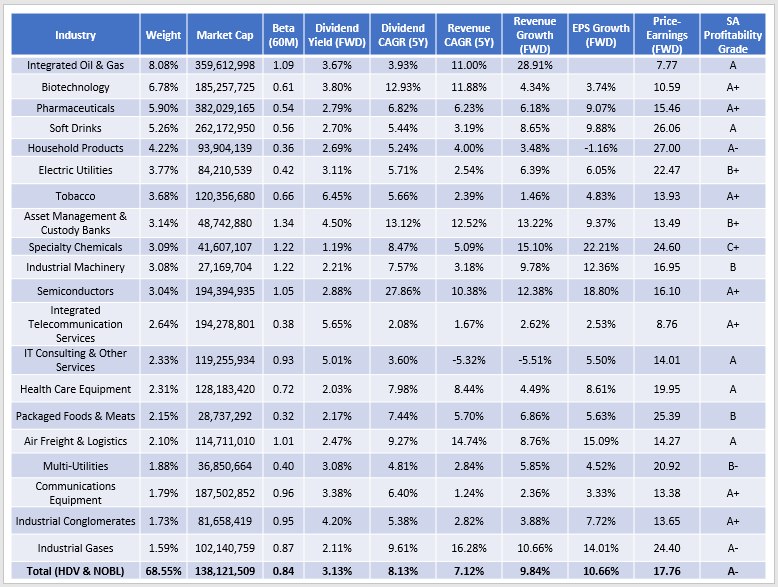
HDV
For the remaining ETFs, RDVY is the most efficient addition. However, I think you get the point by now. Adding in the most tech-oriented ETF will improve diversification, so from now on, I’ll choose the next-best ETF to add. For HDV, that’s NOBL. HDV now has a bit too high Energy exposure for my liking, and NOBL helps balance that out to a more reasonable level.
Morningstar
The combined portfolio is still among the most expensive on a forward earnings basis (17.76x). However, it’s also the least volatile and generates a 3.13% gross yield. Neither ETF has a huge expense ratio, so there’s a good chance you’ll get close to a 3% yield.
The Sunday Investor
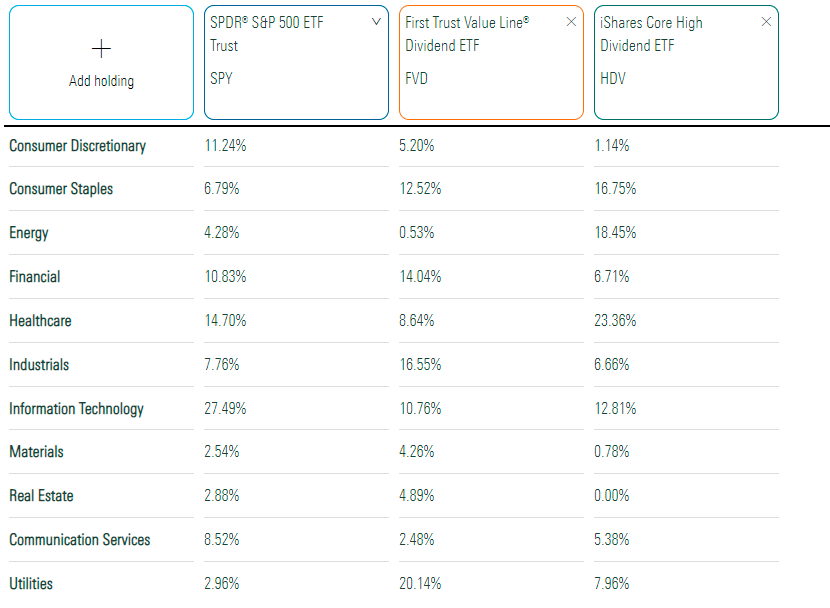
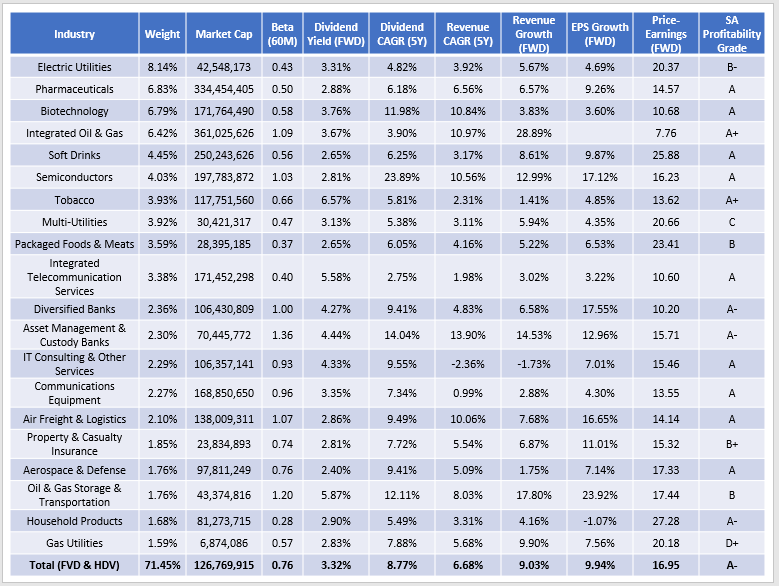
FVD
FVD and HDV mesh nicely, with the latter adding necessary Energy and Health Care exposure. In exchange, it will reduce Financials and Utilities and create a nice-looking portfolio suitable for the most conservative investors.
Morningstar
The table below shows that this portfolio’s five-year beta is just 0.76 and has a gross yield of 3.32%. The key drawback is the lack of a growth component, but it could be a fair tradeoff if you’re nearing retirement.
The Sunday Investor
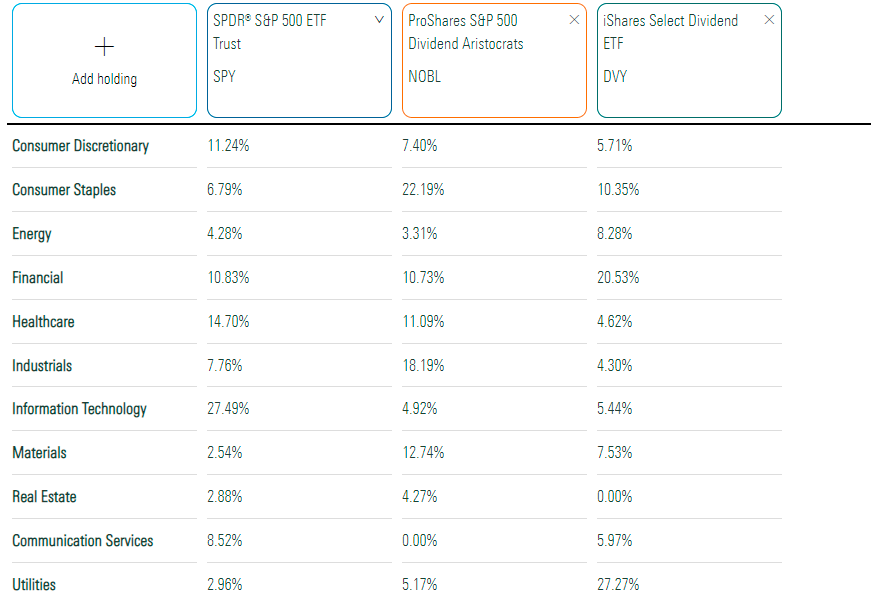
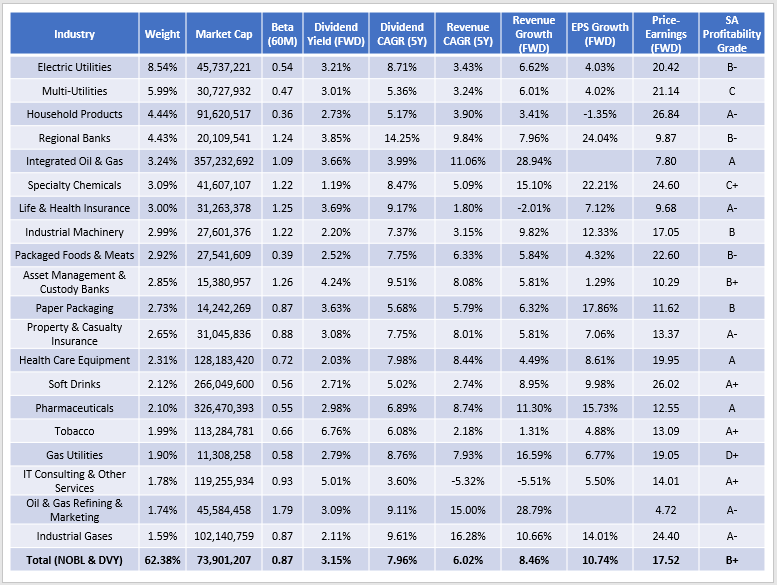
NOBL
The most efficient add-on for NOBL shareholders is HDV, but since that was already covered, the next-best choice is DVY. The reason is that NOBL includes many Consumer Staples and Industrials stocks, and DVY cuts this total exposure by about 25%.
Morningstar
One unique feature of this combined portfolio is its relatively low $74 billion weighted-average market capitalization. The other metrics don’t look overly impressive, so I think this diversification by size is the biggest draw.
The Sunday Investor
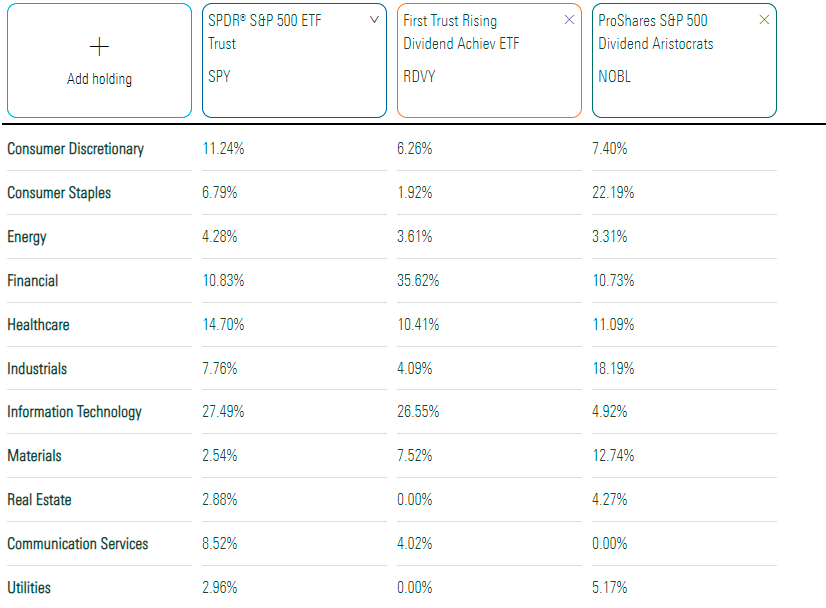
RDVY
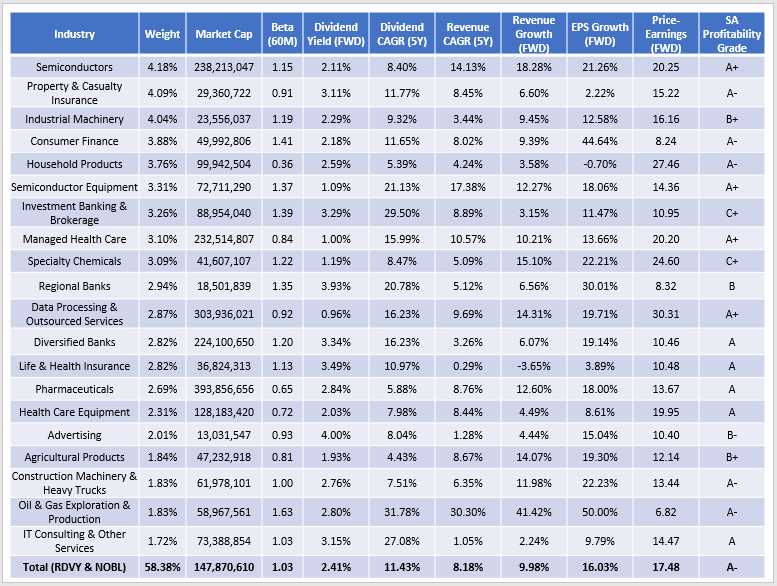
Finally, for the non-traditional dividend investor who primarily owns RDVY, NOBL appears to be a solid addition. NOBL helps offset RDVY’s high Financials and Technology exposure and improves the portfolio’s dividend consistency.
Morningstar
The resulting portfolio is the most diversified yet, with just 58.38% of assets in the top 20 industries. Valuation is average at 17.48x forward earnings, but the revenue and earnings growth are solid, and the A- Profitability Grade suggests quality is high. The main problem with this combination is the high expense ratio, so it wouldn’t be my recommendation.
The Sunday Investor
Summary and Conclusion
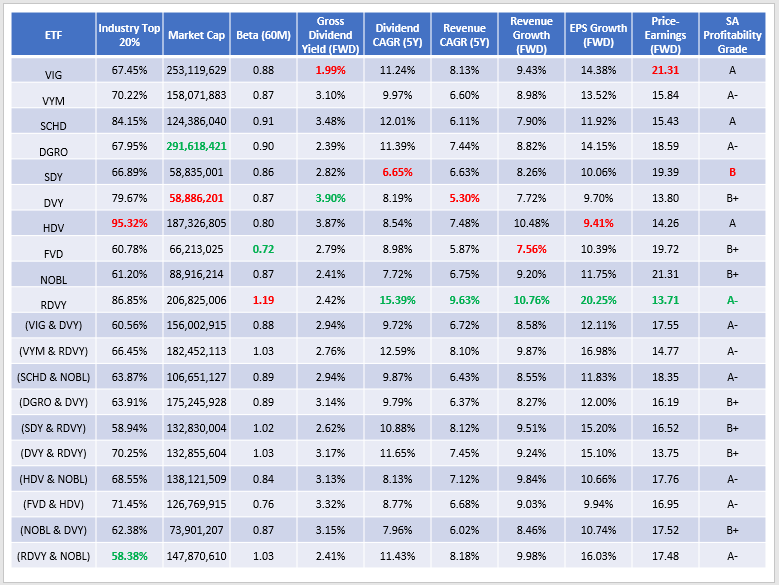
Below are summary statistics for each ETF and the combined two-ETF portfolios described in this article. I’ve color-coded the table to highlight the best (green) and worst (red) ETFs for each metric.
The Sunday Investor
No ETF is perfect, but here are a few quick observations.
- FVD is the least volatile but has the lowest forward revenue growth rate.
- VIG is among the best-diversified but has the lowest gross dividend yield and the highest forward price-earnings ratio.
- RDVY looks excellent on growth and valuation but is the most volatile.
- DVY has the highest gross dividend yield, but the lowest five-year revenue growth rate, suggesting future growth isn’t well-supported.
In the Active Equity Model ETF, I manage at the Hoya Capital Income Builder Marketplace, fund overlap and the weights I assign to the above metrics are key considerations. Right now, data flowing in from this earnings season suggests caution is warranted, so I’m looking to keep the portfolio’s beta between 0.90 and 0.95 and the valuation around 16-17x forward earnings. In the event I’m wrong, I’ve also aimed for double-digit revenue and earnings growth, something that’s difficult to achieve.
Key Takeaways
One key takeaway is how well NOBL complements other dividend ETFs, including SCHD, HDV, DVY, and RDVY. I’ve never really given it credit for it in my many criticisms of the fund in the past, but it’s an important consideration. Rarely do investors own just one ETF, so when you read mine or any other author’s analysis here on Seeking Alpha, always consider how it fits into your portfolio. What may be a buy for some may not be suitable for you, depending on what else you hold.
I also hope this article will help you understand the factors that drive performance rather than how well an ETF has performed historically. Overwhelmingly, low-volatility and low-valuation ETFs like HDV did great in the year’s first half. That changed in July, and growth-oriented ETFs like RDVY rebounded. Understanding how your portfolio scores on these metrics can help you identify potential gaps and will help you build a portfolio of ETFs that will work well for the long term.
Thank you for taking the time to read this lengthy article. I learned a lot myself, and if you have any questions, I’d be happy to answer them in the comments section below.
Be the first to comment