

Kwarkot/iStock via Getty Images
I hope you can join me today for a relatively theoretical discussion of earnings by equity REITs. This was stimulated by two things.
First, there is clear evidence of ongoing cap rate compression in commercial properties. Second, in modeling some of my own REIT investments I noted that forward growth seemed quite dependent on assumed cap rates. This triggered my curiosity.
For context, the cap rate is the ratio of net operating income to property value. It can be viewed as the value of the discounted cash flows produced by the property.
If indeed we have a decade with episodic inflation and low interest rates, as Lyn Alden Schwartzer and others expect, then there will be a sustained interest in holding real property as an inflation hedge. We’ve already seen some cap rates in the 2s in the US and 1s in Europe. If you are buying at those levels, you are after preservation of principal, not earnings as such.
I’ve argued before that REIT investors can benefit strongly from inflationary appreciation of property values driven by increasing rents. But that is not quite what we have here.
Under 1970s-style inflation, accompanied by strong increases of interest rates, cap rates were relatively constant. In contrast, the compression of cap rates implies that property values are increasing faster than incomes are.
The implication of cap rate compression is that discount rates are decreasing. The compression means that the properties are more valuable, at least while it lasts.
But the impact on the value of a REIT also depends strongly on anticipated forward earnings growth, as we discuss further below. As a result, the important question becomes: how does cap-rate compression impact earnings growth?
Let’s see.
Growth of REIT Earnings
REITs need to raise capital to grow earnings, and can do so via several paths. Four that we will discuss here are raising rents, retaining earnings, issuing shares, and taking on debt.
All these enable new acquisitions that can increase earnings. The full story on acquisitions and dispositions is more complex, but today we will not get into those weeds. I did some of that in a recent article on STORE Capital (STOR).
The REITs then invest the capital they raise in buying properties. The Return On Equity of those investments is intended to produce an increase in cash earnings per share consistent with their business models.
Those cash earnings are best measured by an Adjusted Funds From Operations (“AFFO”) per share, about which more later. Unfortunately there is no standard definition of AFFO, adding to the challenges of understanding REIT earnings.
Note that such cash earnings have no useful relationship to GAAP EPS. GAAP numbers are pretty much worthless for REITs.
It is centrally important that REIT valuations reflect expectations regarding growth of AFFO per share. If an investor demands a 10% rate of total return, then the value of a steady, non-growing stream of cash flows is only 10x the annual value.
Yet many REITs today are priced above 20x AFFO and even much higher. For that 10% total return, 20x requires a 4.7% growth rate forever, or a larger growth rate if for a shorter time. Here is how the relationship looks on a graph:
RP Drake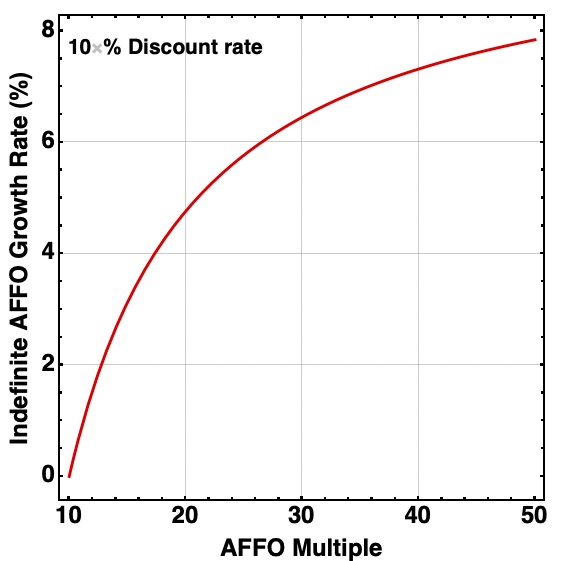
The relevant point here is that valuations depend mightily on sustainable, long-term rates of growth. It matters a lot to understand how these are impacted as cap rates change.
Of course, investors might also decrease their expected total returns, which would increase the implied value of REIT stocks. But color me skeptical on that. I suspect many of us would leave the sector before buying into anticipated total returns of say 5%.
What Determines Return On Equity
We are about to go into details on the process of earnings growth. This table of definitions may help those new to REITs make sense of them.
RP Drake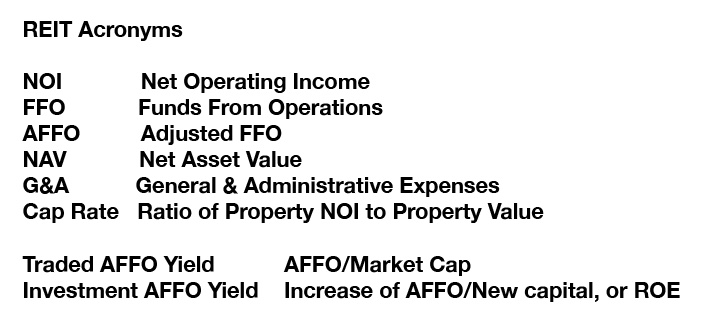
Unfortunately, several of these quantities have GAAP versions that may distort reality. We are seeking to understand cash flows here, and will try to be specific about needing cash numbers.
The Return On Equity produced by investing new capital (also called equity at times) is determined in a manner first formalized by Chris Volk in 1999. This is defined here as the ratio of AFFO to New Equity and called the Investment AFFO Yield, referred to below as the Investment Yield. Return On Equity is often abused by computers and GAAP, so we avoid it.
Here is the version of this we will analyze below. Bear with me while we discuss it. The next section presents the implications in colorful graphics.
Equation 1. You might want to grab a screen shot for reference as you read, or even later. (RP Drake)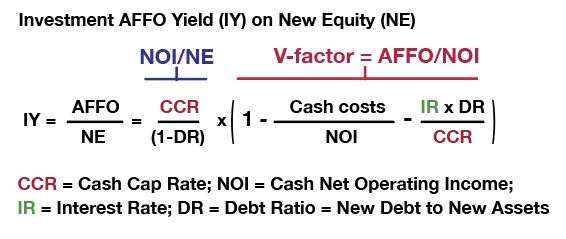
We will use the symbol “IY” for the Investment Yield. The right-hand side of this equation has two terms.
The first, below the blue label, is the ratio of NOI to New Equity, labeled “NE”. This first term is the ratio of the cash cap rate to one less the debt ratio. Comments on each of them are worthwhile.
The Cash Cap Rate, shown in red letters, is the ratio of Cash NOI to Property Value. To get cash NOI one has to take out non-cash GAAP earnings adjustments such as that for straight-line rent.
Sometimes these non-cash items are quite large. I discussed some examples here.
The Debt Ratio is straightforward, but not always easy to estimate on a forward basis. Because debt is subject to the episodic process of raising debt capital, one either needs to know the target of the REIT or to assess it in some other way. Using the ratio of debt to gross (undepreciated) assets on the balance sheet may be the best option.
The second term of the right-hand side, below the red label and within parentheses, is what I call the “V-factor”. It is the ratio of AFFO to (cash) NOI and has two terms subtracted from one.
The first term subtracted from one is the ratio of cash costs to (cash) NOI. These costs include General & Administrative costs, recurring capex, and perhaps other items. One can have lots of arguments about other costs that may or may not be excludable as “non-recurring,” but we will not go there today.
The second term subtracted from one is the ratio of interest expenses to (cash) NOI. For new investments, this is best evaluated as shown, as the ratio of the interest rate, shown in green letters, to the cash cap rate, multiplied times the Debt Ratio.
Significant for the discussion below is that the (red) cash cap rate and (green) interest rate are set by markets and are the independent variables in this equation. The REIT can choose its Debt Ratio and has some level of control of its costs.
Having recognized that cap rates and interest rates act independently, it is useful to rearrange the above equation in this way:
Equation 2. (RP Drake)
The math separates cleanly into two parts. Increasing cap rates increase the Investment Yield independent of interest rates. Increasing interest rates decrease it independent of cap rates.
Impact of Cap Rate Compression
We can show how the Investment Yield depends on both cap rates and interest rates using a color plot. This plot uses parameters typical of REITs that own free-standing properties leased by triple-net leases, abbreviated below as net-lease REITs. (Specifically Debt Ratio of 40% and Cash costs of 7.5% of NOI.)
RP Drake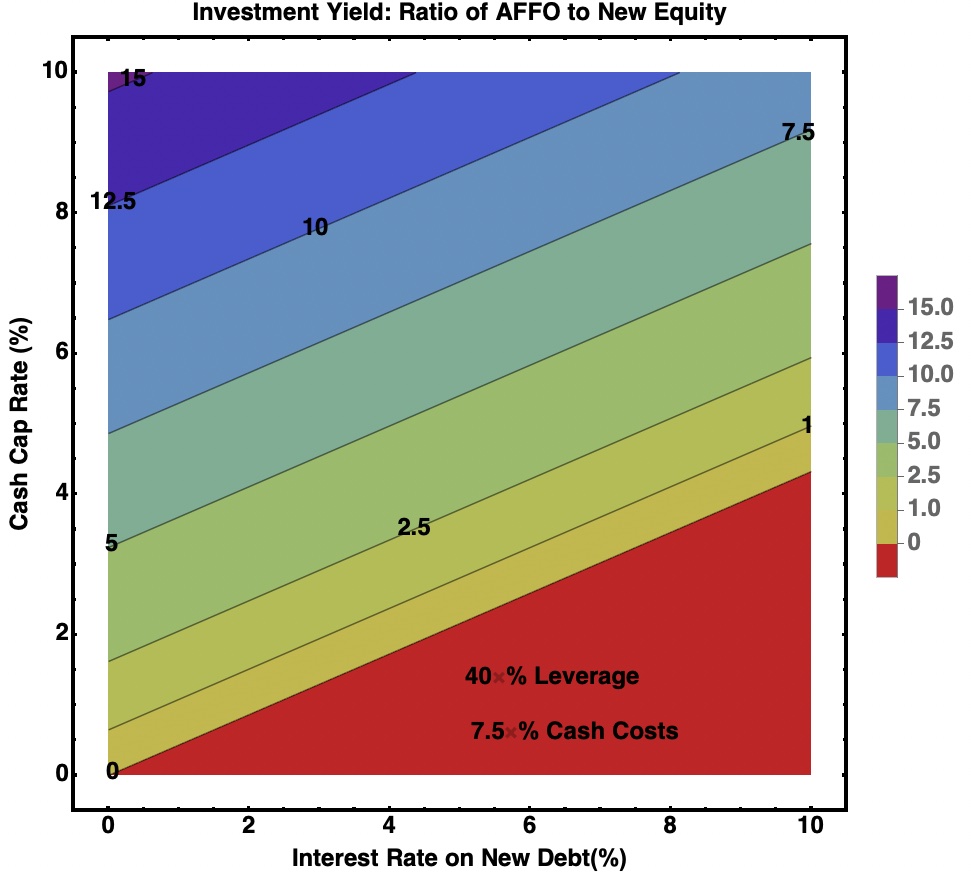
Here the lines correspond to constant Investment Yield, indicated as percentages by the labels. For example, the teal bar spans the range from a 5% to a 7.5% Investment Yield.
Note that the slope of the lines here is well below 45 degrees. What that tells us is that cap rates are far more important than interest rates in determining the Investment Yield.
What it takes to make the impact of interest rates comparable to that of cap rates is to have both very high costs (~40% of NOI) and very high Debt Ratio (~ 60%). There are at most a few pathological REITs for which the impact on growth of changes in interest rates exceeds that of changes in cap rates.
The interest rates for new debt for nearly all net-lease REITs are between 1.7% and 3.1%. Agree Realty (ADC), W.P. Carey (WPC), and Realty Income (O) are on the low end. Four Corners Property Trust (FCPT) and Essential Properties Realty Trust (EPRT) are on the high end.
It may be helpful to see some vertical slices through the above plot. Here are the Investment Yields for interest rates of 0%, 1.7%, and 3.1%.
RP Drake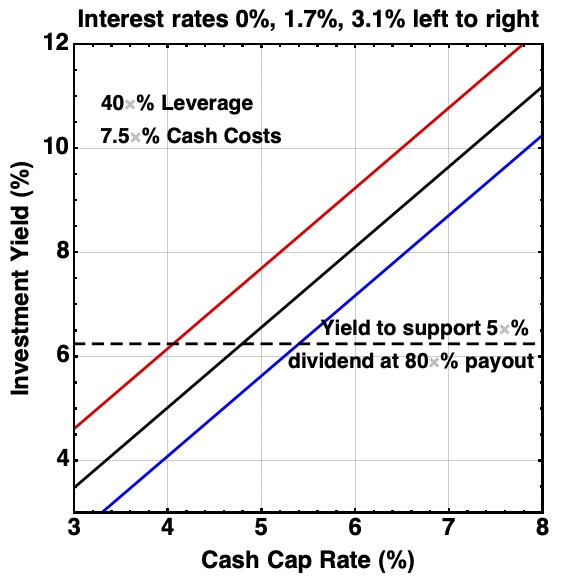
Also shown by the dashed horizontal line is the yield necessary to support a dividend of 5% of newly invested equity at an 80% payout ratio. This too is in the ballpark for net-lease REITs today.
What we see is that a compression of cap rates by 1% reduces the Investment Yield by nearly 2%. The ability of a REIT to raise equity by share issuance and cover its dividend from the resulting income is reduced rapidly as cap rates decrease.
The bottom line here is this: Cap rate compression hurts the ability of REITs to grow. For nearly all of them, this has much more impact than changes in interest rates.
Remember that the next time you see some random investor express their fear of what interest rates will do to REITs.
Effect of Compression on Growth Rates
What the Investment Yield tells us directly is how well the dividend would be covered if the new equity were raised by issuing shares. But we have more work to do to understand the growth of AFFO/share.
I previously showed here how to express, in algebraic form, a calculation that Chris Volk had shared with me. Here, with a more complete presentation of internal growth, is the result:
Equation 3. You might want to grab a screen shot for reference as you read, or even later. (RP Drake)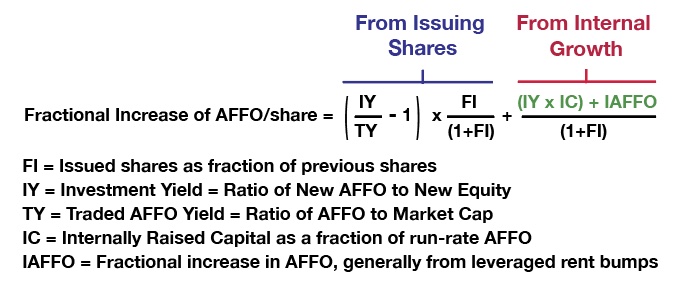
The usual statement is that when shares are priced above NAV, issuing new shares increases shareholder value. The problem with this is that NAV is subjective and not accurately known. The mathematical reality is that it is not NAV that matters, but rather the Traded Yield — the ratio of run-rate AFFO to Market Cap.
The internal growth (shown in green) has two parts. The first part is the result of investing internally raised capital, which produces AFFO in proportion to the Investment Yield.
This internally raised capital includes retained earnings. It may also include net proceeds from asset sales, depending on how one tracks that.
The second part is the growth of AFFO from rent increases. This is larger than it might seem since the rent growth increases EBITDA but does not increase interest expenses. In addition, it should be taken as leveraged from the perspective that one increases debt to maintain a chosen ratio of debt to assets.
There are three possible regimes of growth. In the first, one issues shares. In the second, this is not beneficial so one does not.
In the third, one does not invest the internally generated capital because the Investment Yield is negative (or otherwise considered too small). At current interest rates this third case does not apply and we will ignore it.
We can plot the growth rate as follows. We assume that rent increases produce a 3% increase in AFFO and that 20% of AFFO is retained and invested. We assume one will not issue stock when doing so produces no growth (or decreases growth). Here is the big-picture overview:
RP Drake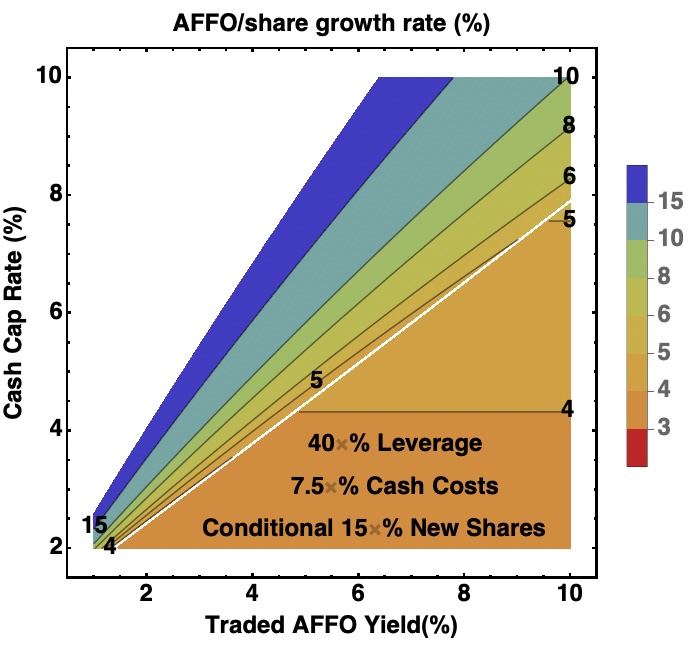
This plot is for the issuance of shares that raise equity equal to 15% of the current Market Cap, but only when this is advantageous. Within the lower right portion of the plot, issuing shares is not advantageous and the only growth is the internal growth.
The increase of growth rates as the cap rate increases above the threshold for share issuance is quite remarkable. Let’s look at a vertical slice at a Traded AFFO Yield of 6%, which is a midrange value for net-lease REITs today.
RP Drake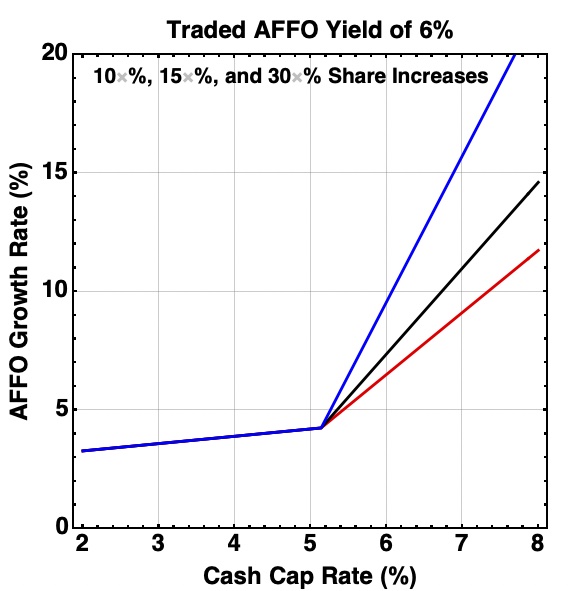
One sees a break point, above which the growth rate rapidly increases. The break point depends on the detailed parameters. I will address this in another article for specific net-lease REITs, and perhaps later for other sectors. Below the break point, the growth rate decreases slowly as cap rates compress.
Above the break point, the steepness of the increase with cap rate is remarkable. Even for a rate of share increase of 10% (the flattest, and red, curve), it only takes a 1% decrease in cap rate to drop the growth rate from 7% to about 4%.
We are seeing frequent reports, such as this one, that highly prized, investment-grade tenants are getting cap rates in the 5s now. These are perilously close to the level where issuing shares will no longer increase the growth rate of AFFO.
The conclusion has two parts. Cap rate compression reduces and may threaten the ability to grow AFFO by issuing shares. But it has much smaller effects on the growth rate that can be produced internally.
Perspective on Valuation
These results have altered somewhat my perspective on valuation of net-lease REITs. To speak to that, look again at the AFFO Multiple plot shown above:
RP Drake
Net-lease REITs have rarely traded above an AFFO multiple of 20. For an AFFO payout ratio of 80%, this corresponds to a dividend yield of 4%.
Such a multiple corresponds, for a 10% total return, to an AFFO growth rate just below 5%. One concludes that these REITs are rarely priced to include any expectation of growth from issuing new shares.
On the one hand, this is remarkable. Most such REITs have issued a lot of shares and boosted AFFO per share doing so. The exception is National Retail Properties (NNN), which issues few shares.
On the other hand, this may be sensible. The manic-depressive, irrational, and unpredictable market sets the Traded AFFO Yield, so you cannot count on it.
When events happen to boost AFFO at a rate above that achieved by internal growth, this resets the basis for future growth. The stock price should reset upward.
But if one does not count on this, then the stock valuation should be in the ballpark of 18x AFFO in all normal times. This will have variations depending on details of any specific net-lease REIT.
At the moment the net-lease sector is priced quite a bit lower than that. In my opinion, it is a good place to put new money. We hold several of such stocks in our portfolios at High Yield Landlord.
Be the first to comment