

juliannafunk/iStock via Getty Images
But these sales happened during the “Fed pivot” fantasy that pushed mortgage rates down to 5%. Now mortgage rates are near 6.5%.
In July and through mid-August, mortgage rates fell sharply from the 6%-range in mid-June, on the widely propagated fantasy of a Fed “pivot” on rate hikes. By mid-August, the average 30-year fixed mortgage rate was down to 5%. Yesterday, they were at 6.47%. But the brief interlude of dropping mortgage rates slowed down the decline in home sales – sales declined again in August from July but at a slower rate – with realtors in mid-August talking about the market waking back up.
But prices backed off for the second month in a row, and in a big way, amid widespread price reductions, and that also helped getting some deals done.
The median price of existing single-family houses, condos, and co-ops whose sales closed in August dropped a hefty 3.5% in August from July, the largest month-to-month percentage drop since January 2016, after the 2.4% drop in the prior month, to $389,500, according to the National Association of Realtors. While there is some seasonality involved, the percentage drop was much bigger than normal in August, whittling down the year-over-year price increase to 7.7%, down from the 25% year-over-year increases last summer (data via YCharts):
Median Sold Price Of Existing Homes ($) (Author)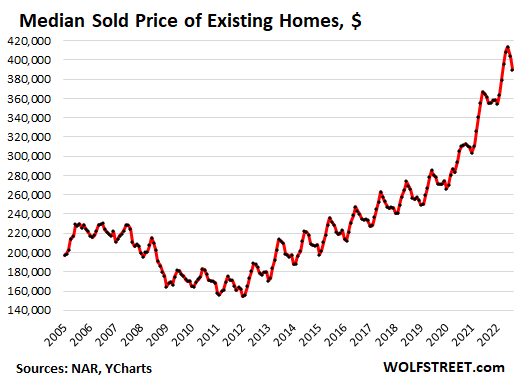
In the West, price drops are further advanced, amid dismal sales. For example, in San Francisco and in Silicon Valley, median prices have plunged in recent months – now down on a year-over-year basis in San Francisco and Santa Clara County (San Jose) and up just a hair in San Mateo County, according to data from the California Association of Realtors.
Sales of existing houses, condos, and co-ops across the US dipped a smidgen from July, after the 5.9% plunge in the prior month, to a seasonally adjusted annual rate of sales of 4.80 million homes, roughly level with lockdown June 2020, according to the National Association of Realtors in its report. This was the seventh month in a row of month-to-month declines.
Beyond the lockdown months, it was the lowest sales rate since 2014, and down by 29% from October 2020 (historical data via YCharts):
Existing Home Sales, Seasonally Adjusted Annual Rate (In Millions) (Author)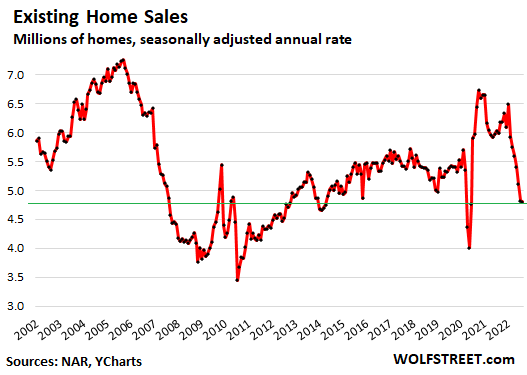
Sales of single-family houses dropped by 0.9% in August from July, and by 19% year-over-year, to a seasonally adjusted annual rate of 4.28 million houses.
Sales of condos and co-ops rose 4% from July, to a 520,000 seasonally adjusted annual rate, down 25% year-over-year.
Compared to August last year, sales fell by 20%, the 13th month in a row of year-over-year declines, based on the seasonally adjusted annual rate of sales (historical data via YCharts):
Existing Home Sales, Seasonally Adjusted Annual Rate (% Change From Year Ago) (Author)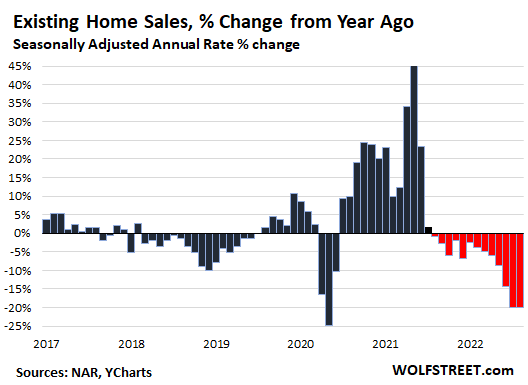
Sales by region: On a year-over-year basis, sales dropped sharply in all regions. On a month-over-month (MoM) basis, you can see a little uptick in two of the four regions.
- Northeast: +1.6% mom; -13.7% yoy.
- Midwest: -3.3% mom; -15.9% yoy.
- South: 0% mom; -19.3% yoy.
- West: +1.1% mom; -29.0% yoy.
Sales dropped in all price ranges but dropped the most at the low end.
% Change In Sales In August From Year Ago By Price Range (Author)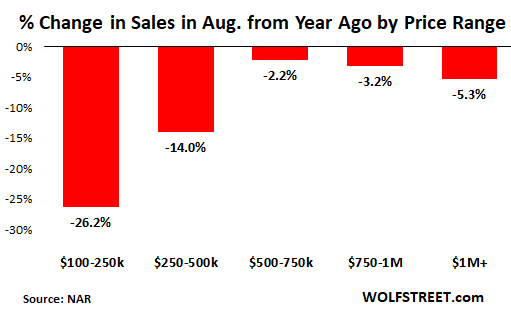
Sales volume has been low because potential sellers are clinging to their aspirational prices of yesteryear, when mortgage rates were 3%, and many would rather keep the home off the market or pull it off the market than sell for less, for as long as they can. But price reductions have now taken off by sellers who want to sell.
Price reductions started spiking in May from record low levels last winter and spring as sales stalled and as mortgage rates surged. In July, they reached the highest level since 2019, according to data from Realtor.com. In August, price reductions dipped just a little as sellers might have felt that price reductions were less needed, amid the declining-mortgage-rate-Fed-pivot fantasy in July and August:
Number Of Price Reductions (Since 2016) (Author)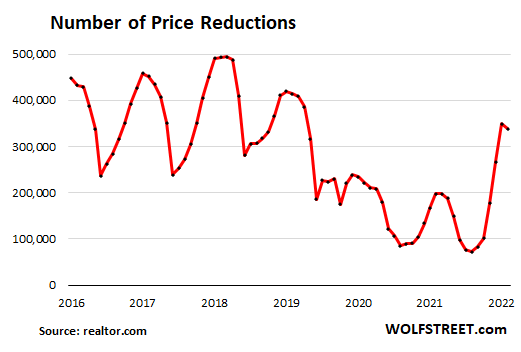
Active listings – total inventory for sale minus the properties with pending sales – rose to 779,400 homes in August, the highest since October 2020, up by 27% from a year ago, according to data from Realtor.com:
Active Listings (Since 2016) (Author)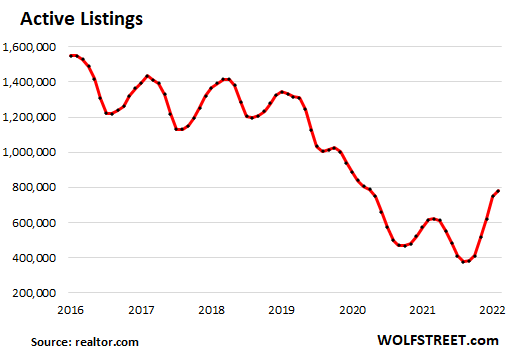
The National Association of Realtors is clamoring for more single-family houses to be built. But homebuilders, they are having trouble selling the houses that they have already built or are building, sales have plunged, inventories have spiked to the highest since 2008, and homebuilders have started cutting prices, buying down mortgage rates, and piling on other incentives to get their inventory moving.
Investors or second home buyers purchased 16% of the homes in August, up from 14% in July, but down from the 17%-22% range in the spring and winter, according to NAR data.
“All-cash” buyers, which include many investors and second home buyers, remained at 24% of total sales, down from a share of 25% to 26% April through June.
Going forward: holy-moly mortgage rates. After the fantasy-drop from 6% in mid-June to 5% by mid-August, mortgage rates are now solidly over 6%.
The daily measure of the average 30-year-fixed mortgage rate is at 6.47%, according to Mortgage News Daily.
According to Freddie Mac’s weekly measure released last week, based on mortgage rates early last week, rose to 6.02%, more than double a year ago. These 6%-plus mortgage rates are still very low, considering that CPI inflation is over 8%. But they’re catching up.
And potential sellers that hung on to their homes in July and August because they didn’t want to meet the price where the buyers were – hoping the “pivot” fantasy would push down mortgage rates further – now face the effects of these 6%-plus mortgage rates:
30-Year Fixed Mortgage Rate (% Weekly Average, Freddie Mac) (Author)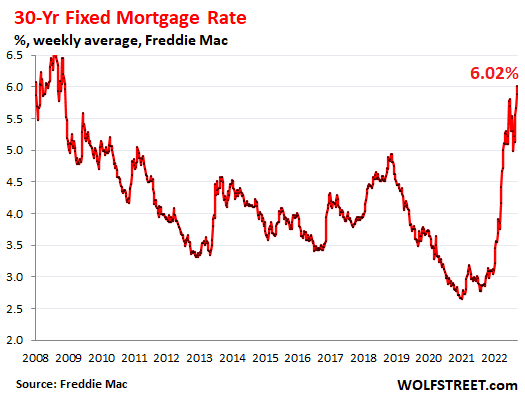
Editor’s Note: The summary bullets for this article were chosen by Seeking Alpha editors.
Be the first to comment