

Khanchit Khirisutchalual
Article Thesis
The CPI report on Thursday came in a lot higher than expected. It included some ugly data points that we’ll get into in this article. This will make a Fed pivot pretty unlikely. Instead, central bankers will likely continue to increase rates in order to reign in stubbornly high inflation rates. This, in turn, continues to punish the market, especially when it comes to long-duration assets. Where can investors hide in a high-inflation world?
What Happened
On Thursday morning, the latest CPI reading, for September 2022, was released. The following image shows some of the most important data points:
Seeking Alpha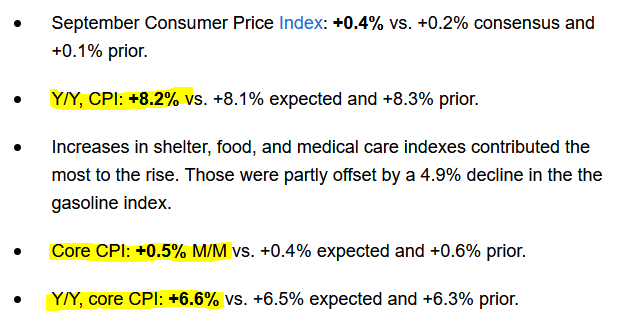
The month-over-month increase was higher than expected in both the headline CPI metric as well as in the core CPI metric, where volatile elements such as energy and food are excluded. Year-over-year inflation also came in above expectations on both the headline number as well as the core number.
Not surprisingly, the market reacted very negatively to this hotter-than-expected inflation report, sending equities lower:
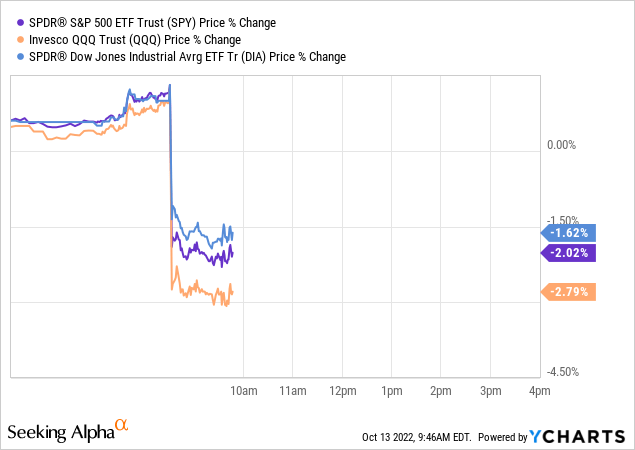
The broad market (SPY) dropped by 2%, while the tech-heavy Nasdaq index (QQQ) dropped by almost three percent following this news. The larger drop in the Nasdaq can be explained that its tech focus means that the index includes many highly valued companies where a large portion of future expected cash flows will not be generated in the near term. These long-duration assets are more exposed to an increase in interest rates (and thus discount rates), making QQQ more vulnerable to ongoing interest rate increases relative to the broad market and the Dow Jones (DIA).
The CPI Report Includes Some Ugly Numbers
Apart from the hot headline data, the most recent CPI report also includes some other very noteworthy items. The most important one, I believe, is the very high core CPI reading. At close to 7%, core CPI came in at the highest level over the last 40 years. The 0.5% month-to-month increase also suggests that the problem isn’t easing. Since energy and food costs are excluded from the core CPI number, this very elevated reading can’t be blamed on tight oil markets, the ongoing energy crisis, or the fallout from the ongoing Russia-Ukraine war. That war primarily impacts energy markets and food markets, but since inflation excluding those two items is running at a 40-year high, problems go way beyond the ongoing war.
What causes core CPI to be so stubbornly high, and actually increase, when energy and food costs can’t be the deciding factor? First, costs for shelter continue to accelerate. Shelter costs are primarily measured via the owners’ equivalent rent metric, where homeowners are asked about what they think they could rent out their homes for. That’s a relatively lagging measure, which is why the shelter portion of CPI increases remained somewhat subdued for a prolonged period of time, even though the housing market had been soaring over the last two years.
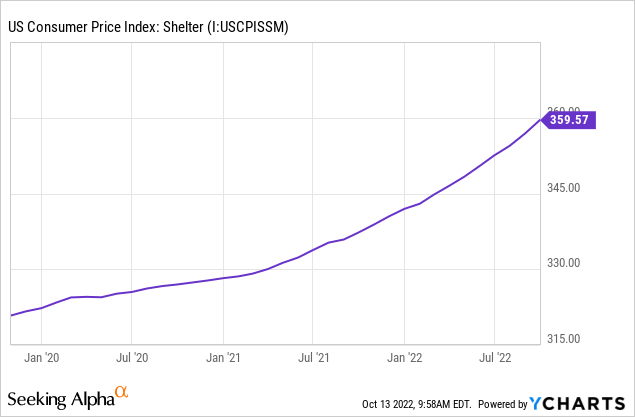
While shelter costs, as measured by the CPI, had risen slowly in 2020 and early 2021, shelter cost increases started to accelerate in H2 of 2021, which can be seen in the above chart due to the slope becoming steeper at this point.
That trend continued in 2022, as price increases have become sharper and sharper. The shelter index rose by 0.7% in September on a month-over-month basis, which comes out to well above 8% annualized. From a shelter perspective, core CPI could thus accelerate further from the current reading of 6.6%.
Medical care also got way more expensive, rising by 0.8% in September on a month-over-month basis, or close to 10% annualized. That can’t be explained by the ongoing energy crunch or the war in Ukraine, thus other factors are at play. Rising employment expenses for doctors, nurses, and so on play a huge role, and due to the ongoing skilled labor shortage, that trend could remain in place. Medical care isn’t a fast-moving, volatile part of the CPI, thus high readings make it likely that readings in the foreseeable future will be elevated as well.
There were some positives in the report as well, such as used car prices declining on a month-over-month basis. This is likely the result of the ongoing economic slowdown that makes consumers more reluctant to pay a lot of money for vehicles, as some of them decide to keep their existing vehicles for a little longer during this downturn. Apparel prices fell as well, which can likely be explained by the same reasons – consumers become warier when it comes to spending on discretionary items as they feel their buying power erode due to exploding shelter, food, energy, etc. costs. But since neither apparel nor vehicles make up an overly large portion of average consumers’ spending, easing pressure in these areas can’t bring down overall CPI by a lot, which is why inflation remains well above the targeted 2% range – and it’s likely that inflation readings in the coming months will remain elevated as well.
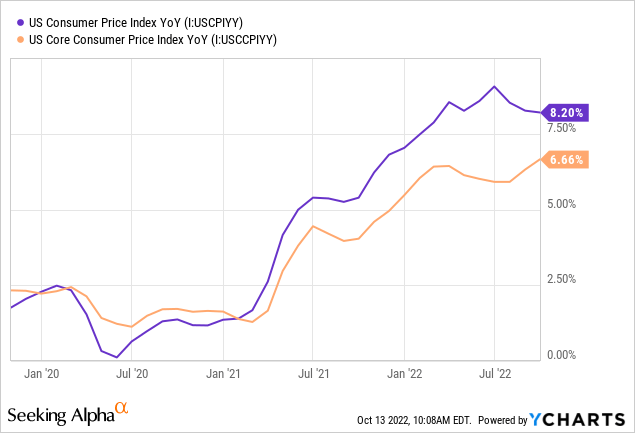
The above chart suggests that the Fed has a lot of work to do before inflation is back at the desired level: CPI has taken hold at the 8%-plus level and remained there for quite some time, while core CPI is still rising, potentially breaching 7% in the foreseeable future, e.g. due to the rising cost for shelter, as explained above.
Fed Pivot Becomes Even Less Likely
I had thought that a Fed pivot is rather unlikely even before Thursday’s CPI reading, but now it has become even less likely. Stubbornly high headline CPI, and, potentially even worse, cycle-high core CPI will force the Fed to continue to hike rates aggressively in order to eventually bring down inflation to desired levels.
Following the release of September’s data, the market is now pricing in an almost 100% chance of a 75 base point hike in November and a more than 60% chance of another 75 base point increase in December. In other words, the current baseline expectation is that the Fed will increase rates by another 150 base points this year, even though the year is close to being over. That will naturally lead to increases in interest rates down the road, e.g. for mortgages and treasuries – 10-year treasuries are now trading with a yield of more than 4%, not seen in a long time.
Rising interest rates also pressure stocks, all else equal, due to several reasons. First, indebted companies become less profitable as they have to spend more on interest expenses. Second, fixed-income alternatives become more attractive as rates rise, which makes some (income) investors move from equities to bonds, for example. Third, margin debt becomes more expensive, making some investors reduce their portfolio size when they had been using margin in the past. And last but not least, the increase in interest rates results in higher discount rates when using the discounted cash flow valuation method, which is why the calculated “fair” valuation for individual stocks and the market as a whole declines, all else equal. The last factor has a particularly large impact on not-yet-profitable stocks where a lot of future growth is priced in. It’s not surprising to see ARK Innovation (ARKK), which holds a large portion of these stocks, underperform the broad market, while individual expensive long-duration stocks such as Amazon (AMZN) or Tesla (TSLA) are also dropping more than the market.
Where Can Investors Hide?
Yields on bonds have been rising, potentially making them more attractive as income investments. On the other hand, their real yields are still deeply negative, and bond prices have been crashing, a trend that could continue as the Fed will likely continue to hike rates.
Looking at the 1970s for investment clues could make sense, as that was a period of time when inflation was elevated for years as well. In that time frame, most stocks and bonds did not generate positive real returns. There were two noteworthy outliers, however: Energy (XLE) and REITs (VNQ). Their “real asset” nature provides above-average inflation protection, which is why oil and gas stocks and REITs delivered positive real returns during the 1970s, unlike the broad market. They’re not 100% immune to the current environment, as rising interest rates could lead to higher interest expenses for REITs down the road, once they have to refinance existing debt. But REITs have relatively clean balance sheets right now, on average, and the higher-quality ones managed to lock in interest rates for many years, reducing near-term exposure to rising interest rates. Valuations in the energy and REIT space have come down in 2022 and are undemanding in many cases, which is why I believe that there are attractive opportunities here. I particularly like triple-net leased REITs such as Realty Income (O) and Canadian oil sands names such as Canadian Natural Resources (CNQ), although there are many other attractive investment opportunities in the energy and REIT universes on top of these.
Takeaway
Those that had hoped for inflation to be a short-term problem continue to be proven wrong. Inflation remains high, and the trend especially in core CPI readings is far from great. Slow-moving items such as shelter inflation will likely continue to put upwards pressure on CPI, which is why inflation will likely not drop much in the near term.
That will cause further interest rate increases, putting pressure on equities, especially unprofitable, expensive long-duration stocks such as former market darling Tesla. Investors may want to look for exposure to energy and real estate, as those assets have outperformed the market in the 1970s when inflation was running at a very elevated rate for a prolonged period of time. History doesn’t repeat, but it rhymes, after all.
Be the first to comment