

JHVEPhoto/iStock Editorial via Getty Images
By The Valuentum Team
Honeywell (NASDAQ:HON) pays a strong and competitive dividend, with a yield that makes its Dividend Cushion ratio (2.1), as explained in the images below, a tough one to pass up. Management continues to target high ROI capital spending as it pursues key process initiatives and productivity improvements, a healthy combination for ongoing segment margin expansion. We’re huge fans of its commercial original equipment and aftermarket business in light of the massive backlogs at the airframe makers, and there’s not much that looks poised to derail Honeywell’s dividend strength, at least in the near term. The executive team’s ‘growth through acquisitions’ has served the company well during this economic cycle, and it plans to grow the dividend at a rate above that of earnings per share. We like Honeywell as a dividend growth idea to gain exposure to the recovering aerospace industry and exposure to the nascent quantum computing industry. Shares of HON yield ~2.2% as of this writing.
The Dividend Cushion ratio is a helpful ratio to assess the dividend growth potential of the company. (Image Source: Valuentum)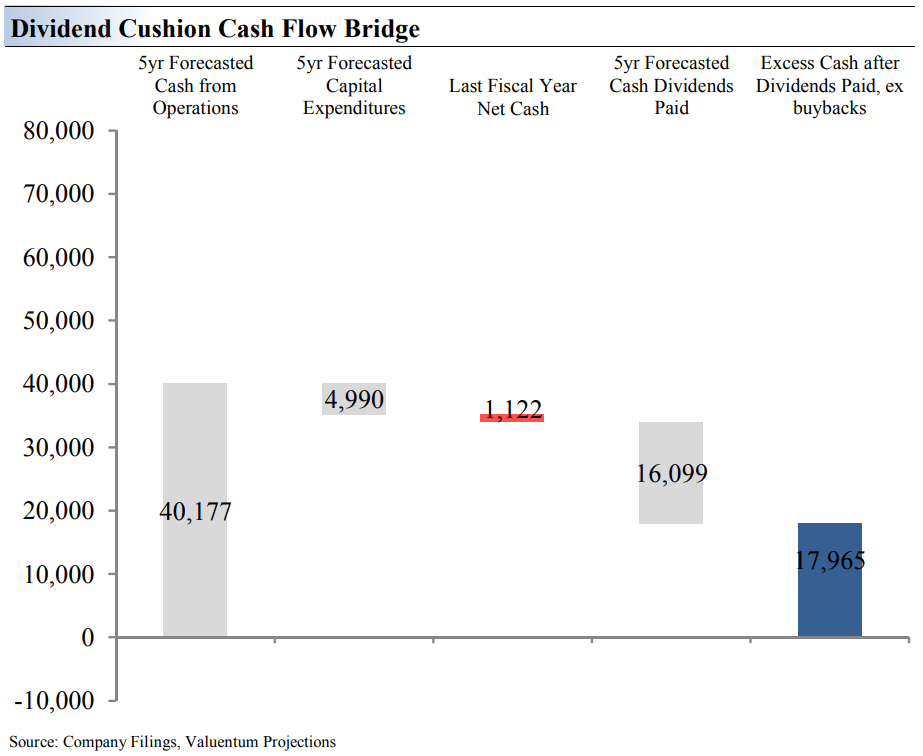
The Dividend Cushion Cash Flow Bridge, shown in the image above, illustrates the components of the Dividend Cushion ratio and highlights in detail the many drivers behind it. Honeywell’s Dividend Cushion Cash Flow Bridge reveals that the sum of the company’s 5-year cumulative free cash flow generation, as measured by cash flow from operations less all capital spending, plus its net cash/debt position on the balance sheet, as of the last fiscal year, is greater than the sum of the next 5 years of expected cash dividends paid. Because the Dividend Cushion ratio is forward-looking and captures the trajectory of the company’s free cash flow generation and dividend growth, it reveals whether there will be a cash surplus or a cash shortfall at the end of the 5-year period, taking into consideration the leverage on the balance sheet, a key source of risk.
On a fundamental basis, we believe companies that have a strong net cash position on the balance sheet and are generating a significant amount of free cash flow are better able to pay and grow their dividend over time. Firms that are buried under a mountain of debt and do not sufficiently cover their dividend with free cash flow are more at risk of a dividend cut or a suspension of growth, all else equal, in our opinion. Generally speaking, the greater the ‘blue bar’ to the right is in the positive, the more durable a company’s dividend, and the greater the ‘blue bar’ to the right is in the negative, the less durable a company’s dividend.
Image Source: With the Dividend Cushion ratio, a number significantly above one, where the numerator is greater than the denominator, indicates dividend strength. (Image Source: Valuentum)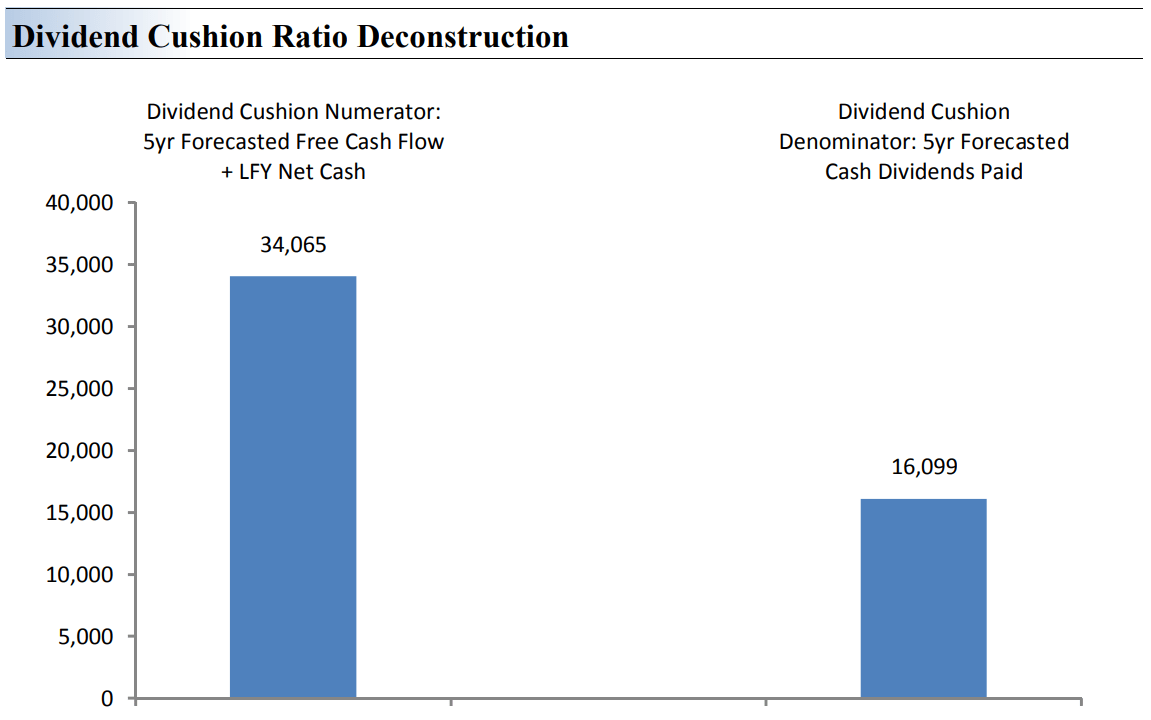
The Dividend Cushion Ratio Deconstruction, shown in the image above, reveals the numerator and denominator of the Dividend Cushion ratio. At the core, the larger the numerator, or the healthier a company’s balance sheet and future free cash flow generation, relative to the denominator, or a company’s cash dividend obligations, the more durable the dividend. In the context of the Dividend Cushion ratio, Honeywell’s numerator is larger than its denominator suggesting strong dividend coverage in the future. The Dividend Cushion Ratio Deconstruction image puts sources of free cash in the context of financial obligations next to expected cash dividend payments over the next 5 years on a side-by-side comparison. Because the Dividend Cushion ratio and many of its components are forward-looking, our dividend evaluation may change upon subsequent updates as future forecasts are altered to reflect new information.
Honeywell’s Key Investment Considerations
Image Source: Valuentum. The key investment considerations we look at with respect to Honeywell. (Image Source: Valuentum)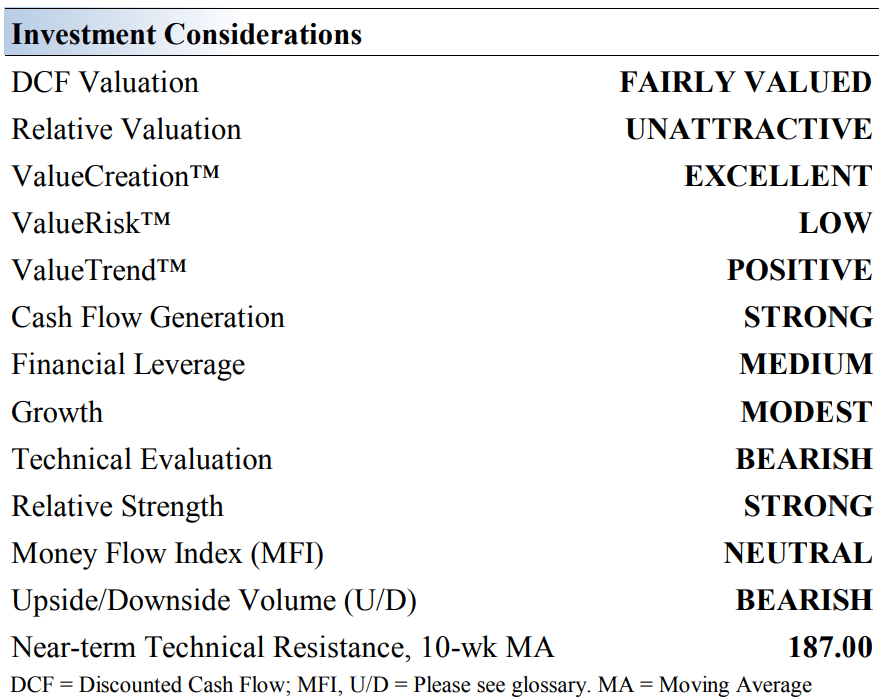
Honeywell operates in four segments: Aerospace, Building Technologies, Performance Materials and Technologies, and Safety and Productivity Solutions. Its aerospace products are used on virtually every aircraft, and its personal protection equipment has been in huge demand due to COVID-19. The firm was founded in 1920 and is based in New Jersey.
Honeywell generates nice normalized margins. Its ‘Performance Materials and Technology’ segment boasts its highest profit margins in the low- to mid 20% range, followed by its ‘Aerospace’ segment in the low 20% range. It is working to optimize fixed costs in its manufacturing and logistics facilities.
Long term, Honeywell expects strength across is major end markets including commercial aviation, defense, and process automation, which will be driven by flight hours growth, robust defense budgets, and warehouse building. The COVID-19 pandemic will pose challenges, but we like this industrial powerhouse.
Honeywell’s long-term financial targets include 3%- 5% annual organic sales growth, 30-50 basis points of margin expansion per year, EPS growth greater than peers, a cash conversion rate greater than 100%, and the maintenance of investment grade credit ratings. Management is also targeting dividend growth in-line with earnings growth.
In addition to its highly-respected brand name, the company’s massive installed base and large services business offer considerable competitive advantages. Its recurring software sales have also been growing at a nice double-digit clip.
Latest Earnings Analysis of Honeywell
On April 29, Honeywell International reported first-quarter 2022 earnings that beat both consensus top- and bottom-line estimates as its business continues to rebound from the worst of the coronavirus (‘COVID-19’) pandemic. Due to its strong performance, management raised the company’s full-year sales and earnings guidance for 2022 in conjunction with its latest earnings update.
In the first quarter, Honeywell’s GAAP revenues declined 1% year-over-year due to a slowdown in COVID-19 mask purchases and the Ukraine-Russia crisis, as the firm suspended its business in Belarus and Russia in March 2022. Excluding those headwinds, Honeywell reported that its non-GAAP organic revenues advanced 1% year-over-year last quarter as its aftermarket aerospace sales rebounded robustly.
Its air transport aftermarket and business and general aviation aftermarket sales rose 25% year-over-year while its commercial original equipment sales also grew double-digits last quarter, though defense-related sales slowed. Overall, revenues at its ‘Aerospace’ segment increased 5% year-over-year on an organic basis last quarter (which was its largest in terms of sales and segment-level profit last quarter).
Strong demand for building management systems and fire products helped drive organic sales at its ‘Honeywell Building Technologies’ segment, up 8% year-over-year last quarter, while organic sales at its ‘Performance Materials and Technologies’ segment increased 6% year-over-year due to strength at its advanced materials, thermal solutions, and lifecycle solutions offerings.
However, organic sales at its ‘Safety and Productivity Solutions’ segment dropped 15% year-over-year last quarter due to a reduction in COVID-19 mask demand and reduced warehouse automation volumes (removing the impact of reduced COVID-19 mask sales saw its organic sales at this segment drop 6% year-over-year last quarter). On the plus side, the company’s Safety and Productivity Solutions segment benefited from strong demand for gas detection offerings, productivity services and solutions, and advanced sensing technologies last quarter.
Although portions of Honeywell’s business are facing sizable headwinds, overall demand remains strong for its expansive slate of offerings. Its GAAP gross margins rose ~20 basis points year-over-year, aided by its pricing power, though its GAAP operating margin (defined as GAAP gross profit less SG&A expenses divided by GAAP revenues) declined by ~225 basis points due to a meaningful increase in its SG&A expenses.
The firm notes that its segment-level profit margin increased at its Honeywell Building Technologies, Performance Materials and Technologies, and Safety and Productivity Solutions segments year-over-year last quarter due primarily to favorable product mix shifts and pricing increases. However, its segment-level profit margin declined at its Aerospace segment year-over-year last quarter due to inflationary pressures, an unfavorable product mix, and the removal of a one-time gain seen in the same period last year, though its pricing power helped offset these headwinds, to a degree.
Honeywell is not immune to inflationary pressures and supply chain hurdles, though it has done a solid job navigating those headwinds as best it reasonably could under the circumstances. Its GAAP diluted EPS came in at $1.64 last quarter, down from $2.03 in the same period last year as its operating margin contended with meaningful headwinds, though that was offset somewhat by a 2% year-over-year reduction in its outstanding diluted share count.
The company had $9.8 billion in cash, cash equivalents, and current investments on hand at the end of March 2022 versus $6.7 billion in short-term debt and $12.6 billion in long-term debt, providing it with ample liquidity to ride out the storm going forward. Its cash flow performance contended with a large working capital build last quarter, though management reiterated the firm’s full-year guidance that calls for Honeywell to generate substantial free cash flows this year.
Honeywell Quantinuum Looks Interesting
In November 2021, Honeywell announced that Honeywell Quantum Solutions and Cambridge Quantum, two leaders in quantum computing technology, had received regulatory approval to merge. Last year, Honeywell contributed $270 million towards Quantinuum, the new firm, to provide it with ample working capital to fund its impressive growth story. Honeywell owns ~54% of Quantinuum.
According to Honeywell, Quantinuum is targeting what could be a $1 trillion industry in the coming decades. Quantum computing could create whole new opportunities in the realm of cybersecurity (a booming industry in the face of rising malevolent cyber actors around the world), drug discovery and delivery (data from clinical trials that are currently being overlooked could unlock new advances in this arena), material science (discovering new advanced materials without having to first physically create those materials), finance (with an eye towards identifying complex risks in financial products), quantum natural language processing, optimization as it concerns supply chains and logistic operations (something that is incredibly useful in the global economy), and artificial intelligence (which has applications in virtually every aspect of the economy).
The first product launched by Quantinuum was a cybersecurity offering, Quantum Origin, which was released in December 2021. We are intrigued by the upside. Honeywell includes this asset in its ‘Corporate and All Other’ business segment given the nascent nature of the technology.
Honeywell’s Economic Profit Analysis
The best measure of a company’s ability to create value for shareholders is expressed by comparing its return on invested capital with its weighted average cost of capital. The gap or difference between ROIC and WACC is called the firm’s economic profit spread. Honeywell’s 3-year historical return on invested capital (without goodwill) is 49.2%, which is above the estimate of its cost of capital of 8.3%.
As such, we assign the Honeywell a ValueCreation rating of EXCELLENT. In the chart below, we show the probable path of ROIC in the years ahead based on the estimated volatility of key drivers behind the measure. The solid grey line reflects the most likely outcome, in our opinion, and represents the scenario that results in our fair value estimate. We expect steady economic-value creation for Honeywell in coming periods.
Image Source: We expect Honeywell to remain a strong economic-value generator. (Image Source: Valuentum)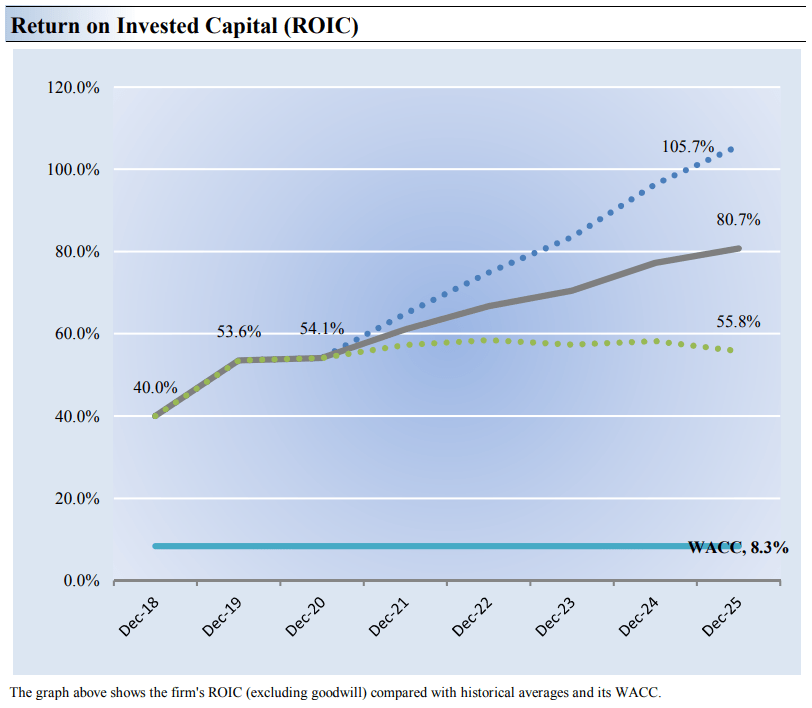
Honeywell’s Cash Flow Valuation Analysis
Image Source: Valuentum. We expect Honeywell to remain a strong free cash flow generator. (Image Source: Valuentum)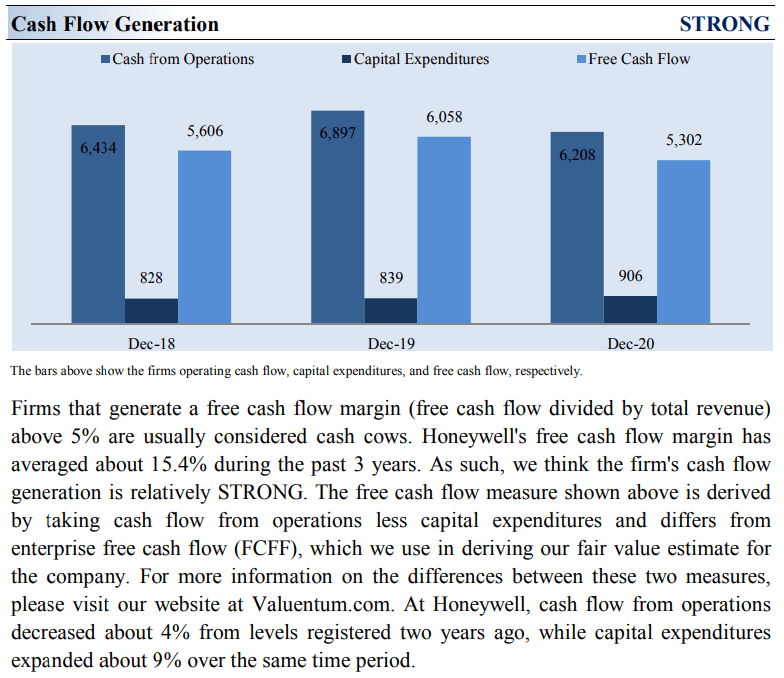
Honeywell raised its full-year guidance for 2022 during its first quarter earnings report. The firm increased its forecasted sales to $35.5-$36.4 billion (versus $34.4-$36.4 billion previously), which saw the midpoint rise marginally, and it increased its adjusted EPS forecast up to $8.50-$8.80 (versus $8.40-$8.70 previously), which saw the midpoint rise modestly. Honeywell also reaffirmed its $4.7-$5.1 billion in free cash flow guidance this year (or $4.9-$5.3 billion when excluding the impact of a recent business combination), which we appreciate.
We think Honeywell is worth $194 per share with a fair value range of $155- $233. The margin of safety around our fair value estimate is driven by the firm’s LOW ValueRisk rating, which is derived from an evaluation of the historical volatility of key valuation drivers and a future assessment of them. Our near-term operating forecasts, including revenue and earnings, do not differ much from consensus estimates or management guidance.
Our valuation model reflects a compound annual revenue growth rate of 5.5% during the next five years, a pace that is higher than the firm’s 3- year historical compound annual growth rate of -7%. Our model reflects a 5-year projected average operating margin of 23%, which is above Honeywell’s trailing 3-year average. Beyond year 5, we assume free cash flow will grow at an annual rate of 3.1% for the next 15 years and 3% in perpetuity. For Honeywell, we use a 8.3% weighted average cost of capital to discount future free cash flows.
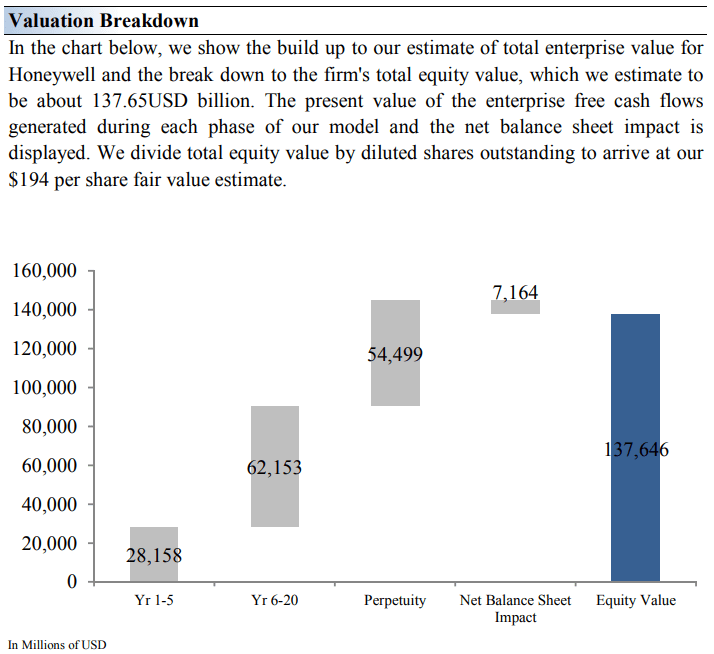
Image Source: Valuentum. The key valuation assumptions we use in our discounted cash flow model for Honeywell. (Image Source: Valuentum) Image Source: Valuentum. The duration of value composition on the basis of our discounted cash flow model for Honeywell. (Image Source: Valuentum)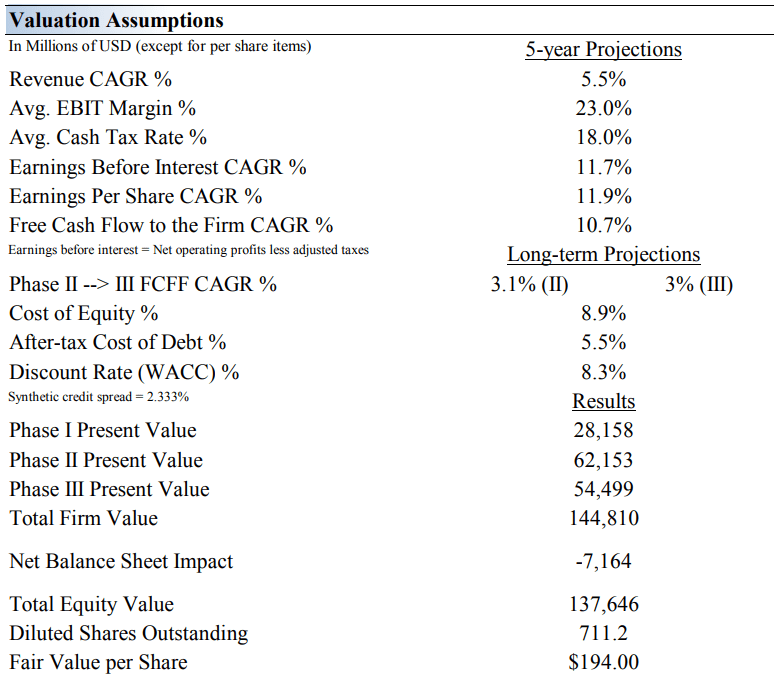
Honeywell’s Margin of Safety Analysis
Image Source: Valuentum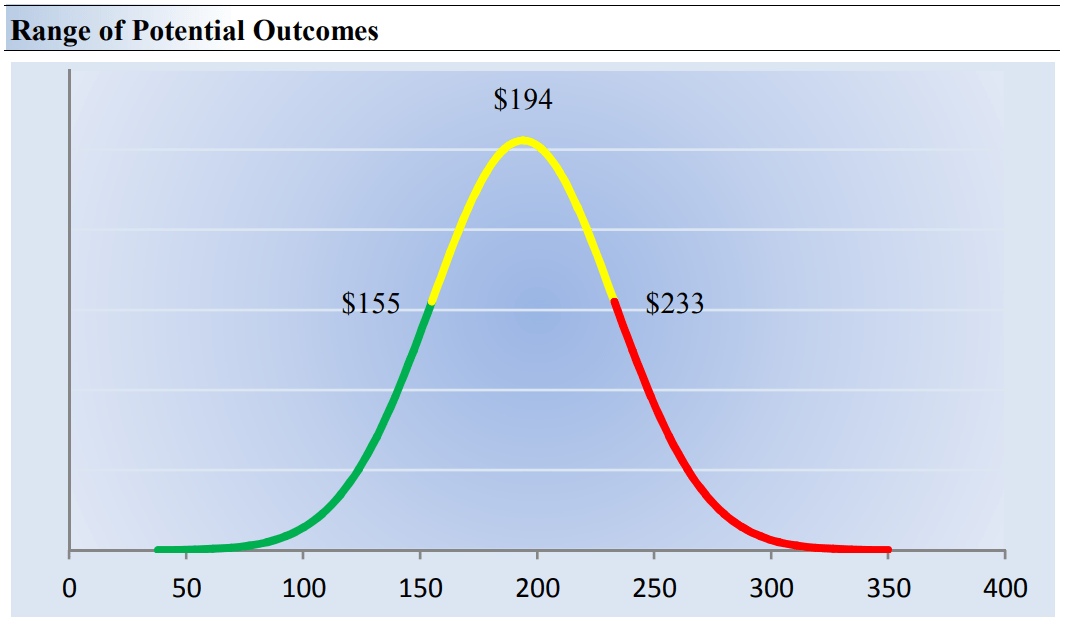
Our discounted cash flow process values each firm on the basis of the present value of all future free cash flows. Although we estimate Honeywell’s fair value at about $194 per share, every company has a range of probable fair values that’s created by the uncertainty of key valuation drivers (like future revenue or earnings, for example). After all, if the future were known with certainty, we wouldn’t see much volatility in the markets as stocks would trade precisely at their known fair values.
This is an important way to view the markets as an iterative function of future expectations. As future expectations change, so should the company’s value and its stock price. Stock prices are not a function of fixed historical data but rather act in such a way to capture future expectations within the enterprise valuation construct. This is a key part of our book Value Trap: Theory of Universal Valuation.
Our ValueRisk rating sets the margin of safety or the fair value range we assign to each stock. In the graph above, we show this probable range of fair values for Honeywell. We think the firm is attractive below $155 per share (the green line), but quite expensive above $233 per share (the red line). The prices that fall along the yellow line, which includes our fair value estimate, represent a reasonable valuation for the firm, in our opinion.
Concluding Thoughts
The first thing that comes to mind with respect to Honeywell’s dividend resiliency is the threat that comes with serving cyclical end markets. Though the company is well-diversified across the industrial economy and commercial aerospace may be in a prolonged upswing, a downturn is inevitable. Most of its businesses look to handle the COVID-19 pandemic well, and the firm’s near-term prospects following its recent portfolio transformation are encouraging.
Foreign exchange headwinds may slow the pace of revenue expansion, but free cash flow generation remains robust. There have been a number of moving parts in Honeywell’s portfolio of late, but the dividend remains a priority in management’s capital deployment strategy, in our view. We like shares quite a bit, love its healthy 2.1 Dividend Cushion ratio, and they offer investors a ~2.2% dividend yield.
This article or report and any links within are for information purposes only and should not be considered a solicitation to buy or sell any security. Valuentum is not responsible for any errors or omissions or for results obtained from the use of this article and accepts no liability for how readers may choose to utilize the content. Assumptions, opinions, and estimates are based on our judgment as of the date of the article and are subject to change without notice.
Be the first to comment