

Robert Way
Honeywell (NASDAQ:HON) reports Q3 results on October 27th and the shares are currently trading near the 12-month low. The shares have returned a total of -16.2% and -19.2% over the YTD and the past 12 months, respectively, as compared to -18.5% and -14.4% for the Dow Jones Industrial Average (DIA) and -23.3% and -16.5% for the S&P 500 (SPY) over the same periods.
12-Month price history and basic statistics for HON (Source: Seeking Alpha)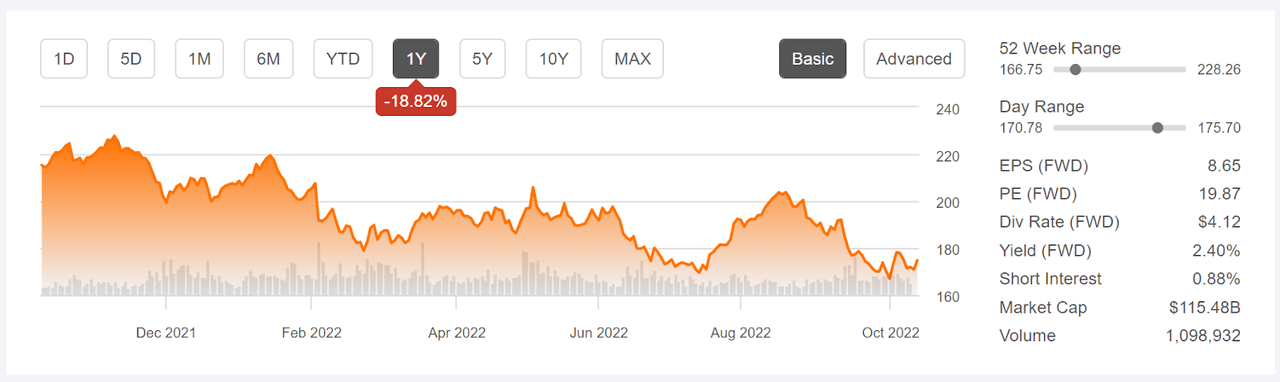
Honeywell’s main problem is that it has not managed to grow earnings over recent years, including compared to the pre-COVID results. The 2022 Q1 and Q2 EPS are almost identical to the 2019 Q1 and Q2 EPS, for example. Management is focusing on efforts to grow higher-margin business lines and to expand into areas with strong long-term growth prospects (e-commerce, health and wellness, and clean energy). The company must balance efforts to respond to near-term “cyclical headwinds” while investing in these higher-growth spaces.
Historical (4 years) and estimated future quarterly EPS for HON. Green values are amounts by which the quarterly EPS beat the consensus expected value (Source: ETrade)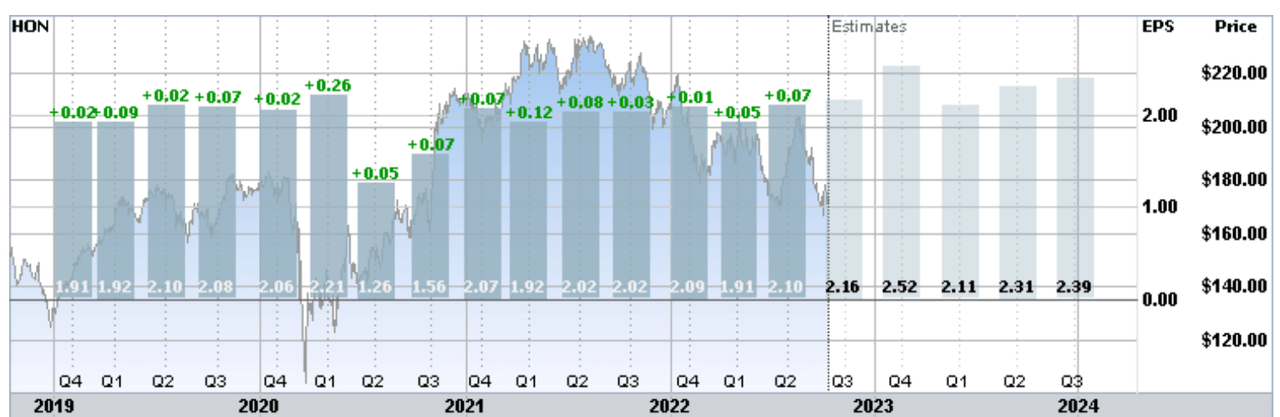
The big question for investors is whether the company will hold up over the next year or two, as management will need to deal with a broad economic slowdown (if not recession) triggered by the Fed’s aggressive rate hikes. The challenge of revamping the company’s business lines while also dealing with a low-growth economy is substantial. It is also important to note that, even with the declines in share price, HON is not especially cheap relative to earnings when compared to historical values. From 2010 to late 2017, HON’s P/E never exceeded 19. Today, the TTM P/E is 21.2 (non-GAAP) and the forward P/E is 19.9 (non-GAAP).
HON has a forward dividend of yield of 2.4% and the company recently raised the dividend by 5%. The 3-, 5-, and 10-year dividend growth rates are 6.1%, 6.7%, and 9.5% per year (annualized).
I last wrote about HON on April 6, 2022, a little over 6 months ago, and I maintained a bullish rating on the shares. From the market close on April 6th until today, HON has returned a total of -8.9% vs. -13.4% for the Dow Jones Industrial Average (DIA) and -18.2% for the S&P 500 (SPY). Since this post, HON has reported 2 more quarters of results, but the narrative is largely the same: consistent earnings but lacking evidence of growth.
At that time, the Wall Street consensus rating for HON was a buy and the consensus 12-month price target was 14.4% above the share price at that time, for an expected total return of 16.6% (the dividend yield was 2%). For a company like HON, which has historically exhibited fairly low volatility, this level of expected return would be very attractive. On the basis of the Wall Street consensus, HON looked somewhat oversold.
When analyzing a stock, I also rely on the market-implied outlook, a probabilistic price forecast that represents the consensus view among buyers and sellers of options. In early April, the market-implied outlook to January of 2023 was bullish, with expected volatility of 25% (annualized). As a rule of thumb for a buy rating, I want to see an expected total return that is at least ½ the expected volatility. Taking the Wall Street consensus price target at face value, HON exceeded this threshold (16.6% return vs. 25% volatility).
For readers who are unfamiliar with the market-implied outlook, a brief explanation is needed. The price of an option on a stock is largely determined by the market’s consensus estimate of the probability that the stock price will rise above (call option) or fall below (put option) a specific level (the option strike price) between now and when the option expires. By analyzing the prices of call and put options at a range of strike prices, all with the same expiration date, it is possible to calculate a probabilistic price forecast that reconciles the options prices. This is the market-implied outlook. For a deeper explanation and background, I recommend this monograph published by the CFA Institute.
I have calculated updated market-implied outlooks for HON and I have compared these with the current Wall Street consensus outlook in revisiting my overall rating.
Wall Street Consensus Outlook for HON
ETrade calculates the Wall Street consensus outlook for HON by aggregating the views of 14 ranked analysts who have published ratings and price targets over the past 3 months. The consensus rating is a buy, as it has been for all of the past year, and the consensus 12-month price target is 15.1% above the current share price. Combined with the 2.4% dividend yield, the expected total return is 17.5% over the next 12 months. The consensus 12-month price target was $225.67 in early April, when I last analyzed HON. The share price and the consensus price target have both declined over the past 6 months, such that the expected 12-month return implied by the consensus price target is very close to what it was 6 months ago (18.1%).
Wall Street analyst consensus rating and 12-month price target for HON (Source: ETrade)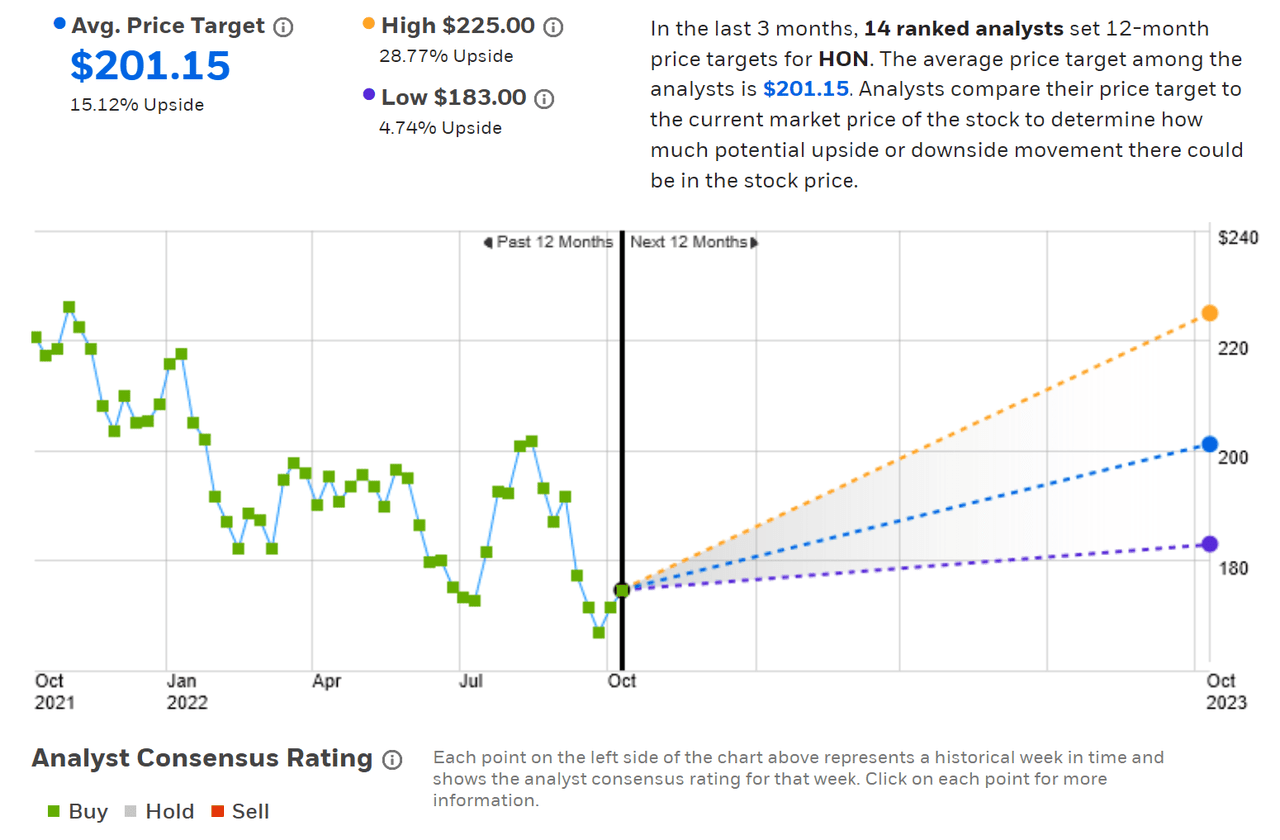
Seeking Alpha’s version of the Wall Street consensus outlook is calculated using price targets and ratings issued by 27 analysts over the last 90 days. The consensus rating is a buy and the consensus 12-month price target is 16.9% above the share price, which equates to a 19.3% total return.
Wall Street analyst consensus rating and 12-month price target for HON (Source: Seeking Alpha)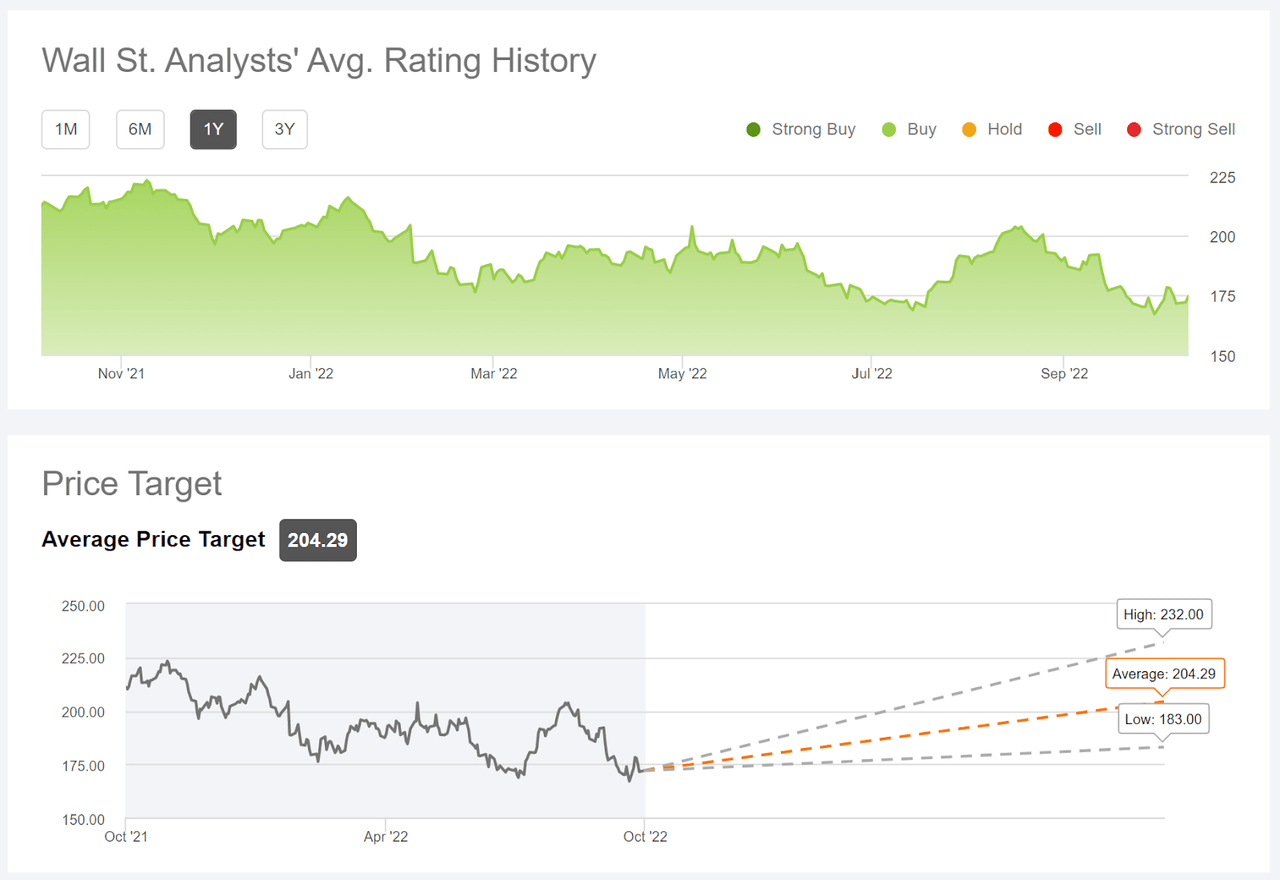
The Seeking Alpha and ETrade calculations for the Wall Street consensus outlook agree quite closely. Both have a buy rating on HON, with expected total return of 17.5%-19.3%, for an average of 18.4%.
Market-Implied Outlook for HON
I have calculated the market-implied outlook for HON for the 3.3-month period from now until January 20, 2023 and for the 8.1-month period from now until June 16, 2023. I selected these two periods to provide a view through the end of 2022 and to the middle of 2023, as well as because the options expiring in January and June tend to be among the most liquid, adding confidence in the representativeness of these outlooks.
The standard presentation of the market-implied outlook is a probability distribution of price return, with probability on the vertical axis and return on the horizontal.
Market-implied price return probabilities for HON for the 3.3-month period from now until January 20, 2023 (Source: Author’s calculations using options quotes from ETrade)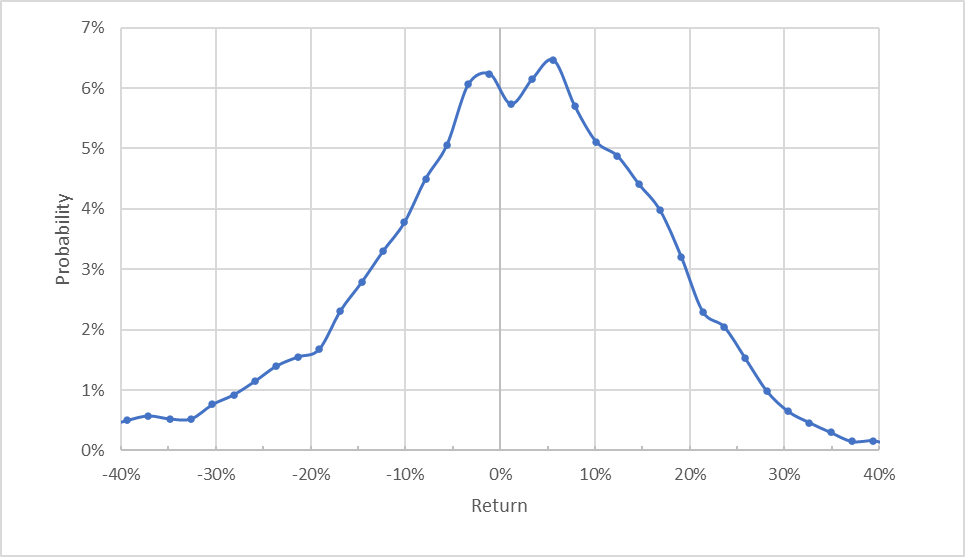
The market-implied return probabilities are clearly tilted to favor positive returns over the next 3 months. Compare, for example, the probability associated with a +10% return to that of a -10% return. The expected volatility calculated from this outlook is 30.7% (annualized). This is higher than the expected volatility calculated in early April (25%). Given that the overall volatility of the market (as measured by VIX) has increased by about 50% since April 6th, the date of my last analysis, the rise in expected volatility for HON looks mild.
To make it easier to compare the relative probabilities of positive and negative returns, I rotate the negative return side of the distribution about the vertical axis (see chart below).
Market-implied price return probabilities for HON for the 3.3-month period from now until January 20, 2023. The negative return side of the distribution has been rotated about the vertical axis (Source: Author’s calculations using options quotes from ETrade)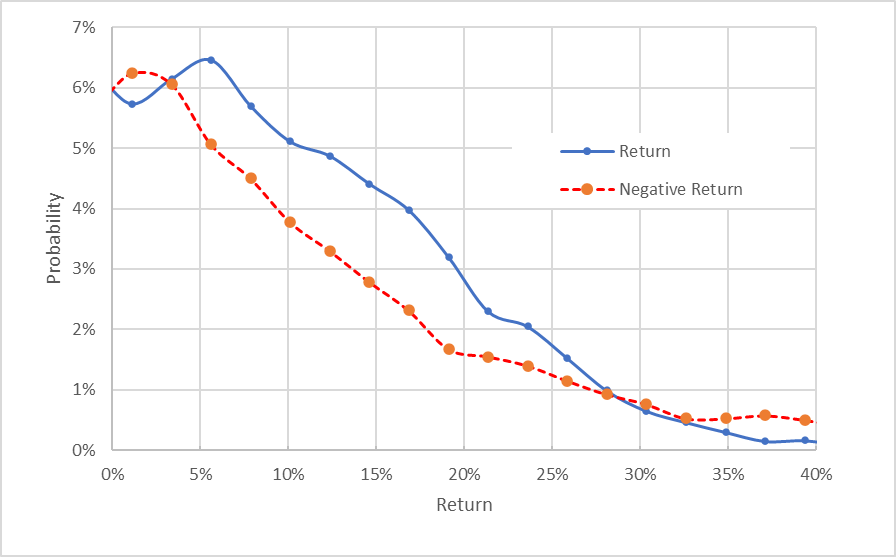
This view highlights that the probabilities of positive returns are markedly higher than for negative returns, across a wide range of possible outcomes (the solid blue line is well above the dashed red line over the left ¾ of the chart above). This is a bullish market-implied outlook for HON for the next 3.3 months.
Theory indicates that the market-implied outlook is expected to have a negative bias because investors, in aggregate, are risk averse and thus tend to pay more than fair value for downside protection. There is no way to measure the magnitude of this bias, or whether it is even present, however. The expectation of a negative bias in the outlook reinforces the bullish interpretation.
The market-implied outlook for the next 8.1 months is also bullish and is qualitatively very similar to the shorter-term outlook. The expected volatility calculated from this distribution is 30.6%, almost identical to the expected volatility calculated using the January options.
Market-implied price return probabilities for HON for the 8.1-month period from now until June 16, 2023. The negative return side of the distribution has been rotated about the vertical axis (Source: Author’s calculations using options quotes from ETrade)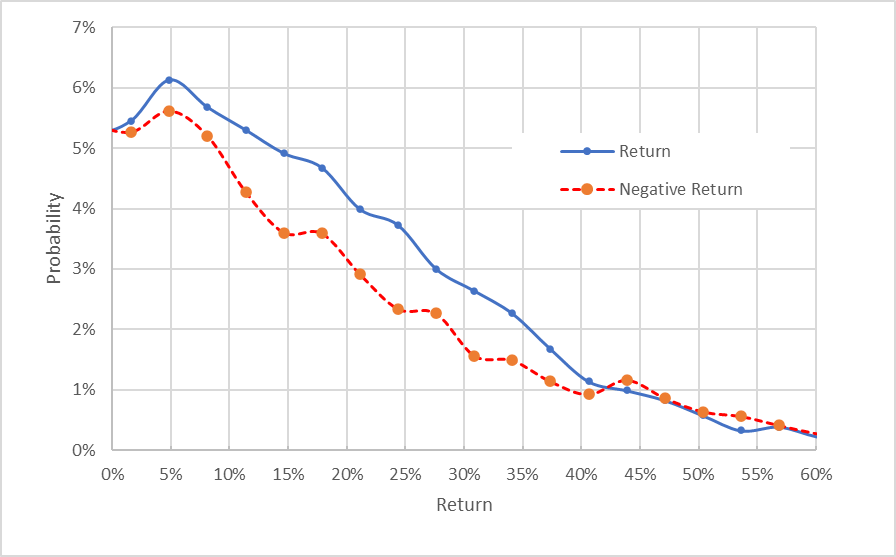
The 3.3- and 8.1-month market-implied outlooks are entirely consistent. Both are bullish, with almost identical expected volatility.
Because of concerns about HON’s growth trajectory over the next year, investors may want to consider selling covered calls. Today, it is possible to sell a call option with a strike price of $185, expiring on June 16, 2023, for $12.9 (this is the current bid price). This equates to option premium income of 7.4% over the next 8.1 months ($12.9 / $174.73), while retaining as much as 5.9% in potential price appreciation (the spread between the current share price and $185).
This position is also expected to provide a total of about $3.09 in dividends between now and when the options expire, for a total income of 9.2% over 8.1 months. If the shares rally and the share price exceeds $185, the option strike price, selling these covered calls will realize 5.9% in price appreciation, for a total return of 15.1% between now and June 16, 2023. This level of return looks quite attractive when compared with the Wall Street consensus outlook for 18.4% over the next 12 months.
Summary
Honeywell is in the process of building out more profitable product lines that are expected to provide meaningful earnings growth. The current economic slowdown is a headwind for the company. The shares have sold off on the weak near-term earnings outlook. The Wall Street consensus rating continues to be bullish, even though the consensus 12-month price target has declined substantially in the past 6 months.
The current consensus 12-month price target implied a total return of 18.4% over the next year. As a rule of thumb for a buy rating, I want to see an expected total return that is at least ½ the expected volatility (30.6%). Taking the Wall Street consensus price target at face value, HON exceeds this threshold. The market-implied outlooks for the next 3.3- and 8.1-month periods are bullish. I am maintaining my buy rating on HON.
Be the first to comment