

Motortion/iStock via Getty Images
This ETF review series aims at evaluating products regarding the relative past performance of their strategies and quality of their current portfolios. As holdings and their weights change over time, updated reviews are posted when necessary.
HIPS facts and portfolio
The GraniteShares HIPS US High Income ETF (NYSEARCA:HIPS) has been tracking the TFMS HIPS Index since 1/6/2015. It has 60 holdings, a monthly distribution with a 12-month yield of 9.88% and management fees of 0.70%. However, it is a fund of funds and the total expense ratio is 2.88%. This is a first red flag.
As described by GraniteShares in the prospectus, the rules-based Index measures the performance of up to 60 high income U.S.-listed securities that typically have “pass-through” structures that require them to distribute substantially all of their earnings to shareholders as cash distributions. This “high income, pass-through” strategy is known as HIPS.
Eligible securities must meet market capitalization and liquidity thresholds. Then, the Index selects up to 15 securities for each of four “pass-through” categories (REITs, MLPs, closed-end funds, asset management/BDCs) based on a score featuring yield (higher is better) and volatility (lower is better). Constituents are equal-weighted within each category. The weights of categories are adjusted to minimize volatility and maximize return, measured over a look-back period. A minimum category weight is set at 15% and a maximum MLPs weight at 25%. The Index is reconstituted annually and may be rebalanced quarterly under certain conditions.
HIPS currently has 51.7% of asset value in closed-end-funds, 19.2% in MLPs, 15.3% in BDCs, and 13.7% in REITs (mostly mortgage REITs). The fund is quite concentrated: the top 15 holdings, listed below, represent 51.6% of asset value.
|
Ticker |
Name |
Weight |
|
First Trust Senior Floating Ra |
3.91% |
|
|
Angel Oak Financial Strategies |
3.76% |
|
|
Nuveen Credit Strategies Incom |
3.76% |
|
|
Ares Dynamic Credit Allocation |
3.53% |
|
|
DoubleLine Yield Opportunities |
3.53% |
|
|
Western Asset High Yield Defin |
3.52% |
|
|
Barings Global Short Duration |
3.45% |
|
|
PGIM High Yield Bond Fund Inc. |
3.43% |
|
|
Nuveen Real Asset Income and G |
3.42% |
|
|
PGIM Global High Yield Fund Inc. |
3.33% |
|
|
Allspring Income Opportunities |
3.33% |
|
|
KKR Income Opportunities Fund |
3.31% |
|
|
BlackRock Corporate High Yield |
3.27% |
|
|
Western Asset High Income Fund |
3.07% |
|
|
Western Asset Emerging Markets Debt Fund Inc. |
2.97% |
Historical performance
The next table compares HIPS performance since inception with the S&P 500 and a more relevant benchmark: an equal-weight portfolio of 4 ETFs representing the 4 asset categories of HIPS, rebalanced annually. For this calculation, I have chosen Amplify High Income ETF (YYY), iShares Mortgage Real Estate ETF (REM), VanEck Vectors BDC Income ETF (BIZD), and ALPS Alerian MLP ETF (AMLP). Distributions are included and reinvested. Doing this, I have reduced the REIT universe to mortgage REITs. It may not be absolutely correct, but as yield is a primary factor of selection, selected REITs are mostly of the mortgage kind.
|
since 1/13/2015 |
Total Return |
Annual.Return |
Drawdown |
Sharpe ratio |
Volatility |
|
HIPS |
7.48% |
0.94% |
-54.04% |
0.11 |
22.45% |
|
YYY+REM+BIZD+AMLP |
19.17% |
2.30% |
-56.31% |
0.19 |
23.80% |
|
SPY |
106.96% |
9.88% |
-32.05% |
0.63 |
15.62% |
HIPS has been lagging the stock benchmark by far, and it is also behind the ETF mix by 1.36 percentage points in annualized return. It means the strategy has failed to bring added value over the mix of passive indexes. This is a second red flag.
The next chart compares HIPS with the 4 ETFs individually:
HIPS vs. YYY, REM, BIZD, AMLP (Portfolio123)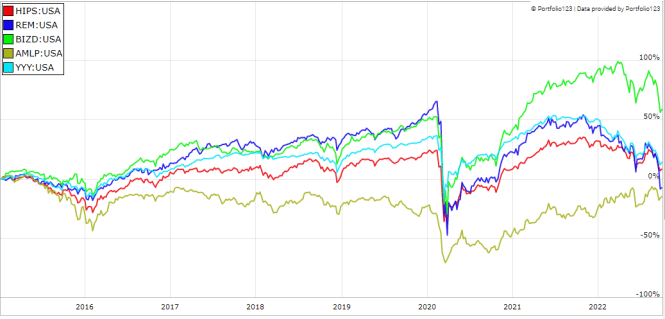
In fact, HIPS shows a capital decay of 40% since inception as of writing:
HIPS share price (Google Finance)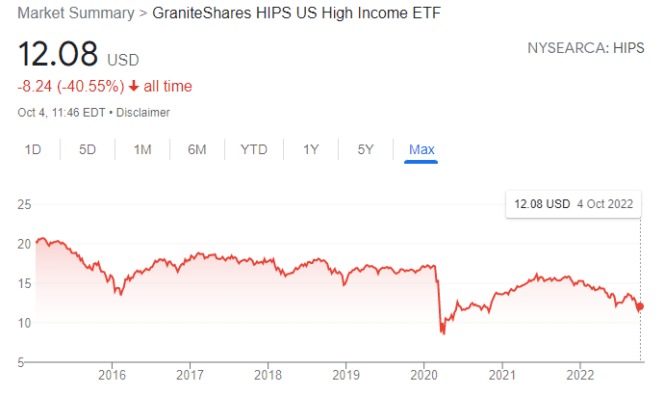
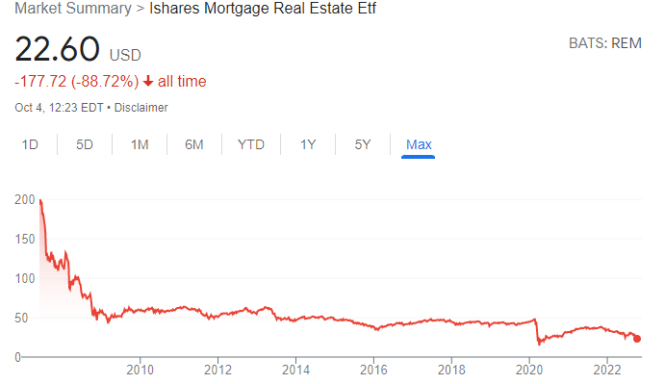
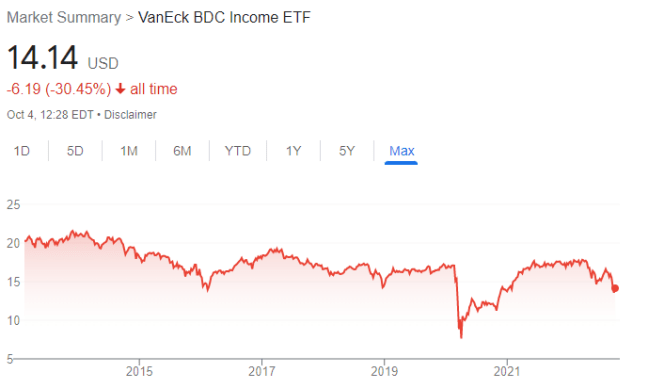
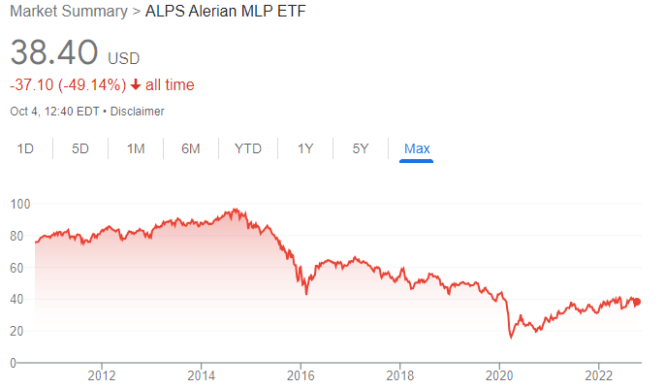
Anyway, the 4 ETFs corresponding to the 4 “pass-through” categories have lost value in share price since their respective inceptions (see next charts).
YYY share price (Google Finance) REM share price (Google Finance) BIZD share price (Google Finance) AMLP share price (Google Finance)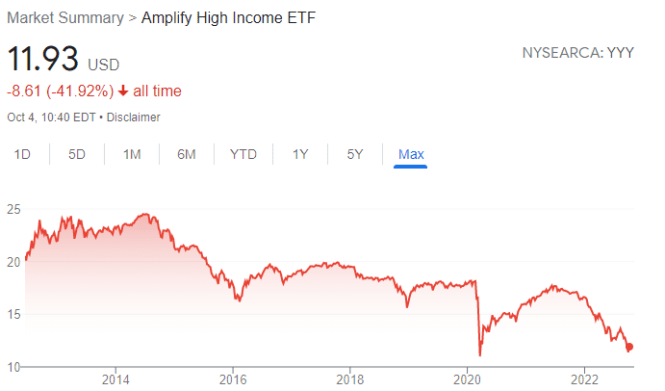
The problem is structural, not related to management: it is almost impossible to make a good recipe with bad ingredients. Other similar ETFs like the Global X Alternative Income ETF (ALTY), reviewed here, have the same issues.
This issue is not specific to HIPS and ALTY: securities with yields above 6% suffer from capital decay. The 10-year average annualized return including dividends of all ETFs with a daily volume above $100k and a yield superior to 6% is 2.3%, for an average yield of 8.8% (data calculated with Portfolio123).
Capital decay also means income stream decay. HIPS has maintained a constant monthly distribution for a while, but I doubt it is sustainable. The yield cannot go up indefinitely to offset the loss in asset value.
The full picture for an income-seeking investor is not pretty, considering the current inflation rate and the tax paid on distributions. HIPS might be used as an instrument for swing trading or tactical allocation, but I don’t see it as a reasonable buy-and-hold investment. This is true for a number of high-yield instruments, not only this one.
A solution to get high yields without decay
Capital and income decay is a structural issue in many closed-end funds, like in most high-yield instruments. However, it is not inexorable if one knows how to trade CEFs instead of using them as buy-and-hold instruments. I designed a 5-factor ranking system statistically related to forward returns across the full CEF universe, and started publishing the 8 best-ranked liquid CEFs in Quantitative Risk & Value (QRV) after the March 2020 market meltdown. The list is updated every week. Its average dividend yield varies around 7-8%. It is not a model portfolio: trading the list every week is too costly in spreads and slippage. Its purpose is helping income investors find funds with a good entry point. In the table and chart below, I give the hypothetical example of starting a portfolio on 3/25/2020 with my initial “Best 8 Ranked CEFs” list and updating it every 3 months since then, ignoring intermediate updates to limit transaction costs. Return is calculated with holdings initially in equal weights using closing prices on quarterly rebalancing days, without trading cost. Dividends are reinvested at the beginning of every 3-month period.
|
since 3/25/2020 |
Total Return |
Annual.Return |
Drawdown |
Sharpe ratio |
Volatility |
|
Best 8 CEFs quarterly |
128.04% |
38.57% |
-20.21% |
1.56 |
20.30% |
|
SPY |
54.21% |
18.70% |
-24.37% |
0.82 |
19.51% |
Best CEFs list performance (chart: author)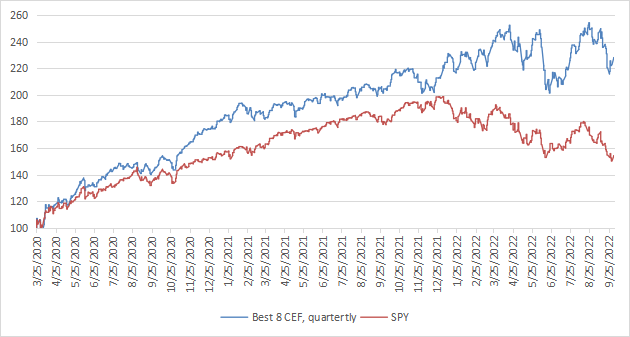
Dates and lists can be checked in QRV post history (trial is free). Past performance is not a guarantee of future return. Data calculated with Portfolio123.
The “Best 8” list has been quite volatile in 2022, but much more resilient than the broad equity and bond indexes. I don’t claim it will beat SPY in the future like it did in the past 2 years, but a discount-driven rotational strategy in CEFs has a much better chance to protect both capital and income stream against erosion and inflation than any high-yield passive investment like HIPS.
Be the first to comment