

Editor’s note: Seeking Alpha is proud to welcome Harry Mamaysky as a new contributor. It’s easy to become a Seeking Alpha contributor and earn money for your best investment ideas. Active contributors also get free access to SA Premium. Click here to find out more »
pandemin
2022 has been a year of geopolitical tumult and of financial market volatility. These two major themes mixed together in the global oil market to produce a somewhat bewildering year of rallies, sell-offs, and supply and demand uncertainty. We will try to make sense of the situation by looking at six (highly informative) charts.
Following their collapse due to COVID-19 in 2020, oil futures prices came roaring back and peaked sometime in the middle of 2022. Since then – and somewhat to the perplexment of pundits (and us) – oil has had a dramatic sell-off and is currently hovering just above its last 12-month lows. This is despite the continuing tragic war in Ukraine, and the recent $60 price cap imposed on Russian oil exports by the West, which experts believe will constrain global supply in the years ahead.
Chart 1: WTI Crude Oil Futures Price (Front Month)
QuantStreet, Bloomberg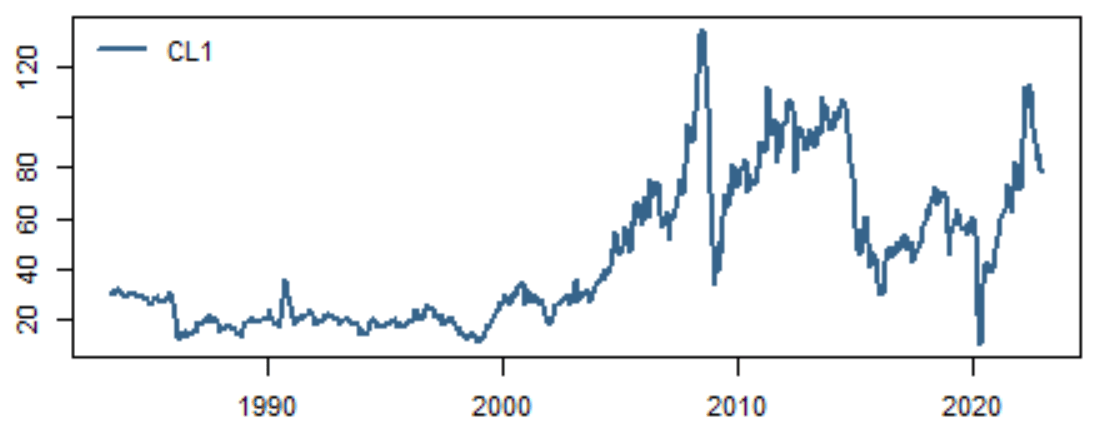
To begin to understand some of the factors that led to oil price declines over the last few months, consider that the Biden administration sold 180 million barrels of oil from the U.S. Strategic Petroleum Reserve (SPR) starting in March 2022. This tactic was meant to control gasoline prices at the pump – it also did not hurt the Democrats in the 2022 midterm elections – but from what we’ve read, the SPR was not intended as a vehicle for controlling gasoline prices. The SPR is meant for truly dire situations where there is a physical lack of supply – due to war or natural disaster – and where oil is needed to power the economy. There was no dearth of supply in 2022 – just higher prices. Using the SPR to “speculate” on oil prices, aside from setting a bad precedent, also has the potential to backfire. There are now media reports that the U.S. Department of Energy has started to buy back oil. If the SPR release was a factor on the way down for oil prices, replenishing the SPR might be an equally big factor when oil trades back up.
Chart 2: U.S. Department of Energy Crude Oil Inventories (Including the SPR)
QuantStreet, Bloomberg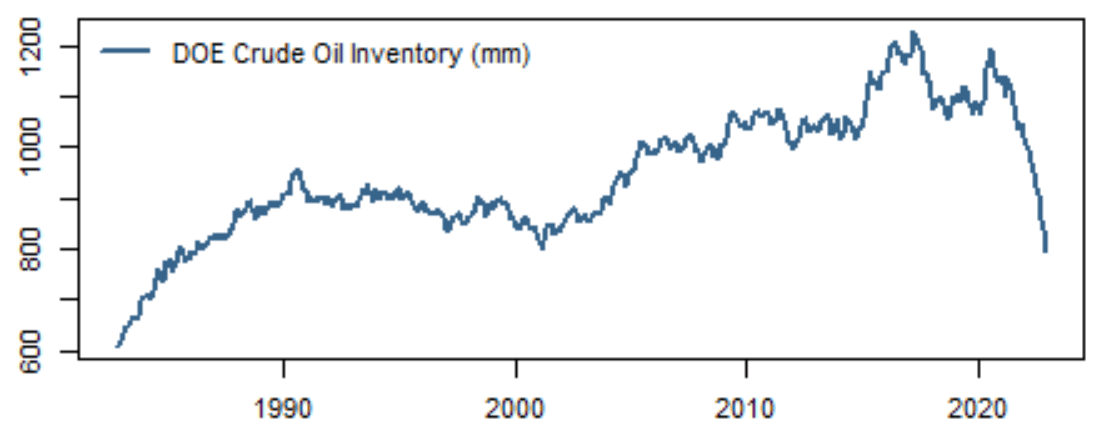
One of the interesting pieces of information available about oil futures is the number of futures contracts owned by speculators (non-producers) and hedgers (oil producers). After spending many years hovering around zero, the number of crude oil futures owned by speculators (e.g., hedge funds, commodity trading advisors, etc.) peaked in 2018, then grew again in 2020 and into 2021, and has been in a decline since mid-2021. There is a voluminous academic literature on whether investor positioning in futures markets helps to predict future price moves. The results, unfortunately, are mixed.
One interpretation of the drop in speculative positioning in crude oil futures is that fast money was betting on oil price increases, and was then forced to unwind as oil prices fell. This interpretation supports future oil price increases. The other interpretation is that the drop in speculator positioning was caused by decreased producer hedging demand (i.e., producers might sell forward their production if they are concerned about lower future oil demand). Under this interpretation, the reduced liquidity provision by speculators for hedgers would render expected returns on oil lower going forward. While the future price implications of the decrease in speculator positioning are unclear, perhaps the main takeaway is that technicals in oil futures are getting cleaned up and are less likely to stand in the way of whatever the fundamentals dictate in 2023.
Chart 3: Speculative Positioning in Crude Futures on N.Y. Mercantile Exchange
QuantStreet, Bloomberg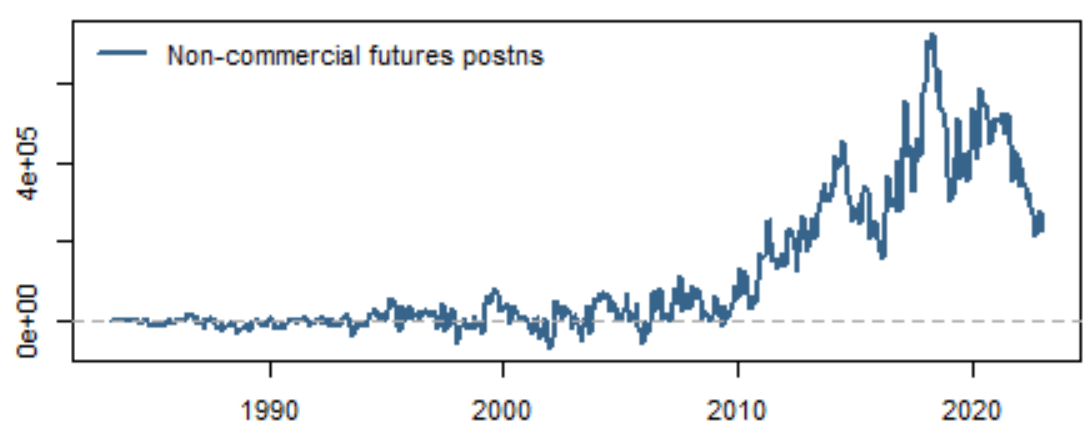
On the production side, after the large drop-off during COVID-19, OPEC production is back to the low end of its historical range. OPEC, of course, manages its oil production to achieve the dual objective of price stability for consumers and profitability for OPEC members. We are not experts on OPEC spare capacity, but news reports suggest that it’s tight. Bloomberg estimates it to be just over 5 million barrels per day as of late 2022 (accessible via the .OPCSPCAP function on the Bloomberg terminal). So there is scope for OPEC to increase production should demand increase, but anecdotally that wiggle room is not vast.
Chart 4: Bloomberg Total OPEC Crude Oil Production
QuantStreet, Bloomberg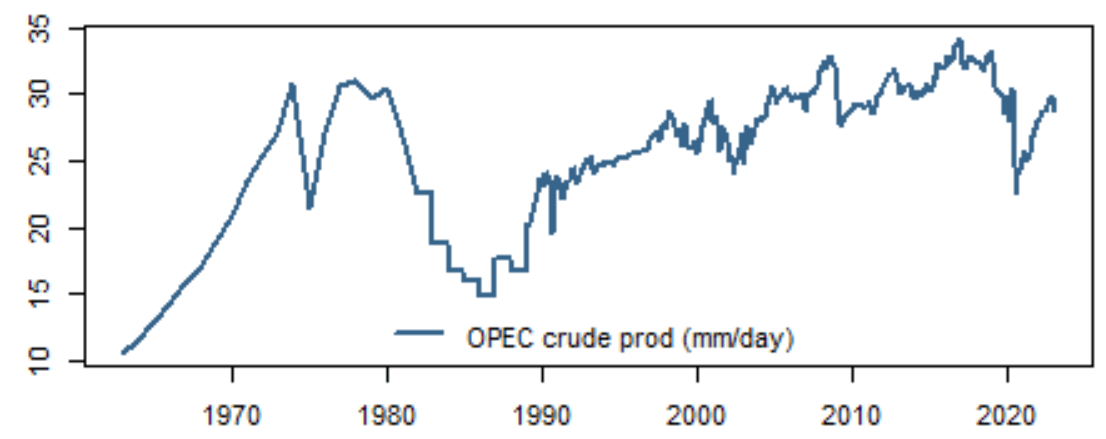
On the U.S. side of things, production has also rebounded from the COVID-19 lows, and the upward production trend started in the 2010s by the shale revolution looks set to continue. Bloomberg recently reported that U.S. production is set to rise to 12.3 million barrels in 2023, which is a revision down from prior estimates. This suggests that U.S. production might also not be able to cope, in the short term, with a potential spike in global demand.
Chart 5: U.S. Department of Energy Crude Oil Total Production
QuantStreet, Bloomberg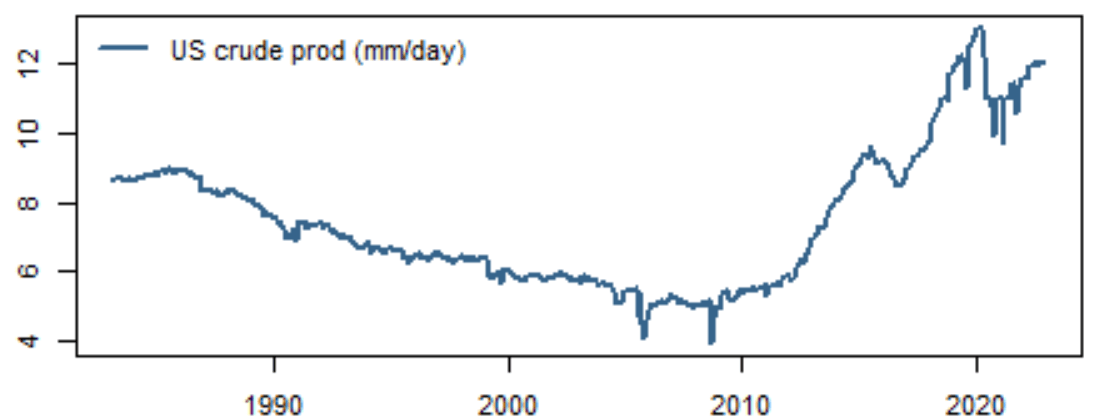
The net effect of all of these factors is: (1) reduced global supply in light of Russia’s exclusion from integrated global crude markets, (2) a large buyer of crude in the form of the U.S. Department of Energy looking to replenish the SPR, (3) cleaned up positioning in crude futures markets, and (4) tight spare capacity in OPEC and the U.S.
The analysis thus far has focused on the supply side of oil markets. On the demand side, there are concerns about recessions in the U.S. and Europe, on the back of central bank policy tightening in 2022 to fend off inflation. There are also concerns about a slowdown in China, though these are starting to abate post China’s relaxation of COVID-19 restrictions. At the end of the day, it is the demand side that will determine what happens to oil markets in 2023. Supply is tight, and investor positioning is no longer as extreme as it was earlier in 2022. Should demand for oil tick up – or do better than consensus estimates – oil prices could go meaningfully higher in 2023.
Chart 6: Energy Stock Prices (Energy Select Sector Exchange Traded Fund)
QuantStreet, Bloomberg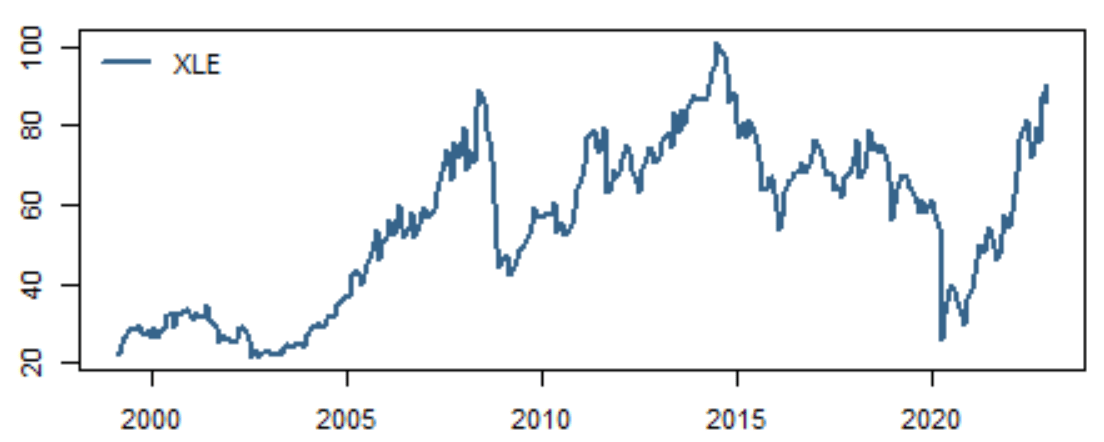
While front-end crude oil future prices move to reflect short-term supply and demand conditions in the oil market, the stocks of energy companies look much further ahead. An energy stock basket, like the Energy Select Sector SPDR ETF (XLE), reflects the present value of all future earnings that energy companies are likely to generate. This looks right past local fluctuations in oil prices out into the distant future. Judging by energy companies’ stock prices, the outlook for energy is attractive for producers.
This totality of the evidence suggests that oil prices will remain firm for the foreseeable future, even though there are sure to be temporary dips. The net takeaway for investors is as follows: Oil should play a role in most diversified investment portfolios. It serves as a hedge should inflation go higher than is currently expected, and even if inflation remains under control (our base case), the net supply/demand dynamics favor a long oil exposure in 2023.
Be the first to comment