

golfcphoto
Written by Nick Ackerman, co-produced by Stanford Chemist. This article was originally published to members of the CEF/ETF Income Laboratory on July 16th, 2022.
Miller/Howard High Income Equity Fund (HIE) recently released their latest semi-annual report. After reading through it, it would appear that everything is business as usual for the fund. While that is the case, the overall energy space has reversed many of the gains they achieved earlier this year. The collapse came quite swiftly, too. HIE is tilted with a heavier focus on energy investments. Those declines caused HIE to fall fairly dramatically recently.
The fund remains at an attractive discount, with the latest declines making it a potentially even better-buying opportunity now. As a reminder, the fund is structured as a term fund that is anticipated to liquidate on November 24th, 2024.
That means the discount should naturally decrease as we get closer. As investors can realize the discount in this name, it can make it more appealing. This is a riskier fund, though, given the high exposure to the cyclical energy space. On top of this, the fund utilizes a moderate amount of leverage.
Additionally, we covered in the last update on HIE how the fund is heavily invested in by institutions. Primarily, they are invested in heavily by activist investors. Saba Capital Management had nearly 15.5% of the outstanding shares owned. Insiders were also buying the fund too.
The Basics
- 1-Year Z-score: 0.38
- Discount: 7.12%
- Distribution Yield: 6.05%
- Expense Ratio: 2.03%
- Leverage: 21.35%
- Managed Assets: $243.6 million
- Structure: Term (expected November 24th, 2024)
HIE is classified as a “diversified, closed-end management investment company whose primary objective is to seek a high level of current income with capital appreciation as a secondary objective.”
They intend to invest “at least 80% of its total assets in dividend or distribution paying equity securities of US companies and non-US companies traded on US exchanges. The Fund will seek to invest in securities that the Investment Advisor considers to be financially strong with reliable earnings, high dividend or distribution yields, and rising dividend growth. The Fund may invest up to 25% in Master Limited Partnerships (“MLPs”), generally in the energy sector. The Fund intends to engage in an options writing strategy consisting of writing put options on securities already held in its portfolio or securities that are candidates for inclusion in its portfolio. It may also engage in covered call writing strategies, and it may buy put and call options. The Fund may write covered put and call options up to a notional amount of 20% of the Fund’s total assets.”
Since it is a regulated investment company or RIC, it can’t own more than 25% of MLPs. However, they can include all the regular C-corp energy names they want, which tend to participate more in the downside but also the upside in energy prices.
The fund’s expense ratio comes to 2.03%; when including the leverage expenses, it comes to 2.23%. The borrowings are through floating rates through a tiered system.
HIE Leverage Expense (Mille/Howard)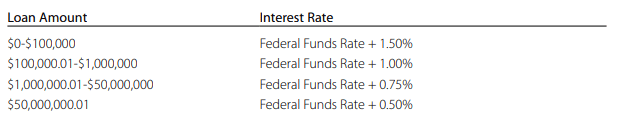
With the Fed raising rates, their leverage expenses are climbing. That’s part of what offset what would have otherwise been an increase in net investment income for shareholders.
Performance – Discount Remains Attractive
The fund was holding up well due to the energy exposure. However, with energy’s rapid sell-off to join along with the rest of the sectors, the fund is now showing some shallow losses on a YTD basis.
Energy still remains the only green sector YTD, but down substantially from where it had been trading. HIE isn’t entirely invested in energy, which is why we see some declines. Of course, this is still doing materially better than the rest of the “market.”
YCharts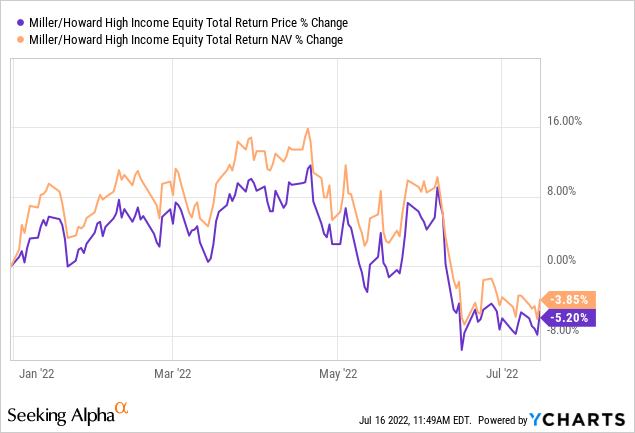
Now that the fund’s share price has fallen due to the underlying portfolio also falling, we can combine that with the fund’s fairly attractive discount. It is down a bit since our previous update but is still down meaningfully from its historical average.
YCharts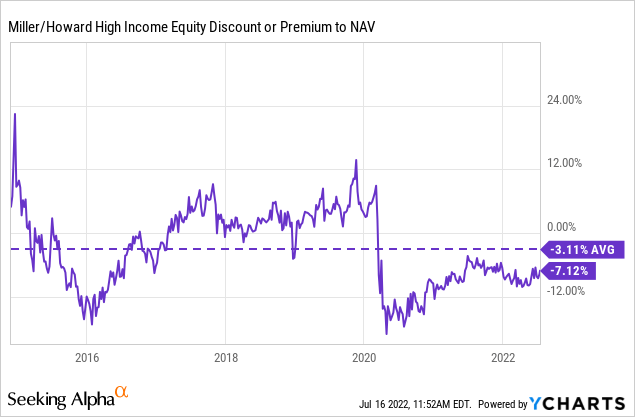
Distributions – Higher Expenses Take Benefit Away From Higher Income
The portfolio is actively managed and is constantly turned over. The latest report is a bit less so than usual but changing nonetheless. That means that income in the fund can go up and down due simply to investment changes.
Another way income can fluctuate is by holding dividend stocks that raise their dividends. They noted in the report that 18 of their stock holdings increased the dividends by an average 24.47% growth. That’s one of the reasons why the total investment income of the portfolio jumped to nearly $4.85 million from the $4.098 million in the same six-month period a year earlier.
Unfortunately, it didn’t translate into any more net investment income for shareholders. The reason is that the fund’s total expenses also climbed from $1.752 million to $2.687 million. The main driver was the higher advisory fees and professional fees due to increased assets under management.
The interest expenses also ran up substantially, partially due to higher rates and more outstanding borrowings. They took the loan from $50.5 million to $52 million.
It isn’t all bad news, though, as they noted that the average interest rate over the last six months was 0.90%. That will increase, but it is substantially below the dividend yield of the holdings in the portfolio.
As of April 30, 2021, we have borrowed an average amount equal to 19.5% of the managed assets of the Fund at an average interest rate during the 6-month period of 0.9%. Considering that the underlying portfolio dividend3 yield is 5.0 times the borrowing rate, it is an effective income enhancement. The use of leverage could increase volatility but, in our view, the inherent volatility of the portfolio is sufficiently low as to warrant this modest level of leverage.
They’ve still been able to take a lot of gains, too, for the year, which has resulted in their distribution coverage being quite fine. In fact, I would still believe that a distribution boost could be appropriate. Given the uncertainty of the environment, I’m not sure if they will.
HIE Semi-Annual Report (Miller/Howard)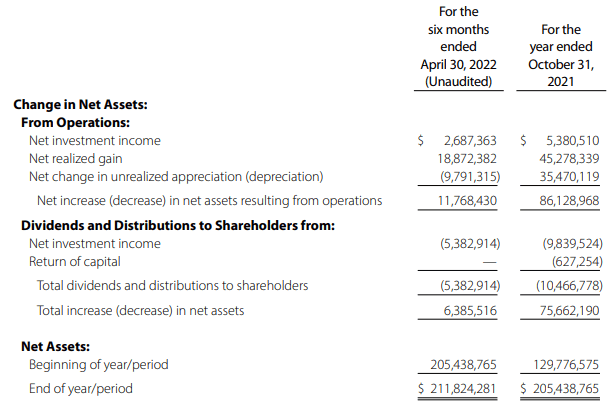
Part of the realized gains here are from the options writing strategy of the fund. That generated almost $2 million in realized gains. That can be generated when times are good or when times are bad. If we continue to slide, the NII and option premium could be enough to cover the distribution.
That’s a great situation to be in. The 5.78% distribution yield, while being a bit low, is sustainable, it would appear.
For tax purposes, they have had return of capital show up in their distributions. However, since they hold MLPs and REITs, this is expected.
HIE Semi-Annual Report (Miller/Howard)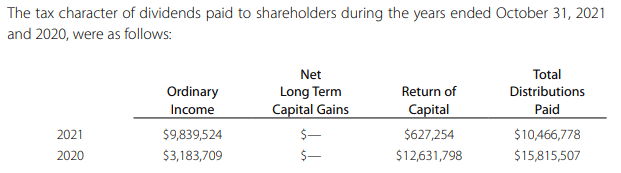
HIE’s Portfolio
For the last six months, the portfolio turnover has been 67%. I had mentioned above that it is actually on the lower side. Last year was 155% for the full year, then 277% and 166% for 2020 and 2019. The manager is generally quite active in moving the portfolio around. It also has to do with the small size of the fund. With only approximately 40 positions normally, it doesn’t take much buying and selling to increase that turnover rate.
The fund’s exposure at the end of April 2022 still has energy as a top allocation of the fund.
HIE Industry Allocations (Miller/Howard)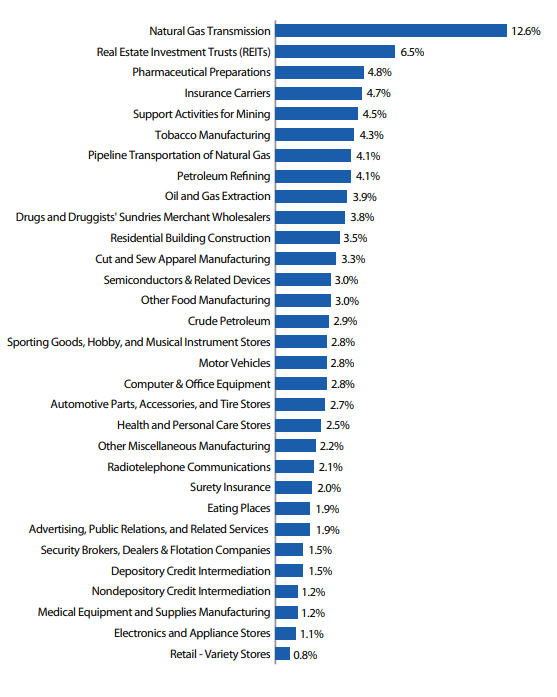
Industries such as natural gas transmission, pipeline transportation of natural gas, petroleum refining, oil and gas extraction and crude petroleum are all going to fit into the energy space. On a side note, they list 31 industries here. That means some of these exposures are literally just due to one position in the fund, being that there are so few positions overall.
As an example, petroleum refining is simply TotalEnergies SE ADR (TTE). The oil and gas extraction is just Shell (SHEL), and natural gas transmission is Kinder Morgan (KMI). I haven’t paid attention to SHEL in a while, only noticing now they dropped the Royal Dutch part of their name.
The portfolio here isn’t large, and it isn’t complex. In fact, it mirrors a lot of positions I’m already holding directly, such as Conagra Brands (CAG), Altria (MO), Ford (F) and AbbVie (ABBV). HIE is simply just a way to gain further exposure to these names within the CEF structure. More specifically, HIE’s term structure allows where the discount can be realized in the future. Perpetual funds can stay at perpetual discounts.
The last report shows that Energy Transfer (ET), MO, and TC Energy (TRP) are the largest positions in the fund. That helps further highlight the focus on energy, which is a core part of the fund’s strategy. They target higher-yielding equity investments, which generally lead to the energy space.
Conclusion
HIE appears to be business as usual. The fund’s discount and now decline with the broader markets and energy space make it an appealing option that I believe is worth investing in. I believe it is riskier due to the fund’s positioning and leverage. However, if one is still comfortable with those risks, these shares seem to have an opportunity. The distribution is well covered through income and option premium, despite not participating in the higher income that the underlying portfolio generated due to higher expenses.
Be the first to comment