

EXTREME-PHOTOGRAPHER
Investing during uncertain times can lead to a tremendous amount of volatility, even when you are a value investor focusing on stocks that are trading on the cheap. One example of this volatility that has worked out so far in a negative way can be seen by looking at sporting goods retailer Hibbett (NASDAQ:HIBB). Although the company ended its 2022 fiscal year in strength, both from a revenue perspective and when it comes to profitability, the 2023 fiscal year is so far turning out to be a bit of a problem. Revenue is falling and profits are declining with it. Even so, the data provided by management suggests that shares of the enterprise are trading at pretty cheap levels. While it is likely that there are better prospects on the market to be had today, the company does still represent an intriguing opportunity that could offer some nice upside for the foreseeable future. This has led me to retain my ‘buy’ rating on the stock for now despite the recent weakness we have experienced.
Performance has shifted
The last time I wrote an article about Hibbett was back in October of 2021. Over the 11 months since then, the picture has been rather interesting. You see, at that time, I had acknowledged that the company had a rocky operating history. But even so, I was impressed with the financial performance the company had demonstrated in recent years. I also said that shares to the company were trading on the cheap, making it an attractive long-term prospect even though I also made clear that the volatility of the business could make owning its shares unnerving. Ultimately, I ended up rating it a ‘buy’, reflecting my belief then that it would likely generate performance that would exceed what the broader market would for the foreseeable future. Since then, however, the outlook for the economy has changed significantly and shares have not reacted in the most positive way. Driven by recent weakness in fundamentals, shares of the company have generated a loss for investors of 27.9%. That’s more than double the 13.8% decline seen by the S&P 500 over the same timeframe.
Author – SEC EDGAR Data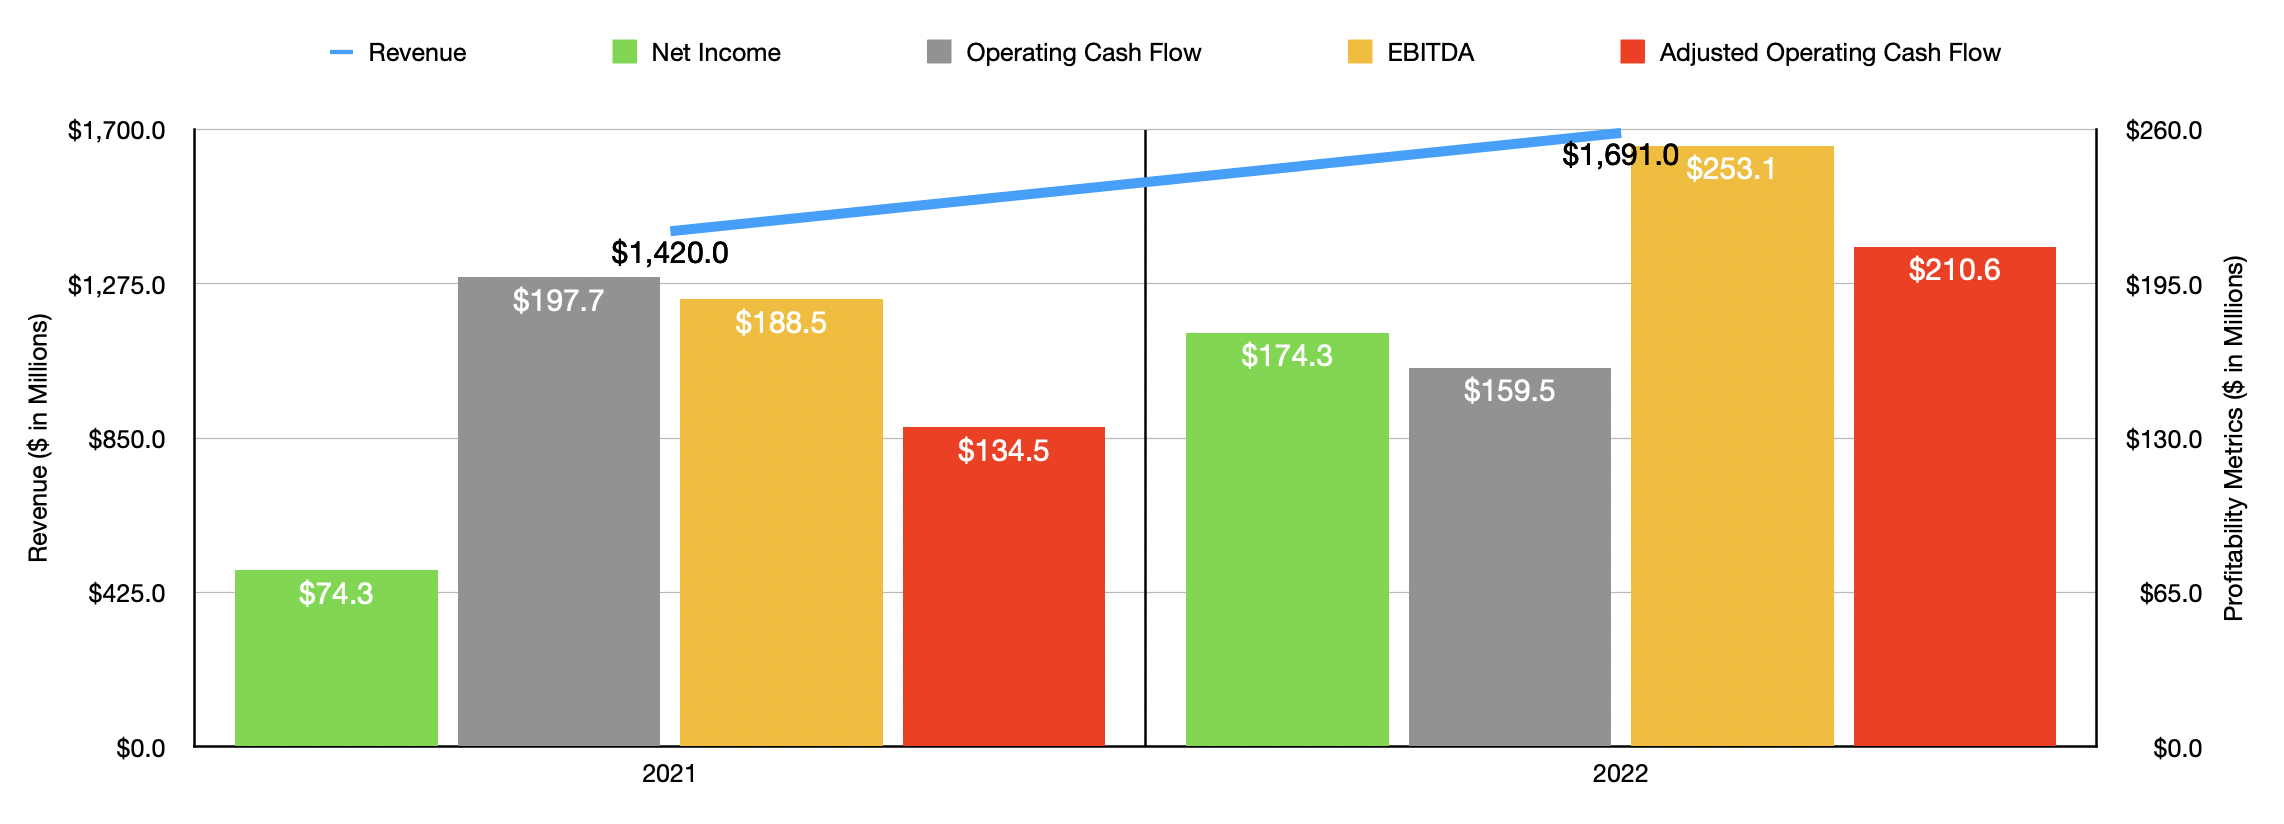
Before we get into the most recent data, we should touch briefly on how the company ended its 2022 fiscal year. During that year, sales came in strong at $1.69 billion. That represents an increase of 19.1% over the $1.42 billion the company generated in 2021. This rise in sales was driven by two key factors. First and foremost, the company saw its comparable store sales grow by 17.4% as the economy reopened and accelerated following the worst of the COVID-19 pandemic. And second, the company saw the number of locations that it has in operation grow from 1,067 to 1,096.
This rise in sales brought with it an improvement in profitability. Net income, for instance, grew from $74.3 million in 2021 to $174.3 million in 2022. There are, of course, other measurements of profitability we should pay attention to. Operating cash flow, as an example, dropped from $197.7 million to $159.5 million. But if we adjust for changes in working capital, it would have risen from $134.5 million to $210.6 million. And finally, we also saw EBITDA grow, rising from $188.5 million in 2021 to $253.1 million last year.
Author – SEC EDGAR Data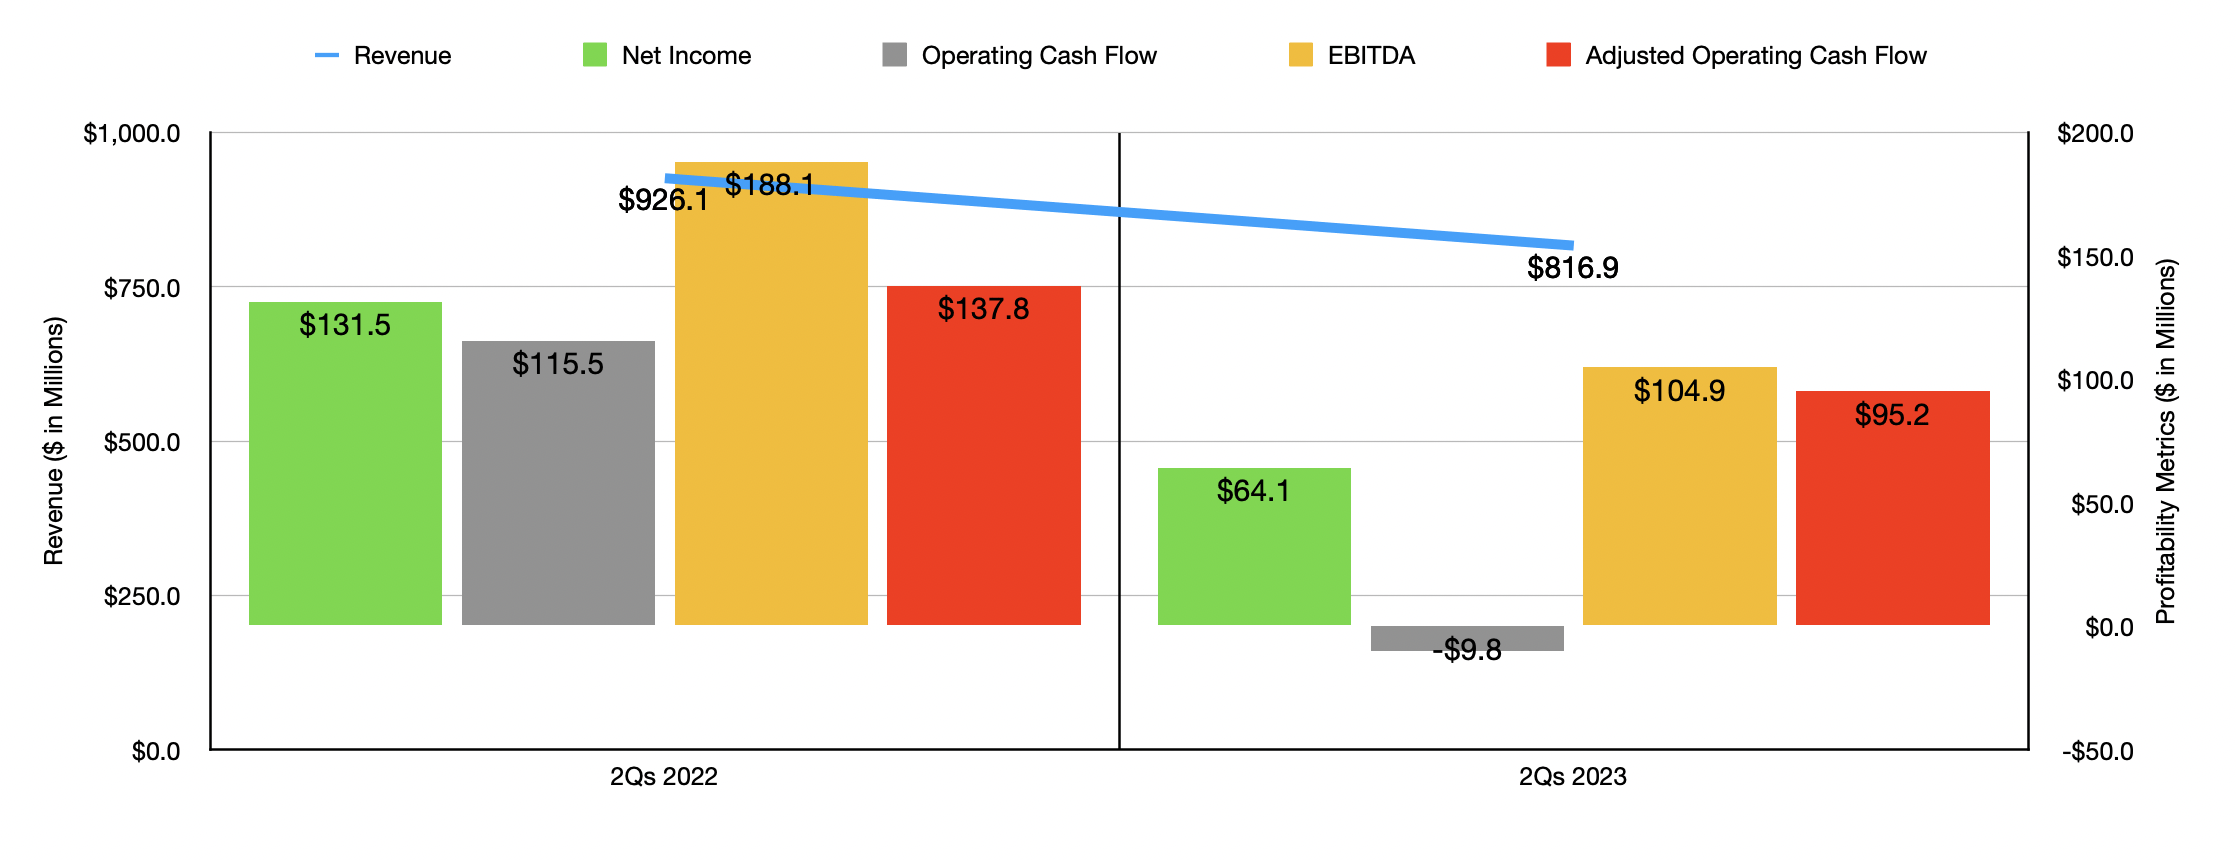
As great as the 2022 fiscal year for the company was, that strength, unfortunately, did not continue into this year. Revenue, for instance, came in during the first half of the 2023 fiscal year at $816.9 million. This came even as the number of stores in operation grew from 1,080 at the end of the first half of 2022 to 1,117 the same time this year. The real pain for the company then came from comparable store sales, which plunged by 14.5% year over year. This was driven by a 17.4% drop in brick-and-mortar comparable store sales, while the e-commerce sales for the company grew by 6.2%. This change, it is worth mentioning, pushed the company’s e-commerce sales up to 14.9% of total sales. That compares to the 12.4% seen one year earlier and is up from the 8.4% the company saw in 2019. Clearly, the firm is continuing to become more focused on the digital space and successfully so.
Naturally, whenever you see an asset-intensive business with low margins report a decline in comparable store sales, you should expect to see profitability suffer as well. Net income in the first half of the year came in at just $64.1 million. That’s less than half the $131.5 million reported in the first half of 2022. The company suffered from a decrease in its gross margin from 40.3% in the first half of 2022 to 35.7% the same time this year, with a higher share of e-commerce sales negatively affecting the company’s bottom line. Meanwhile, selling, general, and administrative costs, also rose, climbing from 20% of sales to 22.9%. This, management said, was driven primarily by the result of deleverage from the year-over-year sales decline in areas like wages, professional fees, advertising and supplies, and more. This ultimately had a negative impact on other profitability metrics as well. Operating cash flow went from $115.5 million to negative $9.8 million. Even if we adjust for changes in working capital, it would have gone from $137.8 million to $95.2 million. EBITDA also took a beating, dropping from $188.1 million to $104.9 million.
When it comes to the 2023 fiscal year as a whole, management expects revenue to increase at a low single-digit rate, driven by between 30 and 40 net new stores compared to what the company had at the end of its 2022 fiscal year. Earnings per share should be between $9.75 and $10.50. At the midpoint, that would translate to net income of $134.7 million. No guidance was given when it came to other profitability metrics. But if we annualize the figures given for the first half of the year, we should end up with adjusted operating cash flow of $162.8 million and EBITDA of $195.6 million.
Author – SEC EDGAR Data
Given these figures, we can calculate that the company is trading at a forward price-to-earnings multiple of 5.1. The price to adjusted operating cash flow multiples should be 4.2, while the EV to EBITDA multiple should come in at 3.9. As you can see in the chart above, these numbers are higher than what the company would be priced at using data from 2022. But it’s also cheaper than if we used data from 2021. As part of my analysis, I decided to compare the firm with three other similar retailers. On a price-to-earnings basis, these companies ranged from a low of 3.7 to a high of 9.2. And when it comes to the EV to EBITDA approach, the range is between 2.1 and 4.2. In both cases, two of the three firms were cheaper than Hibbett. Meanwhile, using the price to operating cash flow approach, the range was between 5 and 16.9, with our prospect being the cheapest of the group.
| Company | Price / Earnings | Price / Operating Cash Flow | EV / EBITDA |
| Hibbett | 5.1 | 4.2 | 3.9 |
| DICK’S Sporting Goods (DKS) | 9.2 | 16.9 | 4.2 |
| Big 5 Sporting Goods (BGFV) | 4.0 | 5.0 | 2.1 |
| Sportsman’s Warehouse Holdings (SPWH) | 3.7 | 6.6 | 2.5 |
Takeaway
Based on all the data provided, it seems to me as though Hibbett stock is very attractively priced at this point in time. Yes, fundamentals are worsening, particularly on the bottom line. Relative to similar firms in the space, the company seems to be more or less fairly valued. It is also true that the historical volatility of the company has been somewhat significant. So because of these factors, I do think there might be better opportunities to be had. But even with that being the case, shares do look cheap enough today to warrant some upside, even if financial performance were to revert to what it was in prior years like 2021.
Be the first to comment