

gilaxia/E+ via Getty Images
Hibbett, Inc. (NASDAQ:HIBB), is a sports apparel retailer, particularly of Nike (NKE) footwear. The company’s stores are concentrated in the Southeast, in what the company calls “underserved communities.”
Like many retailers, HIBB’s revenues exploded in 2021, and the company leveraged on its operations to generate extraordinary profits. That same operational leverage now exposes the company to a significant decrease in earnings that may not be completely priced in the stock yet.
Before the pandemic, between 2009 and 2019, the company had grown retail space by 40% and revenues per square feet by another 40%. However, growth was completely eaten by faster-growing SG&A expenses.
In strategic terms, falling profits with growing revenues during much of the past decade signal either a less-than-ideal business or a less-than-ideal management. In my opinion, that means investors should demand a higher margin of safety on HIBB’s stock. On a more short-term basis, although future macroeconomic conditions are difficult to forecast, the current reading seems to point a little more towards deterioration of consumption. Therefore, from a tactical perspective, HIBB is also expensive.
Note: Unless otherwise stated, all information has been obtained from HIBB’s filings with the SEC.
Industry and competitive advantages
HIBB is a pure retailer of sports apparel and footwear. The company has no manufacturing operations and no private brands. As of January 2022 (FY22 in the company’s financial statements), 65% of the company’s sales were generated by Nike products, who has been the most important vendor since 2012 at least. The second most important vendor is Adidas (OTCQX:ADDYY, OTCQX:ADDDF) with a much lower 6% of sales.
In my opinion, HIBB has to compete on the basis of its stores, particularly location and ambience, and on the basis of cost control. Given that the company carries the same brands other retailers carry, it has to compete on the basis of how attractive stores are to customers. More customer traffic also provides the company with bargaining power with vendors. Also, given that it operates in a high-rivalry, low-margin industry, it has to control costs to keep profits high across the cycle.
HIBB’s competitive strategy is based on store location. The company concentrates its stores in “underserved communities” in the Southeast. The company has 100 stores in Alabama but only 18 in California, 124 in Georgia and only 3 in New York, 115 in Texas and none in most Northeastern states. According to the company, by locating its stores in underserved locations, it generates lower rent and labor costs, while facing less competition. Although this strategy is interesting, it does not provide a moat. In order to compete on the same basis, a competitor only has to open stores in the same communities.
Finally, like every brick and mortar retailer, HIBB carries substantial operational leverage. Stores and salespeople have to be paid quite independently of revenue levels. Combined with low operating margins, this multiplies small variations in revenues into enormous variations in net income.
Operational history
Now that we understand the company’s competitive landscape, we can use metrics to judge the company’s operations.
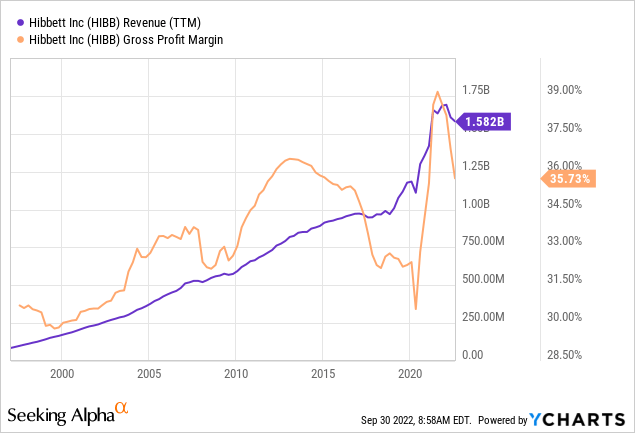
Starting with the top line, HIBB has done very well. Like the chart below shows, the company has grown revenues consistently. Although cyclical, the company’s gross margins have also grown.
Revenue growth was caused mostly by increasing sales per square foot of retail space (first chart below). The company also increased its total retail space (more or bigger stores, second chart below). However, during the fastest retail space growth period (2012 to 2017) the company’s sales per dollar spent on leases actually decreased. This signals that the company was being marginally less efficient on each square foot of retail space added.
HIBB’s sales per square feet, total square feet and sales per dollar spent on leases (Own, based on HIBB’s filings with the SEC)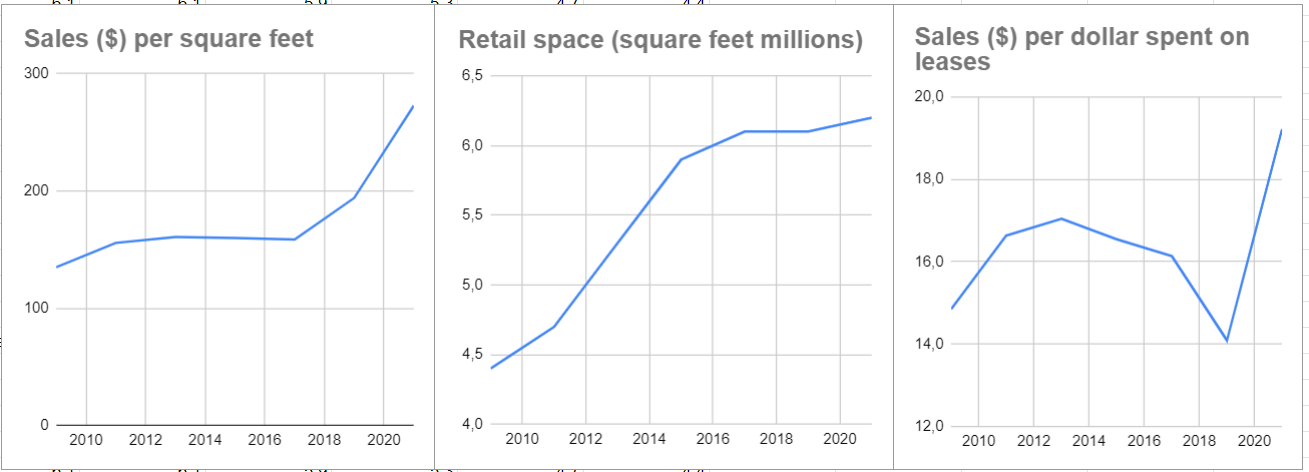
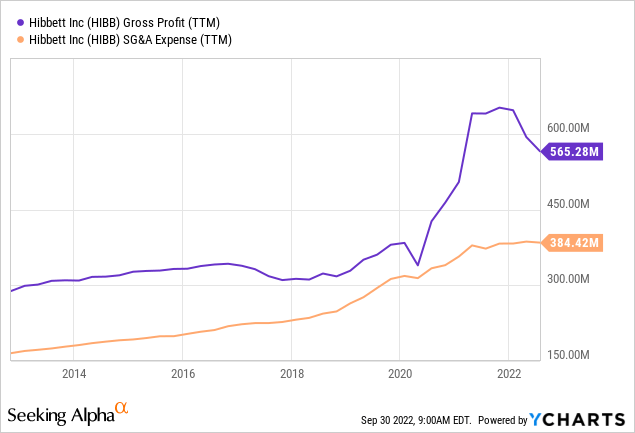
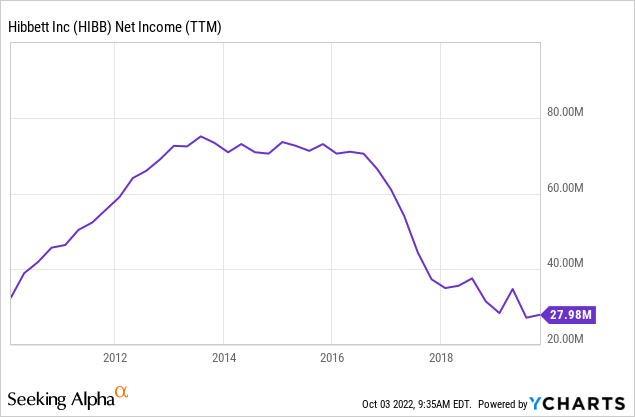
As we move down the income statement, SG&A expenses eat most gross profit increases. This is normal in most retail operations. Controlled SG&A expenses signal superior management and a more desirable company. The first chart below shows that the company’s operating margin shrank continuously between 2012 and 2020. SG&A expenses grew faster than gross profits. The result is a falling net income, as shown in the second chart below (ending in January 2020).
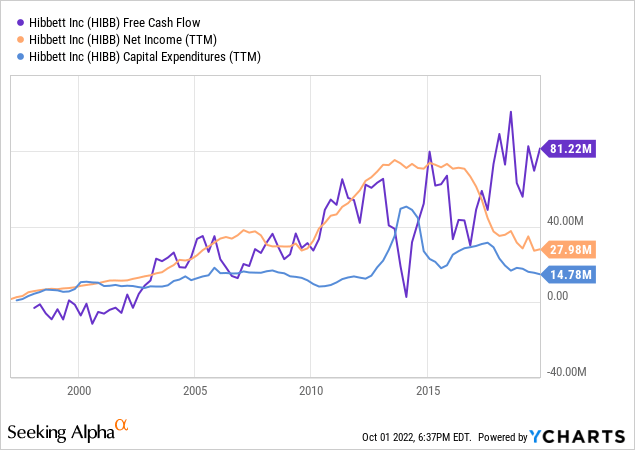
Finally on the historic side, the company had low investment requirements, besides SG&A and lease fixed costs. As the chart below shows (also ending in January 2020), FCF (free cash flow) followed net income quite closely for the past decade, varying more than the latter because of working capital changes. The company’s capital expenditures are concentrated on store remodeling and decoration and have been low except for particular strategic brand image changes that require higher CAPEX, like in 2014, or as we will see later, 2020 and 2021.
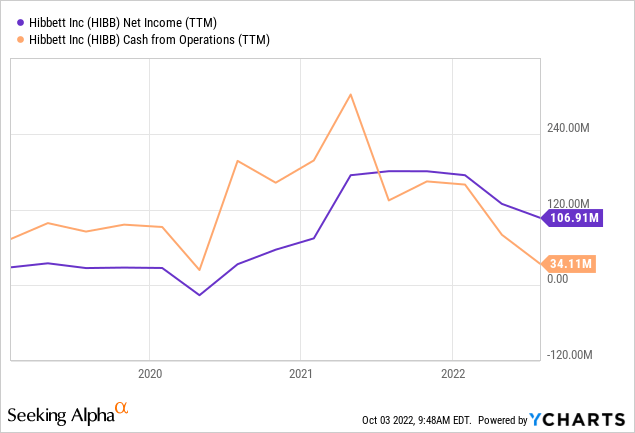
Moving closer to the present, when the pandemic-generated consumption boom impacted HIBB, the company’s profits exploded. Revenue per dollar spent on leases and revenue per dollar spent on SG&A both increased significantly, generating a lot of positive operational leverage.
Because of supply chain bottlenecks, extra demand was satisfied with inventories. That generated a lot of CFO (cash from operations) that later decreased as the company replenished its inventories.
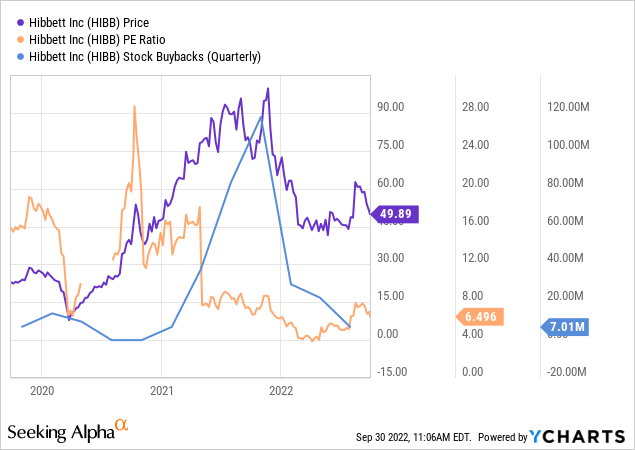
Most of that extra cash was used to repurchase shares. In 2021, HIBB repurchased almost $300 million of its own shares. Unfortunately, most of those shares were repurchased at all-time high prices. The average purchase price for 2021 was $78 per share. The company was only able to reduce its share count by 14%
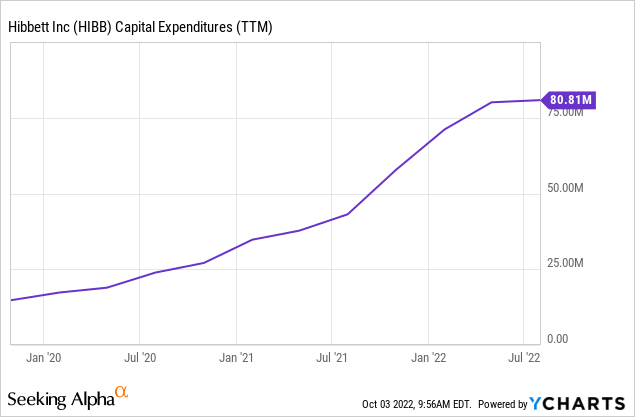
HIBB also increased CAPEX significantly. The company decided to remodel its stores, increasing capital expenditures to $70 million in both 2021 and 2022 from $15 million in 2019.
The resulting decrease in cash flows caused by higher capex and inventory rebuilding was financed by a credit line open for $125 million paying Bloomberg Short Term Bank Yield plus 1 percent (between 4% and 5% at current rates). As of 2Q22, HIBB had drawn $90 million from that facility and had record inventories of $370 million.
HIBB price considerations
I have commented that HIBB’s industry is not great. The company may have built a small niche by locating its stores in underserved communities, but the moat of that niche is low. A competitor only needs to open stores in the same areas to compete on substantially the same basis.
HIBB has not shown good management, either. Before the pandemic-induced demand boost, the company was losing profits because it was unable to keep SG&A costs in line. Management repurchased $300 million in all-time-high shares, and is heavily investing into a forecasted recession, showing low conservativeness.
Finally, the company has reduced its cash reserves and increased operational and financial leverage in a cloudy macroeconomic environment. In particular, as we will see below, the company’s operational leverage makes it very sensitive to small variations in demand.
These three considerations imply that HIBB is not an outstanding company in an outstanding expected context. Therefore, the investor should demand a significant promised return, or margin of safety, to compensate for the business’ subpar characteristics and context’s extra risks.
A short exercise can show the investor what kind of future is priced in HIBB’s stock. Assumptions are a gross margin of 37.5% (higher than shown above because lease costs are removed), yearly lease costs of $90 million, SG&A costs of $400 million, negligible interest costs and an income tax rate of 25%. The company currently has 6.3 million square foot of retail space.
The table below provides a comparison of different scenarios using the assumptions above.
HIBB’s profitability based on positive, base and negative scenarios (Own, based on HIBB’s filings with the SEC)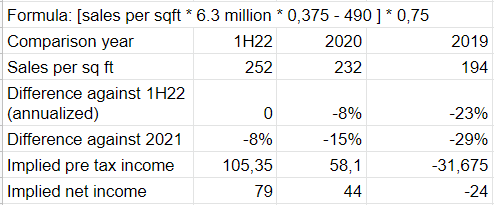
For example, if 2022 revenues stop falling against 2021 levels (what we could consider the optimistic scenario), then HIBB can generate $79 million in net income, or a current earnings yield of 12% on a $650 million market cap. The base scenario (2020 sales) shows the company’s sales per square foot falling 15% against 2021. This is what has been seen in 1H22 compared to 1H21 already. In that case the company would yield 7%. Finally a negative scenario, with revenues per square foot returning to 2019 levels, would imply a net loss of $24 million after taxes. This negative scenario would also imply that the company cannot repay its credit facility and therefore has to permanently carry debt.
Considering the less-than-ideal business and industry characteristics of HIBB, showing no bottom line growth, a return of 7% on the base scenario is too low, in my opinion. Even if the economy recovered and the company posted a 12% yield this year, the previous dynamics show that the return would decrease as the company piles up SG&A expenses.
Therefore, I do not consider HIBB interesting at this point. In the future, the most important developments to follow are revenue per square foot in the short-term and SG&A expenses to gross profits in the medium and long-term. In terms of price, ceteris paribus, I would reconsider HIBB below $30 a share.
Be the first to comment