

Lichtwolke/iStock via Getty Images
Introduction
U.S.-based independent oil and gas producer Hess Corporation (NYSE:HES) released its first-quarter 2022 results on April 27, 2022.
Important note: This article is an update of my article published on January 30, 2022. I have followed HES on Seeking Alpha since 2017, with 17 articles published and counting.
1 – 1Q22 results Snapshot
HES reported an adjusted first-quarter 2022 earnings per share of $1.30, beating again analysts’ expectations this quarter. It was a solid improvement from the year ago and sequentially.
HES Adjusted earnings Presentation (Hess Corporation)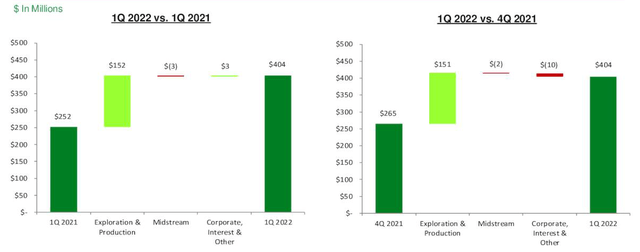
The quarterly revenues rose to $2,371 million from $1,919 million last year.
Production including Libya was 297K Boep/d in 1Q21.
HES 1Q22 Cash outflow Presentation (Hess Corporation)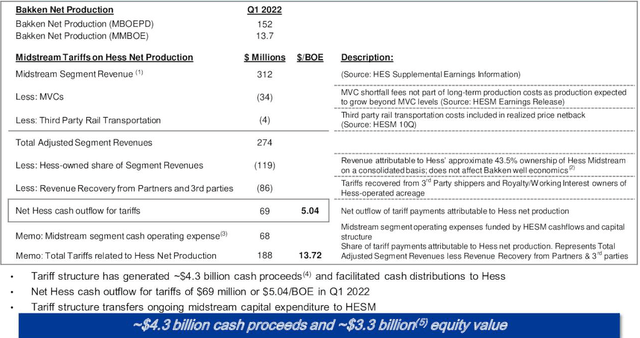
Note: For those interested in Midstream companies with solid dividend payout, I recommend Hess Midstream (NYSE: HESM), which increased its quarterly dividend to $0.55 per share, a yield of 7.80%.
HES should be considered an excellent long-term play in oil, mainly due to the potential for growth from the Stabroek block in Guyana.
2 – Stock Performance
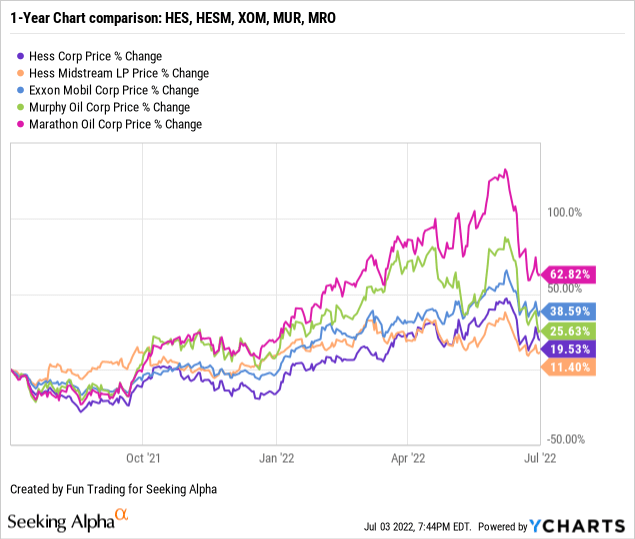
HES is doing quite well on a one-year basis despite correcting significantly in December 2021. The stock is now up 20% on a one-year basis. HES and HESM are underperforming their peers, as we can see below:
CEO John Hess said in the conference call:
In a world that will need reliable low-cost oil and gas resources now and for decades to come, Hess is in a very strong position, offering a differentiated value proposition. Our strategy is to deliver high-return resource growth, deliver a low cost of supply and deliver industry-leading cash flow growth
Hess Corp. 1Q22 Balance Sheet and Trend – The Raw Numbers
| Hess Energy | 1Q21 | 2Q21 | 3Q21 | 4Q21 | 1Q22 |
| Total Revenues and other in $ Billion | 1.92 | 1.60 | 1.81 | 2.26 | 2.37 |
| Net income available to common in $ Million | 252 | -73 | 115 | 265 | 417 |
| EBITDA $ Million | 972 | 647 | 804 | 1,087 | 1,162 |
| EPS diluted in $/share | 0.82 | -0.24 | 0.37 | 0.85 | 1.34 |
| Cash from operations in $ Million | 591 | 785 | 615 | 899 | -156 |
| Quarterly CapEx in $ Million | 385 | 355 | 498 | 509 | 546 |
| Free Cash Flow in $ Million | 206 | 430 | 117 | 390 | -702 |
| Cash and cash equivalent $ Billion | 1.87 | 2.43 | 2.42 | 2.71 | 1.37 |
| Long-term debt (consolidated) in $ Billion | 8.29 | 8.22 | 8.51 | 8.46 | 7.96* |
| Dividend per share in $ | 0.25 | 0.25 | 0.25 | 0.25 | 0.375 |
| Shares outstanding (diluted) in Million | 305.8 | 307.5 | 308.1 | 308.3 | 308.9 |
| Oil Production | 1Q21 | 2Q21 | 3Q21 | 4Q21 | 1Q22 |
| Oil Equivalent Production in K Boe/d | 333 | 328 | 284 | 316 | 297 |
| Global liquids price ($/b) | 50.02 | 59.79 | 63.17 | 71.04 | 86.75 |
| Global Natural gas price ($/M Btu) |
4.90 |
4.05 |
4.71 |
4.77 |
5.28 |
Source: Company material
* The debt is consolidated and includes $2.561 billion for the midstream on a non-recourse basis.
Analysis: Revenues, Generic Free Cash Flow, and Oil and Gas Production Worldwide
1 – Quarterly total revenues were $2,371 million in 1Q22
HES Quarterly revenues history (Fun Trading)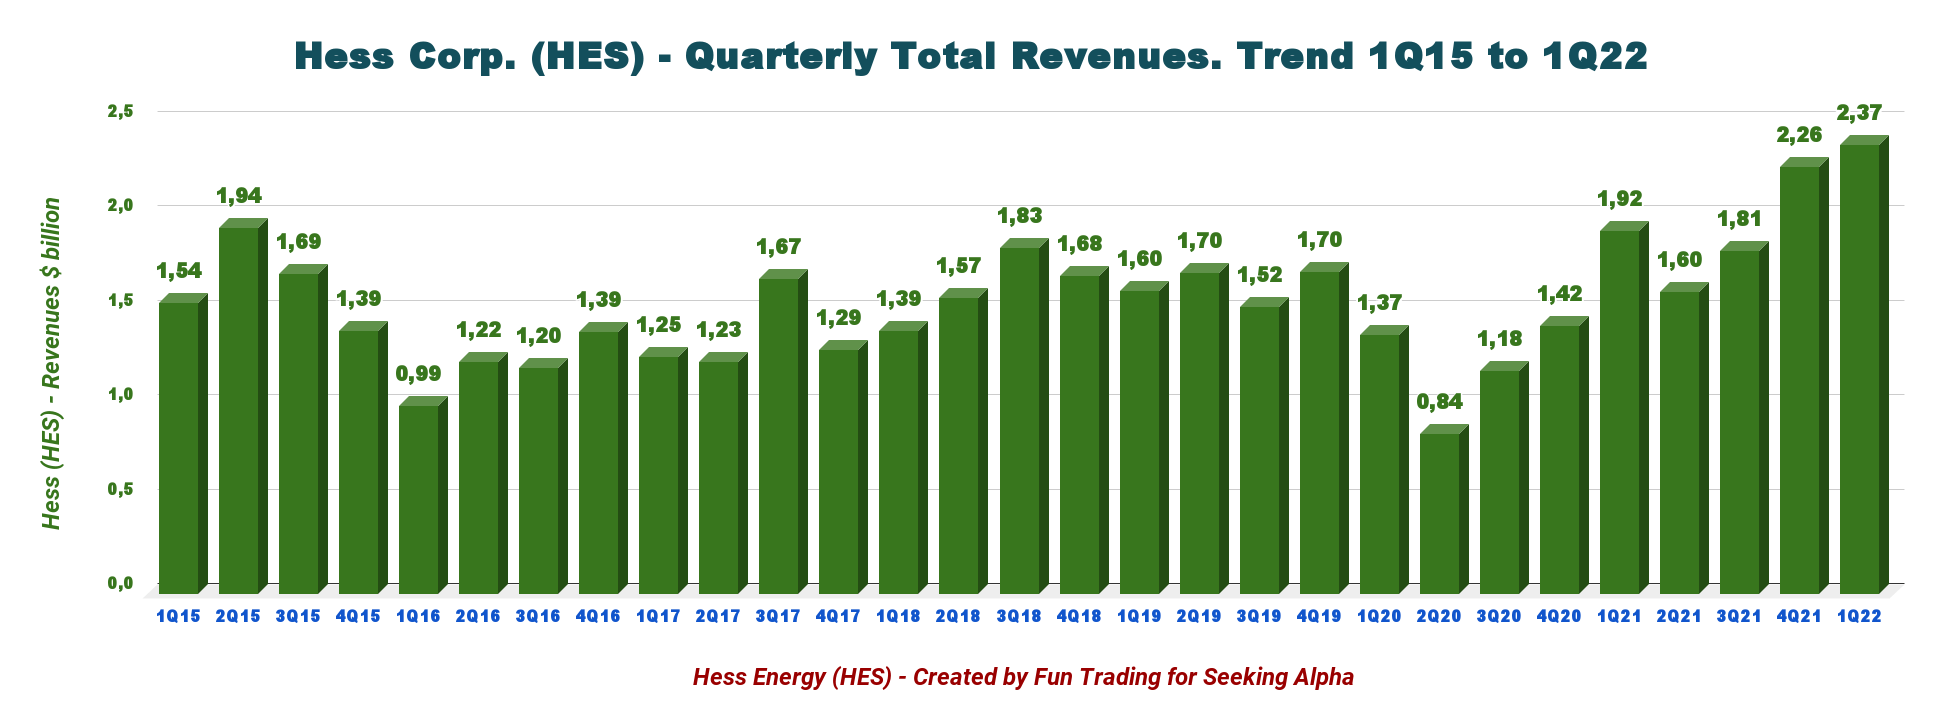
Hess’ revenues increased to $2,371 million in the first quarter of 2022 from $1,919 million in the same quarter a year ago. The quarterly income was $1.34 per diluted share compared to $0.82 per diluted share in 1Q21.
The adjusted net income was $404 million compared with an adjusted net income of $252 million in the prior-year quarter.
The midstream business generated adjusted net earnings of $74 million, up from $62 million a year ago on improvement in tariff rates and minimum volume commitments.
2 – Free cash flow (not including divestiture) and net debt
HES Quarterly Free cash flow history (Fun Trading)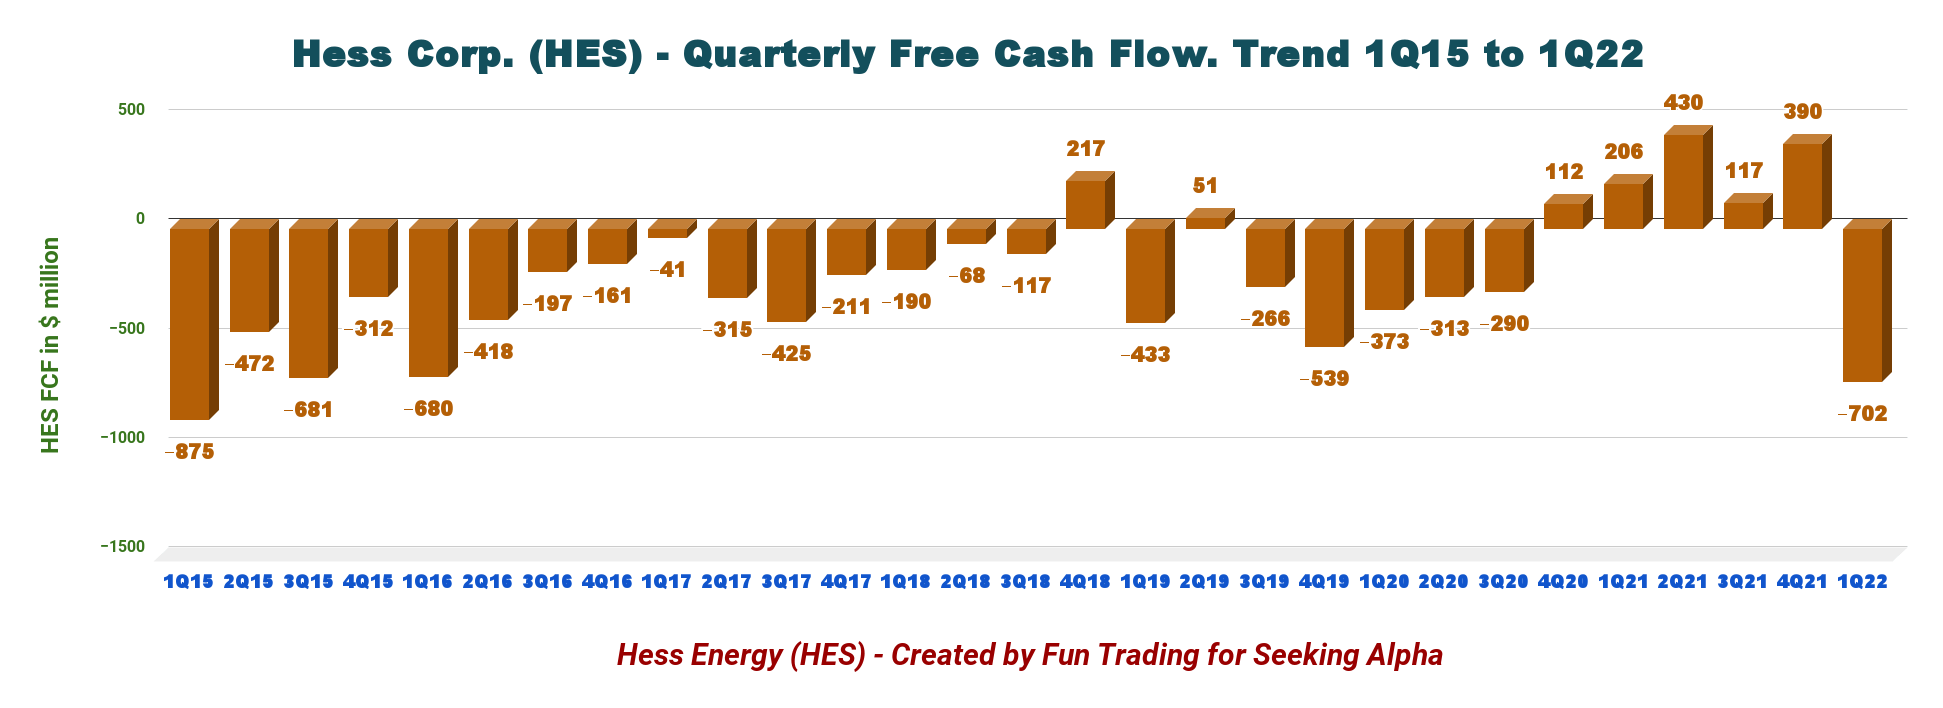
Note: The generic free cash flow is the cash flow from operation minus the CapEx.
HES’s trailing 12-month free cash flow is $235 million, with a loss of $702 million in 1Q22.
However, despite a low free cash flow annually, the company declared a quarterly dividend of $0.375 per share this quarter, representing an increase of 50% sequentially.
CEO John Hess said in the conference call:
Our balance sheet will also continue to strengthen in the coming years with debt-to-EBITDAX expected to decline from less than 2x in 2022 to under 1x in 2024. Our financial priorities are: first, to have a disciplined capital allocation process so that we invest only in high-return, low-cost opportunities; second, to maintain our investment-grade credit rating and have a strong cash position and balance sheet to ensure that we can fund our world-class investment opportunities in Guyana; and third, to return up to 75% of our annual free cash flow to shareholders.
The consolidated net debt (including the midstream) went slightly down to $5.395 billion this quarter.
HES Quarterly Cash versus Debt history (Fun Trading )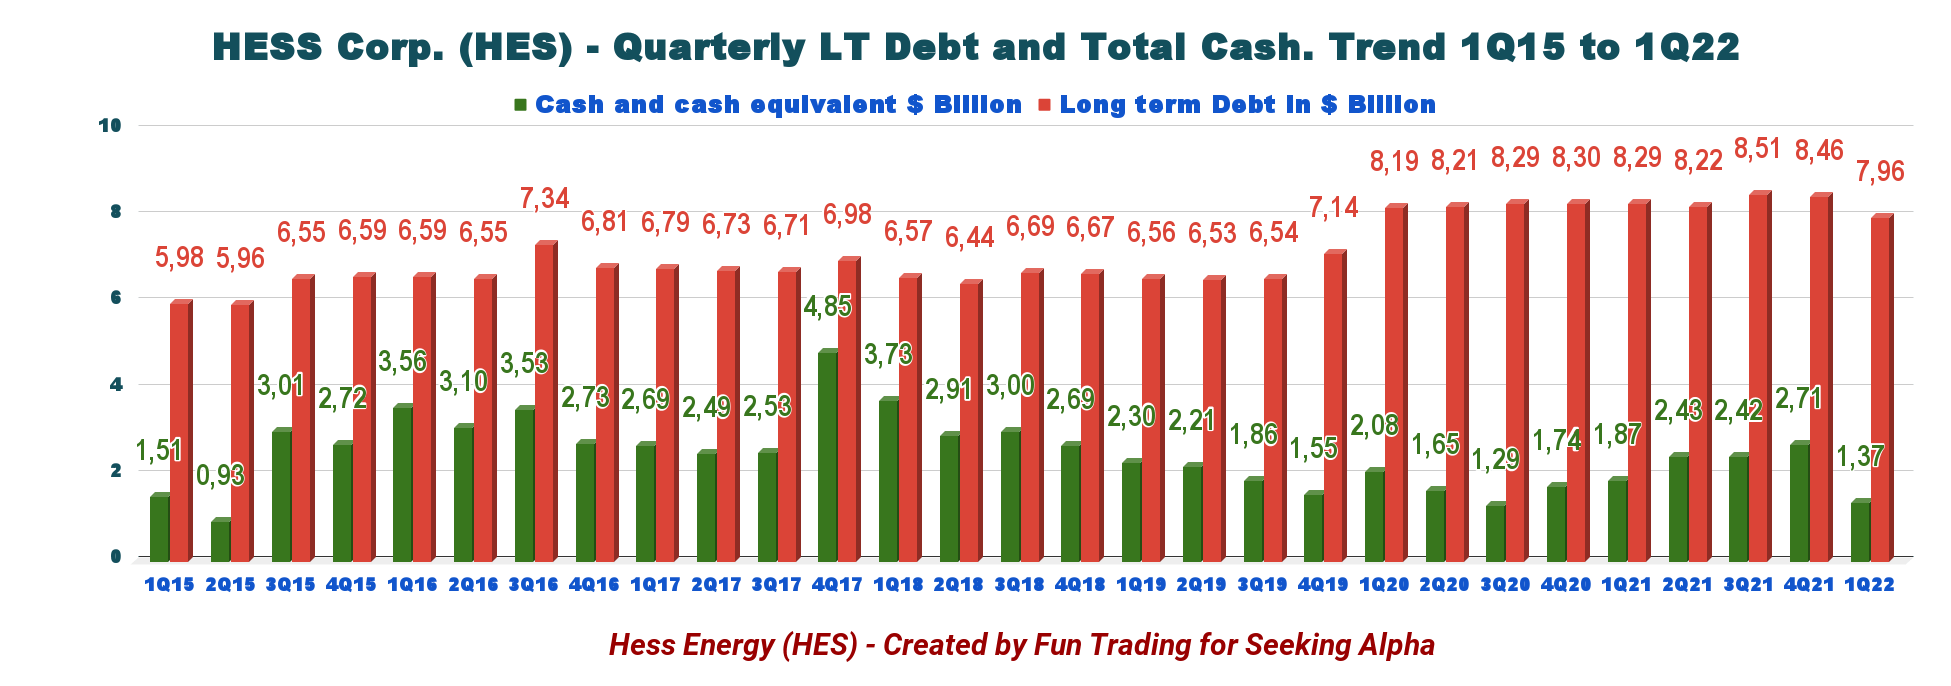
As of March 31, 2022, the company had $1,370 million in cash & cash equivalents, down from $2,713 million in the previous quarter. Its long-term debt was $7,956 million, down sequentially from $8,458 million. The current maturity of the long-term debt is $22 million.
The Debt to equity ratio in 1Q22 was 1.261, which is relatively high. The Corporation’s debt to capitalization ratio, as defined in its debt covenants, was 40.2% on March 31, 2022, and 42.3% on December 31, 2021.
The debt profile is improving but HES needs to cut its debt even more.
3 – Quarterly production analysis
3.1 – Oil equivalent Production
HES Quarterly production history (Fun Trading)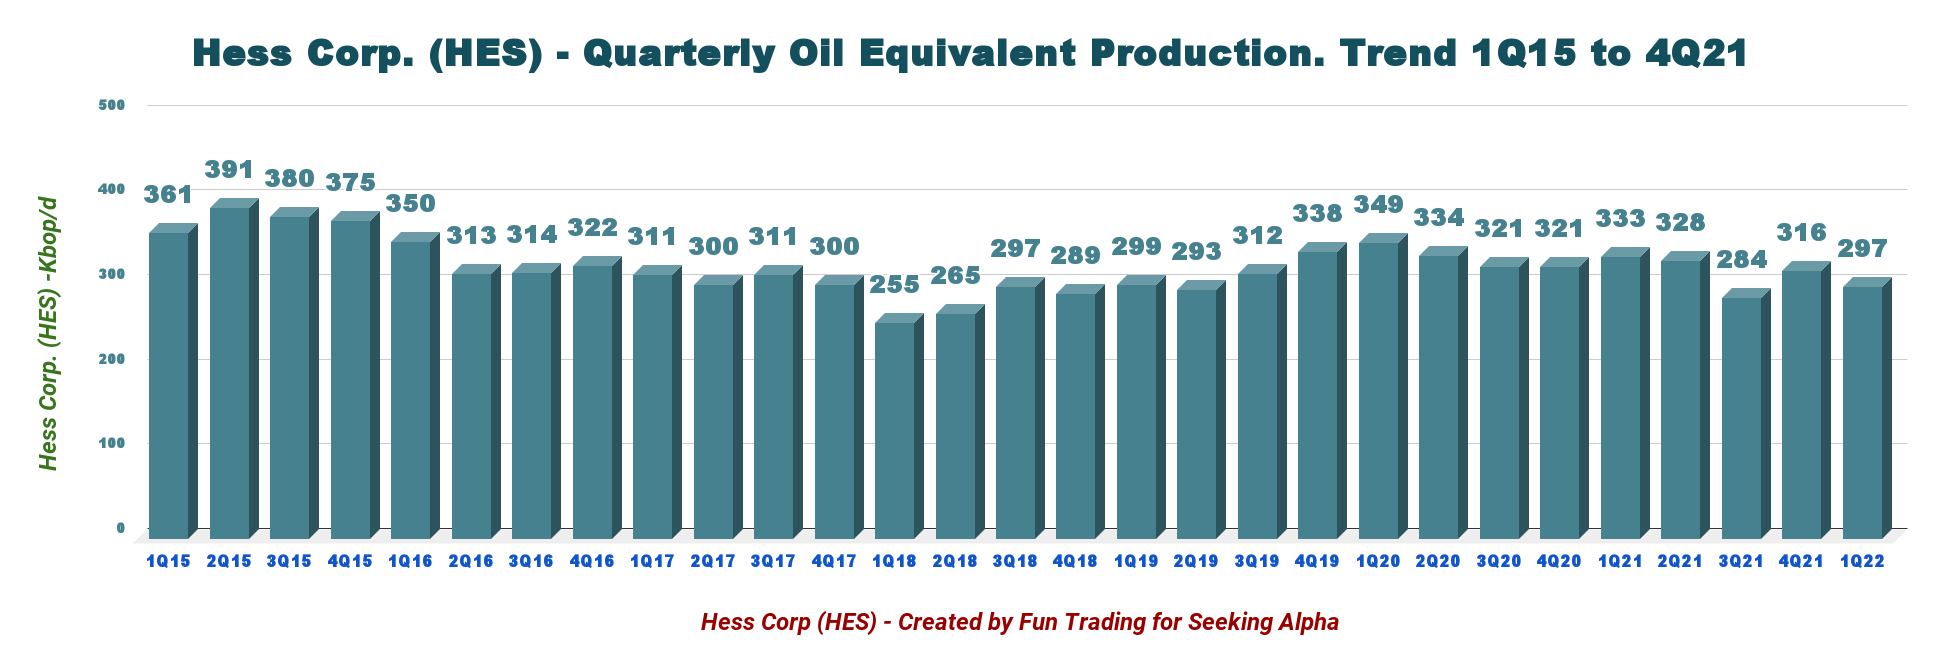
HES produced 297K net Boep/d in 1Q22 (including Libya). It was down 10.8% from the same quarter a year ago, with contributions from resources in the Bakken of 152K Boep/d this quarter. As we can see below, production was weaker sequentially.
HES Quarterly production per segment 4Q21 versus 1Q22 (Fun Trading)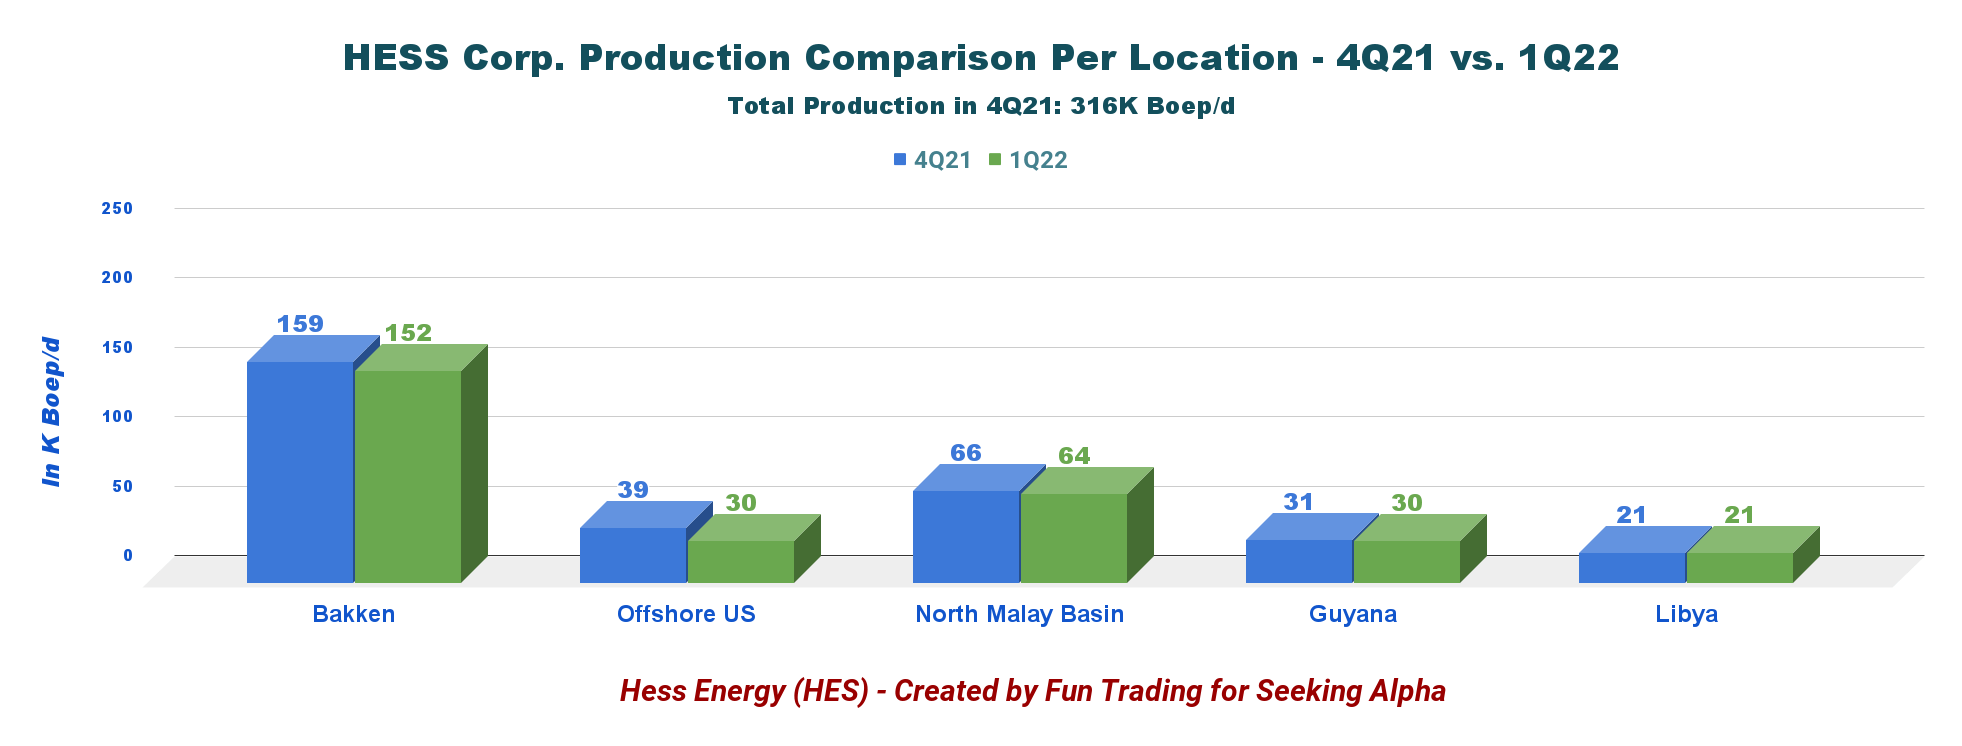
3.2 – Oil and Natural gas prices
Below are the historical trends of global liquid prices and NG prices.
HES Quarterly Oil and NG prices history (Fun Trading)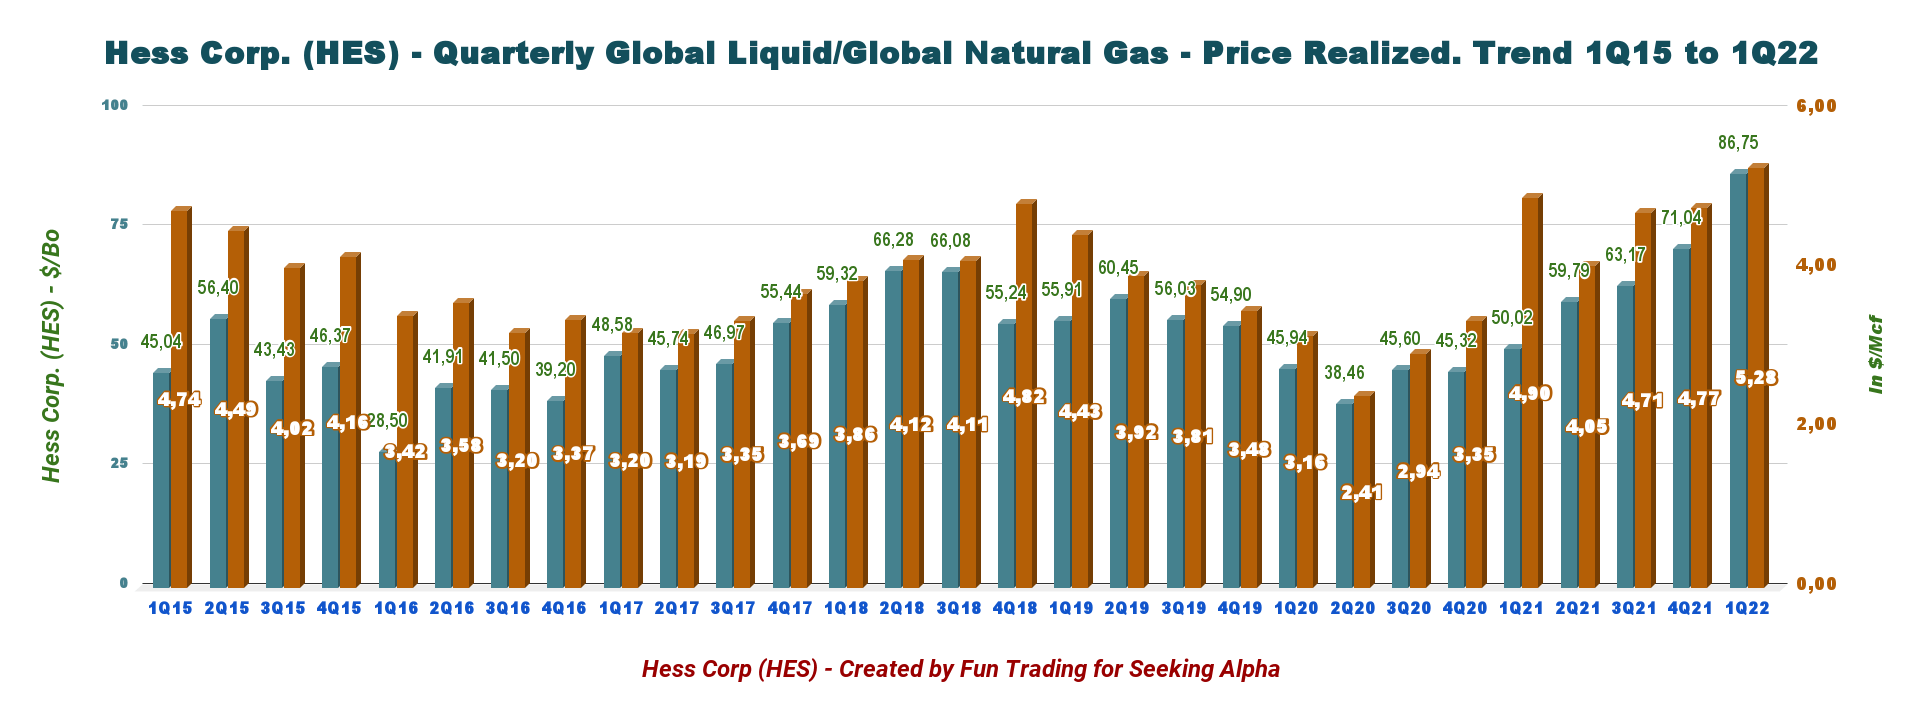
In 1Q22, the company sold its crude oil at an average price worldwide of $86.75 per barrel, including hedging, and $5.28 for natural gas.
Also, worldwide crude oil realization per barrel of $94.04 (excluding the impacts of hedging) significantly improved from $52.52 in the year-ago period.
Crude oil output was 151K Bop/d in the first quarter of 2022. Further, natural gas liquids production totaled 50K Bbls/d, and natural gas output was 96K Boep/d.
The Bakken production is by far the primary production for the company and will support the business while ramping up Guyana.
3.3 – Production per commodity. Oil represents 50.8% of the total oil equivalent in 1Q22.
HES Production details Oil, NGL, NG (Fun Trading )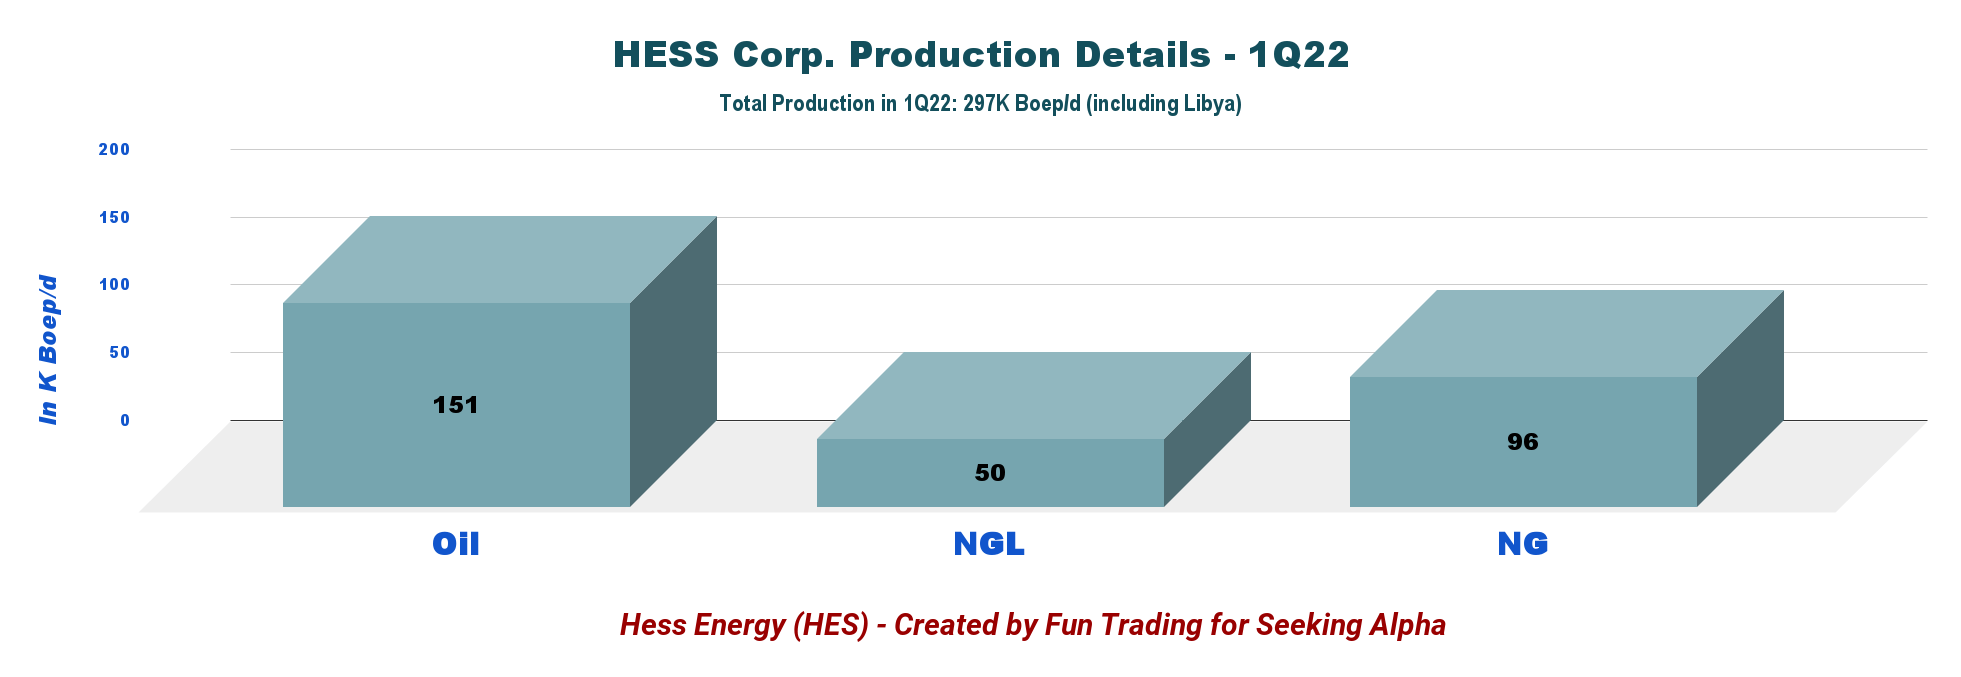
3.4 – Hedging
HES has hedged 150K Bop/d for 2022, 90K Bop/d at $60 per barrel WTI put options, and 60K Bop/d at $65 per barrel Brent put options.
In March, HES canceled the $100 WTI and $105 Brent call options that the company previously had set up. This decision was made given the high level of oil volatility experienced now due to the war in Ukraine.
3.5 – The Stabroek Prospect in Guyana. A crucial topic for HES.
It is a vital topic regarding the future of Hess Corporation. For those interested in starting a long-term position with HES, you can’t avoid this important subject that will shape the company’s future. The production attributed to HES was 30K Boep/d in 1Q22, and Hess Corp or 10% of the total quarterly output. HES expects about 60K-65K Boep/d in 2022.
CEO John Hess said in the conference call:
Key to our strategy is Guyana, the industry’s largest oil province discovered in the last decade. According to a study by Wood Mackenzie, Guyana is one of the highest-margin, lowest carbon intensity oil developments globally. As discussed earlier, the world will need these low-cost oil resources for decades to come to meet future energy demand. On the Stabroek Block in Guyana, where Hess has a 30% interest and ExxonMobil is the operator, a number of important milestones were recently achieved.
The Stabroek Block is operated by ExxonMobil’s subsidiary Esso Exploration and Production Guyana (“EEPGL”) with 45% interest. Hess Guyana Exploration and CNOOC Petroleum Guyana are the other partners in the block, with interests of 30% and 25%.
Exxon Mobil (XOM) now believe they have discovered massive reserves of at least 11 billion BOE, up from the previous estimate of more than 10 billion BOE.
The updated resource includes three new discoveries on the block at Barreleye, Lukanani, and Patwa, in addition to the Fangtooth and Lau Lau discoveries announced on January 5, 2022.
- The Liza Phase 1 development is producing 130K Bop/d, and following production optimization work on the Liza Destiny FPSO, the company expects more than 140K Bop/d in 2Q22.
- The Liza Phase 2 is ramping up and achieved its first oil in February 2022. The 3Q22 expects a total gross production capacity of 220K Bop/d.
- The Payara field will also produce 220K Bop/d, with a start-up scheduled in late 2023.
- The Yellowtail project comprises the development of the Yellowtail and Redtail fields and will be the biggest oil producer with 250K Bop/d. Production is scheduled to begin in 2025. Finally, in April 2022, Exxon Mobil announced the sanction of the Yellowtail development after receiving government and regulatory approvals.
It is a gross production of 830K Bop/d by 2025 or 249K Bop/d for HES, representing 84% of the output of the first quarter. It is not the end of the story.
CEO John Hess said in the conference call:
We continue to see the potential for at least 6 floating production storage and offloading vessels, or FPSOs, on the block in 2027 with a production capacity of more than 1 million gross barrels of oil per day and up to 10 FPSOs to develop the discovered resources on the block.
2022 Guidance
Guidance has been slightly lowered this quarter. For 2022, Hess projects net production (excluding Libya) of 325K-330K Boep/d. Net Bakken production is expected to be 160K-165K Boep/d. The company expects E&P CapEx to be $2.6 billion, 80% of which will be allocated to Guyana and the Bakken Shale Play.
HES 2022 Guidance Presentation (Hess Corporation)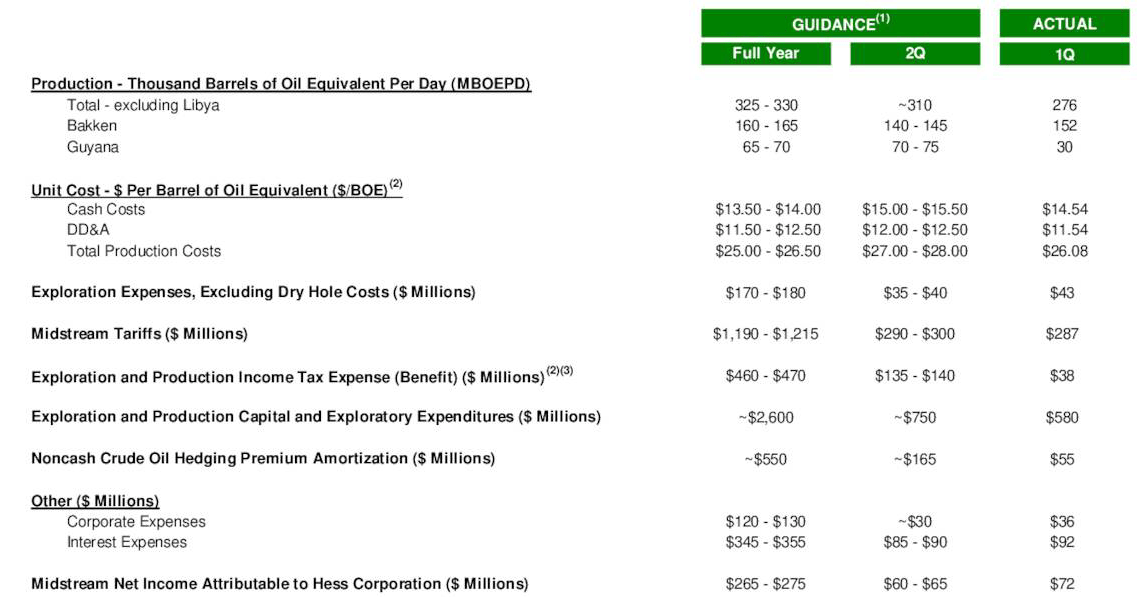
4 – Midstream
The company posted adjusted net earnings of $72 million in 1Q22, down from $75 million a year ago on the gain in tariff rates and minimum volume commitments.
HES Midstream presentation (Hess corporation)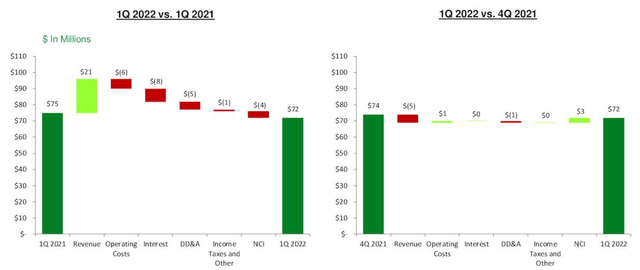
This quarter, Hess received $346 million in net proceeds following Hess Midstream LP’s two transactions.
- First, Hess Midstream completed a public offering of about 10.2 million HESM Class a shares held by Hess Corporation and Global Infrastructure Partners. HES received net proceeds of $146 million from the public offering.
- Also, a consolidated subsidiary of HESM repurchased 13.6 million HESM Opco Class B from Hess Corporation and Global Infrastructure Partners for $400 million, of which the Corporation received a net of $200 million.
Note: The Corporation owns approximately 41% of HESM on a consolidated basis
Technical Analysis and Commentary
HES TA Chart short-term (Fun Trading)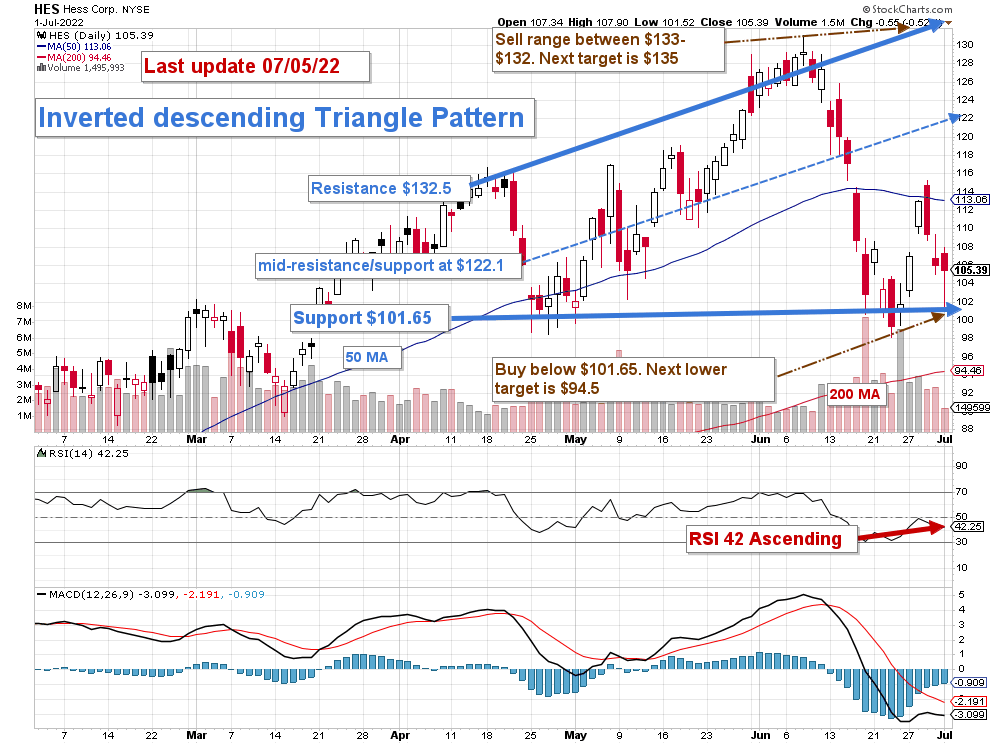
Note: the chart has been adjusted for the dividend.
HES forms an inverted descending triangle pattern with resistance at $132.5 and support at $101.65. This pattern doesn’t happen very often.
The short-term strategy is regularly trading LIFO at about 30%-35% of your position. I recommend taking profits between $132 and $133 with potential higher resistance at $135. Conversely, I recommend buying at $101.65 with possible lower support at $94.5, which is the 200MA.
However, this simple short-term strategy will have to be adjusted depending on the situation in Ukraine and the growing risk of inflation that will significantly affect the oil stocks, which have been overheating over the past few months and may have started to retrace gradually.
Watch oil prices like a hawk.
Note: The LIFO method is prohibited under International Financial Reporting Standards (IFRS), though it is permitted in the United States to generally accepted accounting principles (GAAP). Therefore, only US traders can apply this method. Those who cannot trade LIFO can use an alternative by setting two different accounts for the same stocks, one for the long term and one for short-term trading.
Warning: The TA chart must be updated frequently to be relevant. It is what I am doing in my stock tracker. The chart above has a possible validity of about a week. Remember, the TA chart is a tool only to help you adopt the right strategy. It is not a way to foresee the future. No one and nothing can.
Author’s note: If you find value in this article and would like to encourage such continued efforts, please click the “Like” button below as a vote of support. Thanks.
Be the first to comment