


july7th/E+ via Getty Images
Moderate loan growth will help the earnings of Heritage Financial Corporation (NASDAQ:HFWA) recover this year. Further, the margin will continue to expand, albeit at a slower pace. Overall, I’m expecting Heritage Financial to report earnings of $2.59 per share for 2023, up 13% from my estimated earnings of $2.29 per share for 2022. The December 2023 target price suggests a moderate upside from the current market price. Based on the total expected return, I’m adopting a buy rating on Heritage Financial Corporation.
Margin Expansion to Slow Down
Heritage Financial Corporation’s net interest margin expanded by 53 basis points in the third quarter and 20 basis points in the second quarter of 2022. Going forward, the expansion will slow down because the catalysts that drove the margin will not work as well in the future. Firstly, the rate of Fed Funds rate hikes will slow down, as indicated by Fed’s projections.
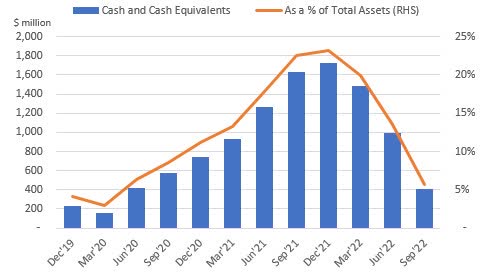
Further, the recent net interest margin growth was partly attributable to the deployment of excess cash into higher-yielding assets. As the cash balance is now almost back to normal, this factor will no longer drive the margin in upcoming quarters.
SEC Filings
The margin expansion was also partly attributable to sticky deposit costs. Heritage Financial reported an average deposit cost of only 0.15% in the third quarter of 2022, which was unchanged from a year ago period. To recall, the Fed funds rate had increased by 300 basis points in the 12 months ended September 30, 2022. The management mentioned in the conference call that it was working with customers on rates to maintain relationships. Further, it had already raised some of its deposit rates at the beginning of the fourth quarter, as mentioned in the conference call. As a result, the deposit cost is likely to surge in upcoming quarters.
The management’s simulation model showed at the end of December 2021 that a 200-basis point hike in rates could boost the net interest income by 22.4% in the first year and 30.1% in the second year of the rate hike, as mentioned in the 10-K filing for 2021. (Note: the management has not provided quarterly updates).
Considering these factors, I’m expecting the margin to have increased by ten basis points in the last quarter of 2022. Moreover, I’m expecting the margin to grow by another ten basis points in 2023.
Economic Factors Provide a Mixed Loan Outlook
Heritage Financial Corporation’s loan growth continued to accelerate in the third quarter. The portfolio grew by 3.3% during the quarter, or 13% annualized. Currently, economic factors present a mixed outlook for future loan growth. Firstly, high-interest rates are bound to temper loan demand.
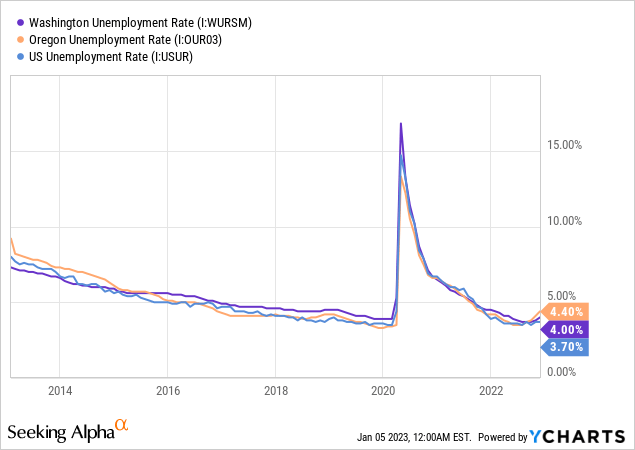
On the other hand, job markets present a better outlook. Heritage Financial Corporation’s operations are concentrated in the metropolitan areas of Washington and Oregon. Although both states currently have unemployment rates that are worse than the national average, their unemployment rates are quite low when viewed from a historical perspective.
The coincident economic activity index provides an even better outlook for loan demand. As shown below, the economic activity trendlines for both Washington and Oregon are currently steeper than the national average.
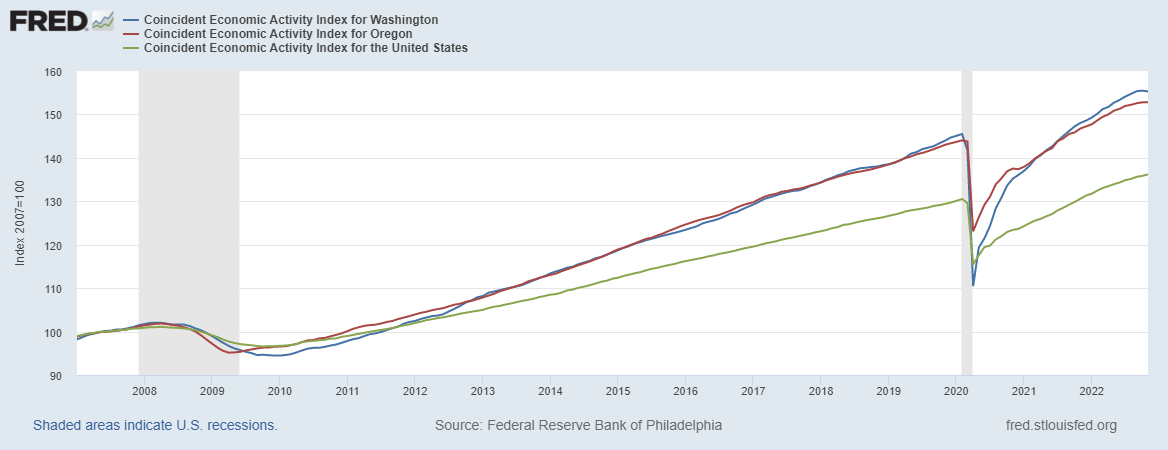
The Federal Reserve Bank of Philadelphia
Considering these factors, I’m expecting the loan portfolio to have grown by 1.5% in the last quarter of 2022, taking full-year loan growth to 6.5%. For 2023, I’m expecting the loan portfolio to grow by 6.1%. Further, I’m expecting deposits to grow in line with loans. The following table shows my balance sheet estimates.
| Financial Position | FY18 | FY19 | FY20 | FY21 | FY22E | FY23E |
| Net Loans | 3,619 | 3,732 | 4,398 | 3,773 | 4,019 | 4,265 |
| Growth of Net Loans | 28.5% | 3.1% | 17.9% | (14.2)% | 6.5% | 6.1% |
| Other Earning Assets | 1,047 | 1,091 | 1,458 | 2,941 | 2,455 | 2,529 |
| Deposits | 4,432 | 4,583 | 5,598 | 6,394 | 6,331 | 6,720 |
| Borrowings and Sub-Debt | 52 | 41 | 57 | 72 | 62 | 64 |
| Common equity | 761 | 809 | 820 | 854 | 854 | 916 |
| Book Value Per Share ($) | 21.5 | 21.9 | 22.7 | 23.8 | 24.1 | 25.8 |
| Tangible BVPS ($) | 14.1 | 14.9 | 15.7 | 16.8 | 17.3 | 19.0 |
| Source: SEC Filings, Author’s Estimates(In USD million unless otherwise specified) | ||||||
Expecting Earnings to Increase by 13% in 2023
After falling in 2022, earnings will likely recover this year on the back of moderate loan growth and margin expansion. Meanwhile, the provisioning for expected loan losses will likely remain at a normal level. I’m expecting the net provision expense to make up around 0.14% of total loans in 2023, which is the same as the average from 2017 to 2019.
Overall, I’m expecting Heritage Financial to report earnings of $2.29 per share for 2022, down 16% year-over-year. For 2023, I’m expecting earnings to grow by 13% to $2.59 per share. The following table shows my income statement estimates.
| Income Statement | FY18 | FY19 | FY20 | FY21 | FY22E | FY23E |
| Net interest income | 187 | 200 | 201 | 206 | 217 | 256 |
| Provision for loan losses | 5 | 4 | 36 | (29) | (1) | 6 |
| Non-interest income | 32 | 32 | 37 | 35 | 30 | 30 |
| Non-interest expense | 149 | 147 | 149 | 149 | 151 | 168 |
| Net income – Common Sh. | 53 | 68 | 47 | 98 | 81 | 92 |
| EPS – Diluted ($) | 1.49 | 1.83 | 1.29 | 2.73 | 2.29 | 2.59 |
| Source: SEC Filings, Earnings Releases, Author’s Estimates(In USD million unless otherwise specified) | ||||||
My estimates are based on certain macroeconomic assumptions that may not come to fruition. Therefore, actual earnings can differ materially from my estimates.
Moderate Total Expected Return Calls for a Buy Rating
Heritage Financial is offering a dividend yield of 2.7% at the current quarterly dividend rate of $0.21 per share. The earnings and dividend estimates suggest a payout ratio of 32% for 2023, which is below the five-year average of 46%. Therefore, there is room for a dividend hike. Nevertheless, I’m not assuming an increase in the dividend level to remain on the safe side.
I’m using the historical price-to-tangible book (“P/TB”) and price-to-earnings (“P/E”) multiples to value Heritage Financial Corporation. The stock has traded at an average P/TB ratio of 1.62 in the past, as shown below.
| FY19 | FY20 | FY21 | Average | |||
| T. Book Value per Share ($) | 14.9 | 15.7 | 16.8 | |||
| Average Market Price ($) | 29.1 | 21.4 | 25.7 | |||
| Historical P/TB | 1.95x | 1.36x | 1.53x | 1.62x | ||
| Source: Company Financials, Yahoo Finance, Author’s Estimates | ||||||
Multiplying the average P/TB multiple with the forecast tangible book value per share of $19.0 gives a target price of $30.8 for the end of 2023. This price target implies a 0.6% upside from the January 4 closing price. The following table shows the sensitivity of the target price to the P/TB ratio.
| P/TB Multiple | 1.42x | 1.52x | 1.62x | 1.72x | 1.82x |
| TBVPS – Dec 2023 ($) | 19.0 | 19.0 | 19.0 | 19.0 | 19.0 |
| Target Price ($) | 27.0 | 28.9 | 30.8 | 32.7 | 34.6 |
| Market Price ($) | 30.6 | 30.6 | 30.6 | 30.6 | 30.6 |
| Upside/(Downside) | (11.8)% | (5.6)% | 0.6% | 6.8% | 13.0% |
| Source: Author’s Estimates |
The stock has traded at an average P/E ratio of around 14.0x in the past, as shown below.
| FY19 | FY20 | FY21 | Average | |||
| Earnings per Share ($) | 1.83 | 1.29 | 2.73 | |||
| Average Market Price ($) | 29.1 | 21.4 | 25.7 | |||
| Historical P/E | 16.0x | 16.6x | 9.4x | 14.0x | ||
| Source: Company Financials, Yahoo Finance, Author’s Estimates | ||||||
Multiplying the average P/E multiple with the forecast earnings per share of $2.59 gives a target price of $36.3 for the end of 2023. This price target implies an 18.5% upside from the January 4 closing price. The following table shows the sensitivity of the target price to the P/E ratio.
| P/E Multiple | 12.0x | 13.0x | 14.0x | 15.0x | 16.0x |
| EPS 2023 ($) | 2.59 | 2.59 | 2.59 | 2.59 | 2.59 |
| Target Price ($) | 31.1 | 33.7 | 36.3 | 38.9 | 41.4 |
| Market Price ($) | 30.6 | 30.6 | 30.6 | 30.6 | 30.6 |
| Upside/(Downside) | 1.6% | 10.1% | 18.5% | 27.0% | 35.4% |
| Source: Author’s Estimates |
Equally weighting the target prices from the two valuation methods gives a combined target price of $33.5, which implies a 9.6% upside from the current market price. Adding the forward dividend yield gives a total expected return of 12.3%. Hence, I’m adopting a buy rating on Heritage Financial Corporation.
Be the first to comment