

BrilliantEye/iStock via Getty Images
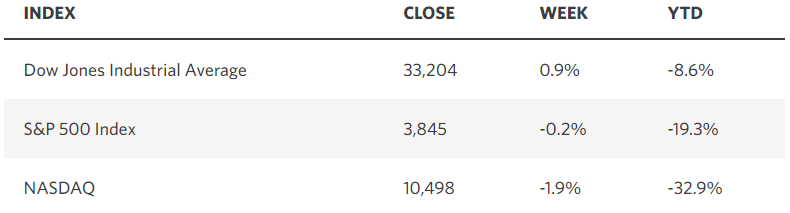
During a third consecutive week of declines for the major market averages stock funds suffered record outflows of $42 billion to cap off what looks to be the worst year for the stock market since 2008. Although stocks rallied on Friday to start the historically favorable period that includes the last five trading days of this year and the first two of next year. The S&P 500 has averaged a 1.3% gain during this seven-trading-day stretch going back to 1950, which is otherwise known as the Santa Claus Rally. The rally has meaning beyond the gain, provided it happens, because its occurrence tends to bode well for the month of January and the rest of the year. It looks like day two of this stretch is starting off on the right foot.
Yahoo Finance Edward Jones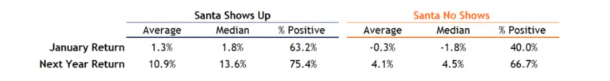
Sparking Friday’s gains was a report showing consumer spending during November continued to slow to just 0.1%, which was driven by a 0.7% increase in services spending, while spending on durable goods fell 2.3%. We have yet to fully return to a pre-pandemic normal, but we are getting closer, as the extremes on both ends of year-over-year personal consumption expenditures move further behind us.
Briefing.com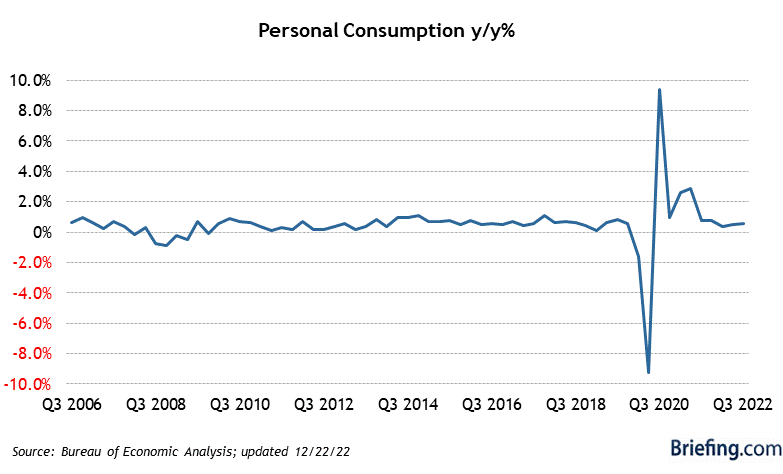
A slowing but still positive rate of growth is what will strengthen the soft landing narrative, as the rate of inflation continues to fall, which it did again in November. The Fed’s preferred measure of inflation fell to its lowest annual increase in over a year, while consumers’ year-ahead expectations for inflation fell to the lowest level since June 2021. This is phenomenal progress in light of the fact that the unemployment rate still hovers near record lows and wage gains remain robust.
Bloomberg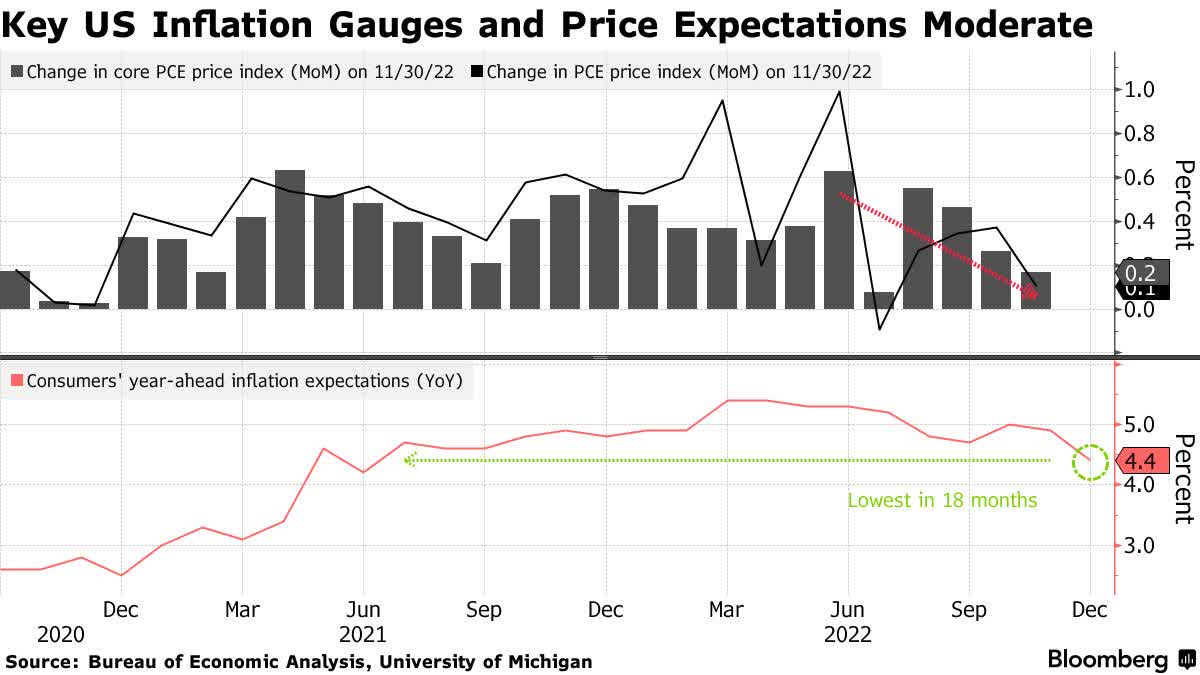
The high-frequency data of late suggests we will see another month of progress when December’s numbers are reported in late January. That is reflected in the Cleveland Fed’s Inflation Nowcasting model, which sees the core Personal Consumption Expenditures (PCE) price index falling from 4.7% to 4.5% to finish the year. Meanwhile, the Fed just increased its estimate of where this inflation gauge will finish the year to 4.8% in its Summary of Economic Projections.
Cleveland Fed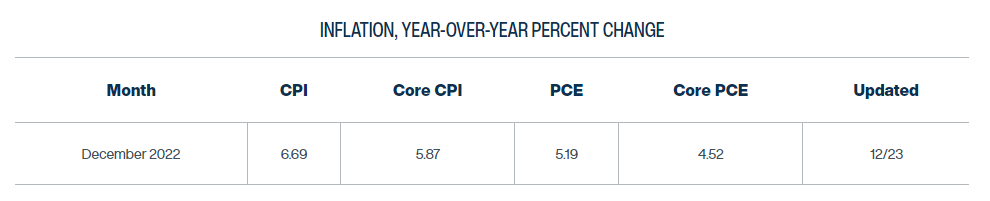
That differential will have to be addressed at the Fed’s next scheduled meeting on February 1, because it shows that the Fed is ahead of schedule in its economic projections. At a minimum, it should force members to lower their expectations for the terminal Fed funds rate. At best, the Fed will end its rate-hike campaign. The market will likely be the ultimate arbiter, as the Fed typically follows the market’s lead on policy.
On that front, the market is telling me that we do not need any more rate hikes, and that the Fed’s next move should be to cut rates in 2023. The chart below shows the Fed Funds rate from 1985-2019 in red and the difference between the Fed Funds rate and 2-year Treasury yields in blue. When the blue line rises above zero (black axis) it indicates that the Fed Funds rate is above the 2-year yield, as it was last week.
DataTrek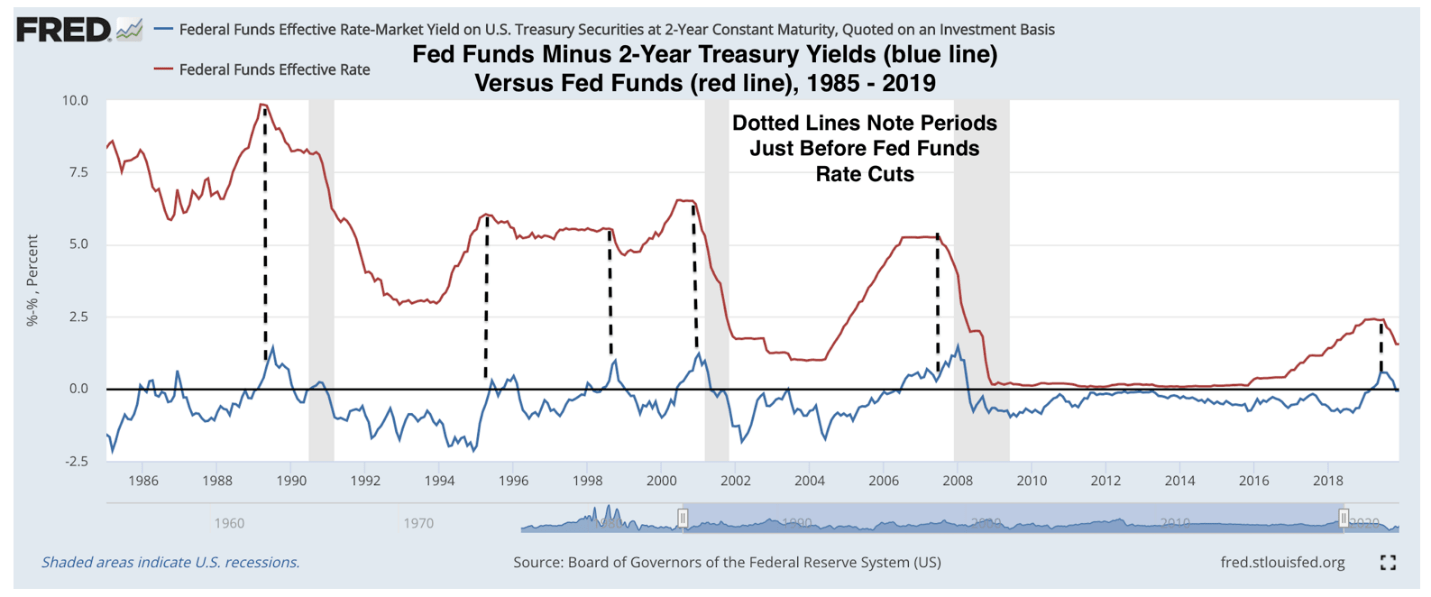
When this has occurred in the past, the Fed’s next move has been to lower rates. It indicates that the Fed has become overly restrictive. The one exception was in 1986. At the moment, the inversion has been just 5-10 basis points at most. If it becomes larger, it should become a more reliable indicator. The key will be to see the 2-year yield decline between now and the end of January. First things first-let’s get this Santa Claus Rally underway.
Lots of services offer investment ideas, but few offer a comprehensive top-down investment strategy that helps you tactically shift your asset allocation between offense and defense. That is how The Portfolio Architect compliments other services that focus on the bottom-ups security analysis of REITs, CEFs, ETFs, dividend-paying stocks and other securities.
Be the first to comment