

Abu Hanifah/iStock via Getty Images
Investment summary
Since we last reported on HealthEquity, Inc. (NASDAQ:HQY), our neutral thesis remains unchanged heading into its next quarterly earnings report. Last time, we noted several headwinds in the investment debate that kept us at a hold, ranging from valuation to lack of profitability and EPS upside ahead. Despite its recent developments, which are certainly noted, there are numerous questions that we believe need answering from HealthEquity, Inc.’s next set of numbers.
Alas, with the company set to report on 6 December, we’re back here today to summarize our position on HealthEquity, Inc. stock, and re-evaluate where things stand heading into the print. From our findings today, we retain our neutral thesis and valuation on HealthEquity, Inc., and look forward to providing additional coverage following HQY’s earnings next week.
Recent developments leading into next quarterly numbers
As a positive, with respect to its health savings account (“HSA”) segment, HQY was ranked “[number 1] in market share in a new independent report, capping 20 years of market-leading innovation and service” on November 1.
According to the release, the accolade was awarded by Devenir, an independent investment advisor and consultant. It identified HQY as the industry leader in both HSA assets and accounts.
Devenir is worth listening to on the subject matter as well – its been actively monitoring HSA market data for more than 10 years. Specifically, the report said HQY reported 7.5mm HSA’s and $20.5Bn in HSA assets for Q2 FY22. This represented a growth of 26–33% over the 12 months to July 31, 2022.
In response, HQY said it will release a new, 16th edition of “The Complete HSA Guidebook.” The resource is defined as “the definitive resource for benefits, investment and insurance professionals as well as individual consumers seeking clear and accurate information on HSAs.”
This is no doubt a positive in the HQY narrative, well-supported by credible investment personnel in the field. We believe this is something to take note of looking ahead, particularly the growth numbers in HQY’s HSA assets.
HQY Q3 earnings preview: Benchmarks to compare
In our last publication, we covered HQY’s Q2 FY22 earnings in great detail [note, for HQY, this was actually its Q1 FY23 period. This corresponds with Q2 FY22, and so from hereon in, so as to avoid any confusion, we’ll be talking in terms of the FY2022 year, ending December this year].
We had commented on several headwinds the company faced, including lower custodial yield and higher than expected labor costs. Moreover, we noted the company’s production of net operating profit after tax (“NOPAT”) from the amount of invested capital made each quarter from FY16 [see: previous publication – “Exhibit 4: Return on investment (NOPAT from invested capital) has narrowed sequentially].” Specifically, we said: “Even when backing out the pre-2019 period, HQY’s return on investment has remained steady and shown no signs of ticking upward.“
Leading into the next quarter, we decided to investigate this further to benchmark HQY when it presents its numbers on December 6th, 2022.
You can see in Exhibit 1 that HQY’s return on invested capital (“ROIC”) has narrowed substantially from highs in FY19, as mentioned. At the same time, it’s experienced a cyclical period of free cash flow (“FCF”) outflows.
In our opinion, this is an unhealthy combination, as we’d ideally see ROIC ratcheting upward with the FCF outflows. This would imply the cash is being invested wisely.
Since this isn’t the case, we continue to believe this is a risk factor in the HQY investment debate. We immediately question how HQY intends to create future economic value with these low FCF and ROIC prints.
Exhibit 1. ROIC and FCF coupling both remain in the red heading into HQY’s Q3 FY22 numbers
Data: HB Insights, HQY SEC Filings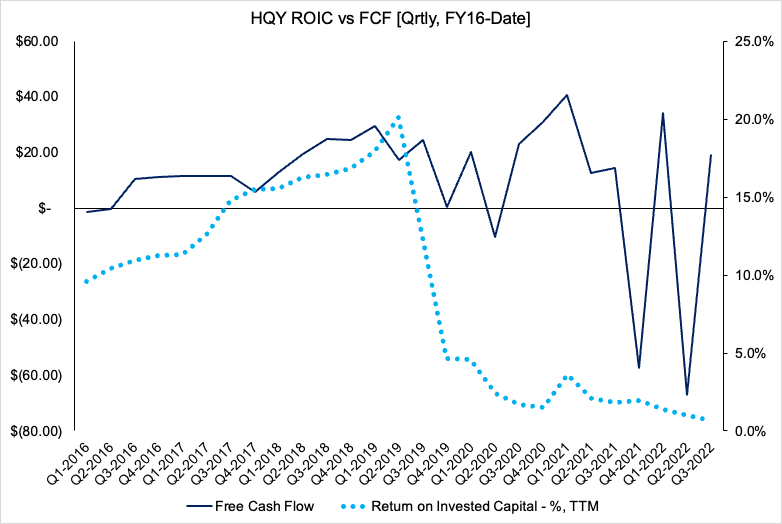
Given the data above, we decided to check where the value erosion is stemming from. We often perform this analysis when we notice FCF and ROIC trending lower over time.
You can observe in Exhibit 2, that the two sub-components of ROIC – NOPAT margin and invested capital turnover – have treaded lower since FY18 highs.
This tells us two things. First, it shows management have been less actively investing capital into its business growth each quarter. It also suggests that profitability per unit of revenue is lower, when measured in NOPAT terms. By the way, ROIC also has a specific link to growth, in that it is the maximum supportable growth rate of the company, without the use of leverage. This is a further headwind for HQY in our estimation.
Exhibit 2. We see both drivers of return on investment have tightened since FY18 highs
Data: HB Insights, HQY SEC Filings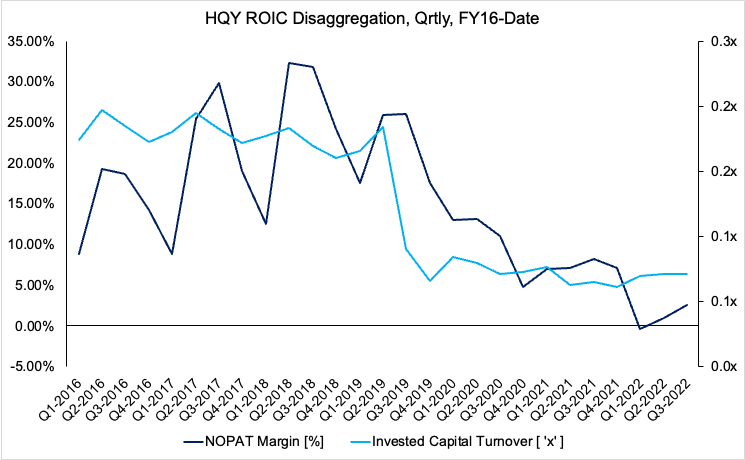
Extending the analysis further, we also calculated the amount of economic value added from management’s capital budgeting initiatives over the past 4 quarters to date.
As a footnote, EVA measures corporate income after deducting the cost of capital. ROIC is, therefore, also linked to valuation through EVA. We believe this will also serve as an appropriate calculus to benchmark HQY against in the Q3 period, to see if management have built in any EVA.
As observed in Exhibit 3, HQY management haven’t added value above the cost of capital over the past 4 quarters. Should the EVA number come in positive next quarter, this would be a pleasant upside surprise. If not, then we’d conclude the same from our last HQY note.
Exhibit 3. HQY hasn’t build in additional income above the cost of capital
Note: EVA is calculated as [(ROIC – WACC) x Invested Capital]. Also, economic profit can be seen as the [ROIC – WACC] calculation. (Data: HBI, HQY SEC Filings)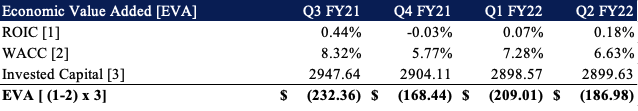
HQY: The technical picture
Given the current state of markets, we decided to check in on any correlation between market data and fundamentals. Judging from Exhibit 4, there’s been plenty of price evolution for HQY over the past 2 years to date.
It shows weekly bars, and the first point to observe is the low of December 2021, and the ascending triangle that formed from then until the week of 21 October 2022.
That’s when HQY poked its head above the ceiling of the triangle, before it rapidly declined and then punched its way below support. Prior to this, we saw the 250DMA and 50DMA cross to the downside.
From December FY21′ to October FY22′ this was a decent upside move that enabled investors to recapture the upside of the previous 12 months in HQY.
However, we believe the recent price action is a risk, and the fact it has broken through support is a more ominous sign in our opinion.
Exhibit 4. HQY 24 month price evolution [weekly bars, log scale]. Support of ascending triangle broken after heavy downside and poor volume trends
Data: Updata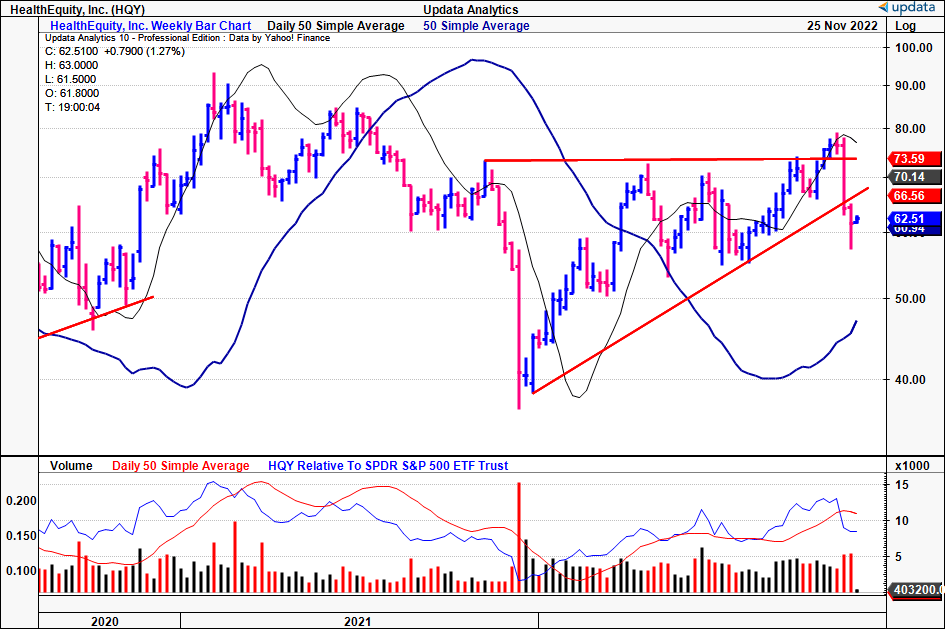
With this in mind, we see downside targets to $17, with an upside target to $74.5 [Exhibit 5]. This is a wide breadth and, therefore, we’d look to additional data to understand directional movement in HQY.
Given the recent downside, and fundamental data outlined above, we are placing more weight to the downside.
Exhibit 5. Wide breadth in price targets. We are weighted to the downside
Data: Updata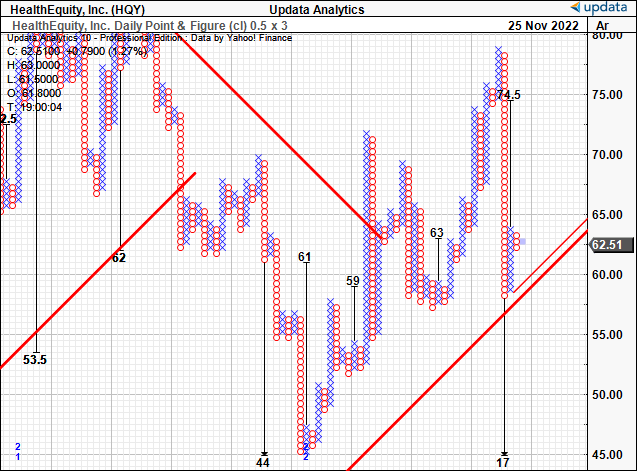
In order to gauge this, we checked additional trend indicators to guide price visibility. As seen in the daily cloud chart below, shares are trading beneath the cloud, with the lag line currently testing the cloud.
We’d note the HQY share price tested and failed at the lower cloud level 2 weeks ago. Moreover, on-balance volume and momentum studies, both indicative of directional trends, show a large wind-back in upside as well.
Combined, this data tells us that we should be placing more weight on the downside targets above.
Exhibit 6. Trading below cloud support
Data: Updata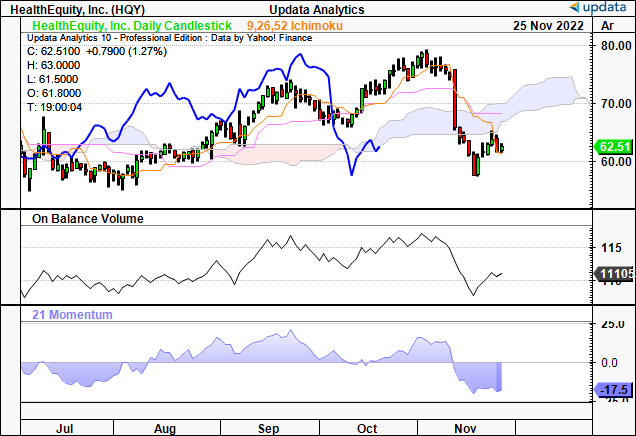
Valuation and conclusion
In our last HQY note, we suggested a price range of ~$52–$54 with the stock trading at 2.8x book value and ~44x trailing CFFO. As a reminder, we also observed the company had negative tangible book value of $798mm at the time.
We are comfortable in retaining this price target heading into HQY’s next earnings, and will look to revise this figure either to the upside or downside after we see the numbers accordingly.
As such, we retain our neutral rating into HQY’s next earnings report, and look forward to providing additional coverage on the day of its release. Reminder, this is Tuesday, 6th December 2022, as confirmed by the company.
Be the first to comment