

koto_feja/E+ via Getty Images
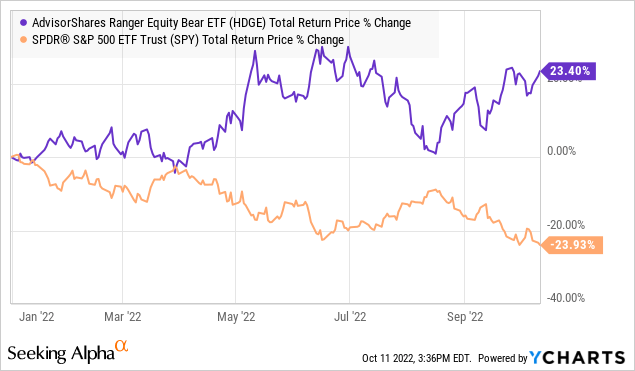
The AdvisorShares Ranger Equity Bear ETF (NYSEARCA:HDGE) shorts stocks through an actively managed fundamentals-driven approach. The idea here is to identify companies that may underperform the broader market with the fund gaining value as the underlying share prices fall. Indeed, the strategy has paid off this year amid historic volatility sending the S&P 500 firmly into a bear market while HDGE has generated a positive return above 20%.
The fund is a big winner in 2022, although we respectfully note that the performance is less impressive compared to alternative inverse index ETFs that offer a similar short exposure with some key advantages. Our take is that HDGE is one option for investors to add to a broader portfolio to express a tactically bearish market view or represent a hedging instrument but it may not be the best choice in all circumstances.
What is the HDGE ETF?
What makes the HDGE relatively unique among short equity ETFs is that positions are based on individual stocks, in contrast to index-level funds or derivatives-based strategies. In this case, the portfolio manager focuses on stocks that have poor fundamentals between metrics like low earnings quality by utilizing forensic accounting to identify financial and operational weaknesses. Catalysts like reduced company guidance and revisions to earnings estimates are also explored along with the use of technical analysis.
In terms of the portfolio construction process, AdvisorShares explains that each short is expected to average between 2-7% in terms of its fund weighting while the current portfolio is short 66 stocks. The strategy also considers some holdings as “core fundamental positions” that are more central to the strategy that is supplemented with “tactical trading” positions as part of the portfolio management process.
source: AdvisorShares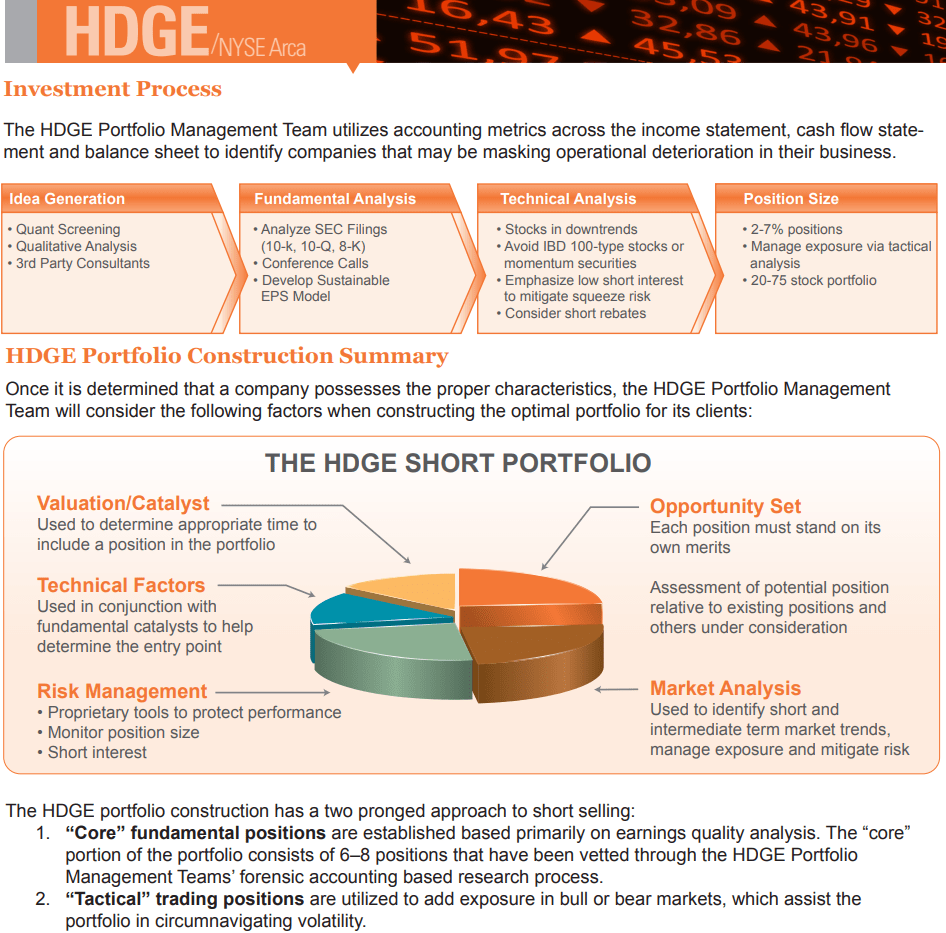
Taking a look at the latest portfolio update, we find a relatively wide rate of sector diversification although the fund is particularly bearish on tech, representing 43% of the short exposure. Financials are 23% of the positions followed by consumer discretionary names at 11%.
The largest single short is in Universal Display Corp (OLED) at -5.9% of the fund. Consumer financing player OneMain Holdings Inc (OMF) and database SaaS leader MongoDB Inc (MDB), down the line have a -2.5% and -2.4% weighting each. Going through the list, it’s fair to say that the fund management team is bearish on these particular stocks but keep in mind that given the actively managed approach, positions can be added or removed at any time based on the potentially changing market views and conditions.
source: AdvisorShares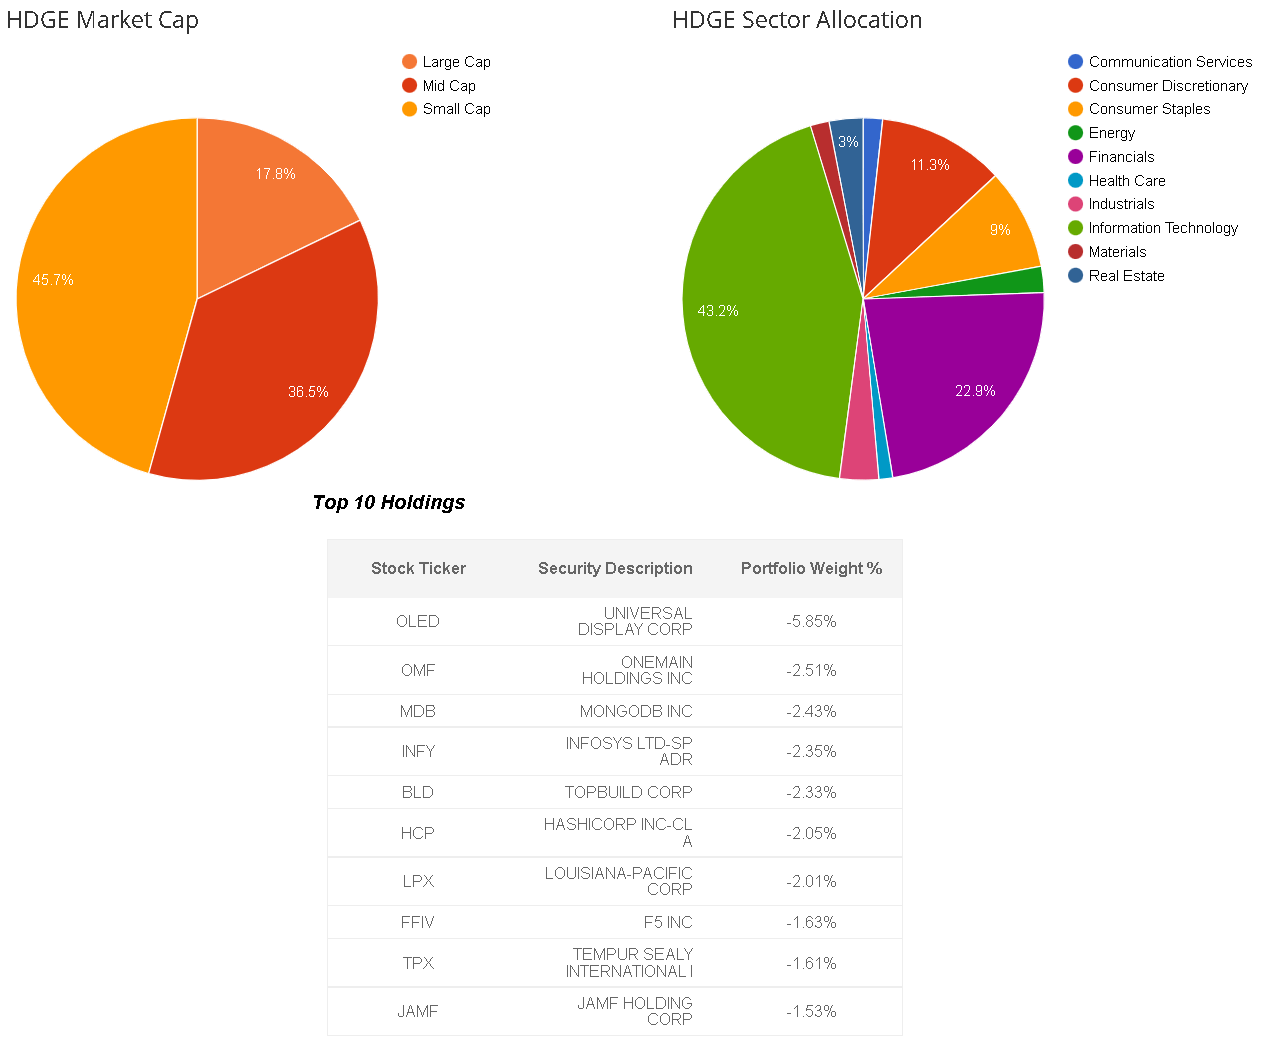
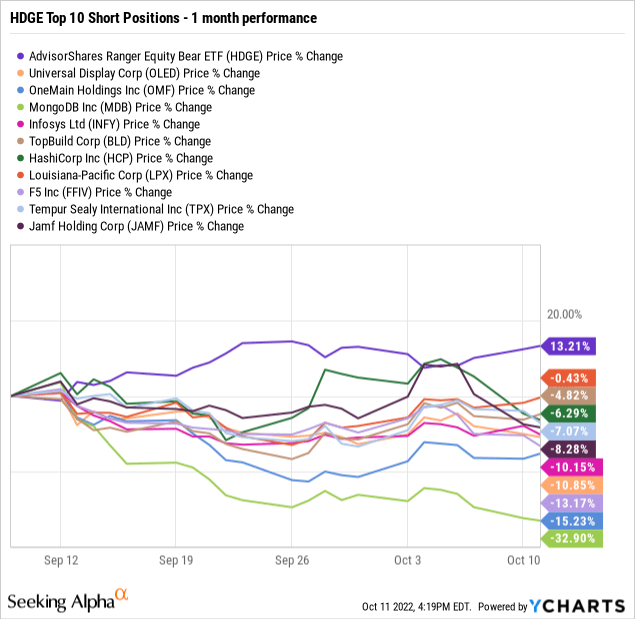
Notably, all ten of these stocks have declined in the past month in the context of the broader market selloff. HDGE is up 13% over the period compared to a 12% decline in the S&P 500. Beyond macro headwinds related to stubbornly high inflation, climbing interest rates, and global growth concerns; sentiment in the market has been particularly poor which is exactly the type of environment HDGE’s strategy excels.
HDGE Performance Analysis
It’s clear that in a scenario where the stock market falls further, possibly driven by a deterioration of the economic outlook, HDGE would continue to rally delivering a positive return. Bears have plenty of factors on their side between an expectation for climbing unemployment through 2023 and more Fed rate hikes that can add to market volatility. Ultimately, the potential that corporate earnings evolve weaker-than-expected would be the most critical dynamic opening a door for stocks to take a leg lower.
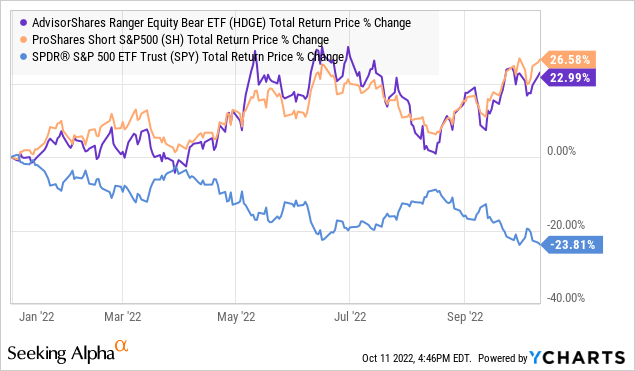
At the same time, it’s unclear if the AdvisorShares Ranger Equity Bear ETF is delivering real excess returns or alpha relative to more vanilla short index funds. The benchmark we’re looking at is the ProShares Short S&P 500 (SH) which is simply a passively managed and unleveraged inverse ETF. In a scenario where the S&P 500 (SPY) declines by -1% in a single day, SH would be expected to rally and deliver a positive 1% return.
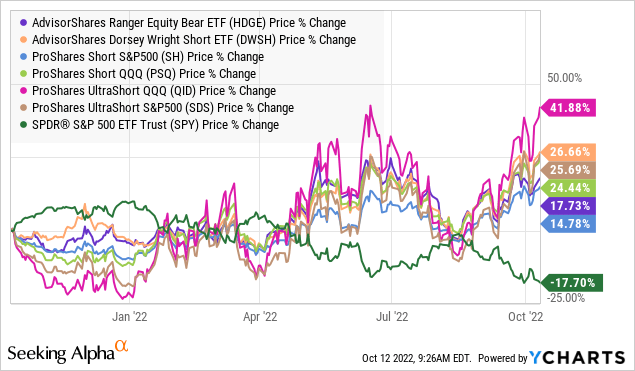
By this measure, HDGE has lagged slightly with a 23% return year-to-date compared to a 26.6% gain in SH, against a -24% decline in SPY on a total return basis. The difference could be described as marginal, and it’s unlikely HDGE investors will be complaining given the market circumstances.
Our point here is that the actively managed strategy doesn’t necessarily stand out as exceptional, especially considering the fund’s 1.5% management fee compared to SH at 0.89%. HDGEs’ total published expense ratio is technically even higher at 5.2%, the includes both the gross management fee along with costs related to the shorting strategy like the borrowing fee for individual positions.
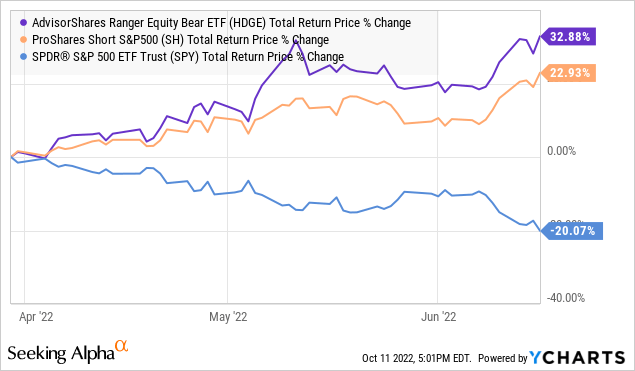
To be fair, there are time frames where HDGE outperforms SH, particularly during periods of high volatility. This means that if there is an expectation that if the market “crashes” tomorrow or next week, HDGE would likely deliver a slightly higher return over the short term. For example, between March 30th and June 16th, the S&P 500 faced a particularly fast downside move of 20% while HDGE climbed by 33% compared to a 23% rally in SH.
This example at least highlights the value of the fund in certain circumstances. For short-term holdings over a few days and weeks, HDGE could be a better option for traders and investors compared to other hedging and short alternatives. The dynamic is also presented in HDGE’s marketing, noting that during extreme drawdowns over the past decade, the fund’s performance went beyond a -1x correlation to the broader market. This is a strong point in the fund’s profile.
source: AdvisorShares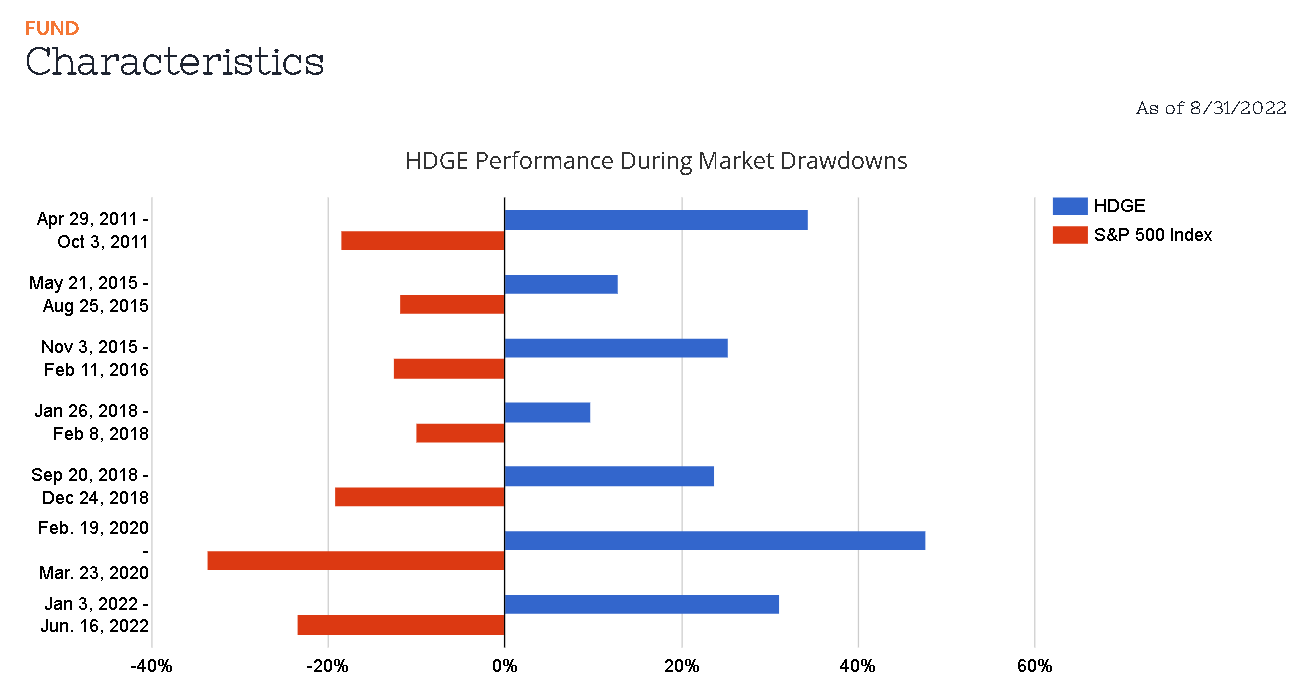
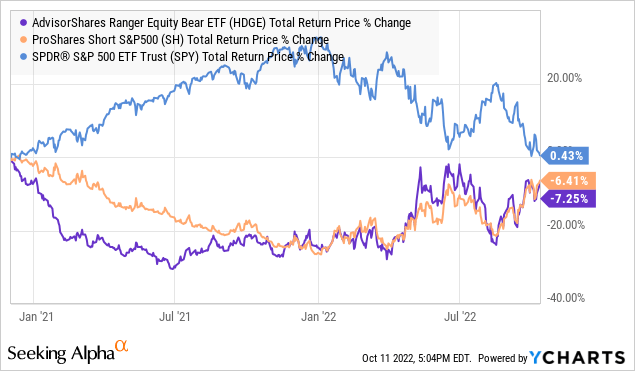
Again, our critique here goes back to the strategy’s efficiency over longer time frames and relative to simple inverse ETFs. We sense that with a portfolio that includes 66 short positions, a relatively large number, the HDGE’s beta tends to approach -1.0 which means the aspect of security selection gets lost outside of high-level market trends. Currently, the S&P 500 is trading near a 2-year low at levels from November 2020. In this case, anyone holding the fund over the entire period would be down approximately -7.3%, roughly the same as SH’s -6.4% decline.
Investors looking to hedge or speculate on the market downside have many options and alternatives. Several inverse ETFs on high-profile indexes like SH or the ProShares Short QQQ (PSQ) serve the same purpose as HDGE. More aggressive traders can look to leveraged instruments like the UltraShort QQQ (QID) and UltraShort S&P 500 (SDS) that provide a -2x return to the daily performance of their respective tracking indexes.
Even within the same fund family as HDGE, investors will also find the AdvisorShares Dorsey Wright Short ETF (DWSH), which has a similar actively managed profile but technically through a different strategy. In this case, DWSH has been a bit stronger over the past year with a 26% gain compared to 18% from HDGE. Derivative strategies through options on individual stocks or at the index level can also work. Reducing exposure to risk assets by moving to cash is another alternative that can help limit portfolio volatility with reduced losses.
Final Thoughts
HDGE works for its intended purpose although we’re not convinced the actively managed approach based on fundamental analysis adds value. Given the inherent risks of shorting stocks, the fund is at high risk to hold over extended time frames. In a scenario where bullish momentum returns to the stock market, HDGE would face a significant downside to its share price.
Be the first to comment