

ugurhan
This article series aims at evaluating ETFs regarding the relative past performance of their strategies and quality of their current portfolios. As holdings and their weights change over time, updated reviews are posted when necessary.
HDEF strategy and portfolio
The MSCI EAFE High Dividend Yield Equity ETF (NYSEARCA:HDEF) has been tracking the MSCI EAFE High Dividend Yield Index since 8/12/2015. As of writing, it has a portfolio of 116 stocks, a dividend yield of 6.5% and a total expense ratio of 0.20%. It pays quarterly distributions.
As described in the prospectus, the underlying index “is designed to reflect the performance of equities (excluding REITs) in its parent index, the MSCI EAFE Index, with higher dividend income and quality characteristics than average dividend yields of equities in the parent index, where such higher dividend income and quality characteristics are both sustainable and persistent”.
HDEF is mostly invested in companies based in Europe (63.5% of asset value) and Asia (32.6%). Almost 92% is in large and mega-caps. The U.K. comes first in country weight (22.4%), followed by Japan (14.6%), Switzerland (11.3%) and Australia (10.5%). No other country weighs more than 8%. The next chart plots the top 10 countries, representing 87.3% in aggregate value.
HDEF countries (chart: author; data: DWS)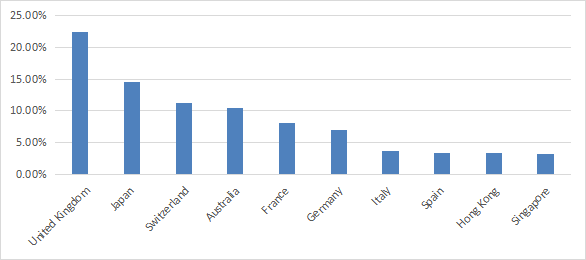
The top three sectors are quite balanced: financials, consumer staples and materials are between 17% and 19%. Healthcare follows with about 12%. Other sectors are below 9% individually and 34% in aggregate.
HDEF sectors (chart: author; data: DWS)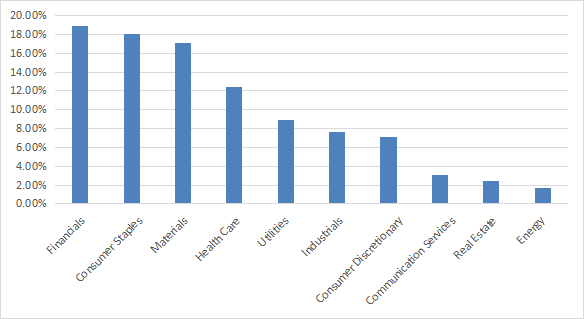
HDEF is much cheaper than the US benchmark S&P 500 (SPY) regarding valuation ratios (see next table). It doesn’t mean it is a bargain: a fund’s metrics may be biased by the geographical and sector breakdown. Every country and industry has different averages. In particular, the heaviest sector here, financials, naturally has cheaper ratios, and also much less reliable than in other sectors.
|
DEF |
SPY |
|
|
Price / Earnings TTM |
9.4 |
19.63 |
|
Price / Book |
1.43 |
3.72 |
|
Price / Sales |
0.94 |
2.4 |
|
Price / Cash Flow |
6.45 |
14.98 |
Data: Fidelity
The top 10 holdings, listed below, represent 37.6% of asset value. The heaviest one weighs 5.35%, so risks related to individual stocks are moderate.
|
Name |
Ticker |
Weight % |
Country |
Sector |
|
Unilever PLC |
ULVR LN |
5.35 |
GB |
Consumer Staples |
|
Novartis AG-Reg |
NOVN VX |
5.04 |
CH |
Health Care |
|
BHP Billiton Ltd |
BHP AT |
4.42 |
AU |
Materials |
|
Sanofi-Aventis |
SAN FP |
4.26 |
FR |
Health Care |
|
British American Tobacco PLC |
BATS LN |
3.75 |
GB |
Consumer Staples |
|
Allianz SE-Reg |
ALV GY |
3.17 |
DE |
Financials |
|
Rio Tinto PLC |
RIO LN |
3.04 |
GB |
Materials |
|
Zurich Insurance Group AG |
ZURN VX |
2.94 |
CH |
Financials |
|
GSK Plc |
GSK |
2.88 |
US |
Health Care |
|
Iberdrola SA |
IBE SQ |
2.71 |
ES |
Utilities |
HDEF vs. competitors
The next table compares the fund’s performance and risk metrics since 1/1/2016 with other non-hedged international dividend funds: Schwab Fundamental International Large Co ETF (FNDF), iShares International Select Dividend ETF (IDV), Invesco FTSE RAFI Developed Markets ex-U.S. ETF (PXF), First Trust Dow Jones Global Select Dividend ETF (FGD), SPDR S&P Global Dividend ETF (WDIV), and Global X SuperDividend ETF (SDIV).
|
since Jan.2016 |
Total Return |
Annual Return |
Drawdown |
Sharpe ratio |
Volatility |
|
HDEF |
18.11% |
2.49% |
-36.87% |
0.19 |
15.17% |
|
FNDF |
34.89% |
4.53% |
-40.09% |
0.29 |
16.76% |
|
IDV |
22.65% |
3.06% |
-41.64% |
0.21 |
18.00% |
|
PXF |
29.97% |
3.95% |
-41.56% |
0.26 |
17.32% |
|
FGD |
29.93% |
3.95% |
-43.26% |
0.24 |
18.59% |
|
WDIV |
32.59% |
4.26% |
-40.11% |
0.27 |
16.76% |
|
SDIV |
-29.18% |
-4.97% |
-56.62% |
-0.14 |
22.56% |
Data calculated with Portfolio123
As a reference, SPY has gained 112% in the same period of time (11.8% annualized). HDEF has lagged behind all of them except SDIV, which is the only one in loss here. SDIV has the highest yield and the worst performance, showing once again the risks of high yield funds. I have pointed out in several ETF reviews that securities with yields above 6% suffer from capital decay on average (there are rare exceptions). The next chart compares HDEF with the best performer in the list above: FNDF.
HDEF vs. FNDF since 2016 (Portfolio123)
Takeaway
HDEF holds 116 international dividend stocks of large companies. The top 3 countries are the U.K., Japan and Switzerland. The top 3 sectors are financials, consumer staples and materials. Valuation ratios look great, but past performance not so much: HDEF has underperformed five of its competitors in the same asset category since 2016. For transparency, a dividend-oriented part of my equity investments is split between a passive ETF allocation and my actively managed Stability portfolio (14 stocks), disclosed and updated in Quantitative Risk & Value.
Be the first to comment