U.S. DOLLAR ANALYSIS
- U.S. CPI data exceeds forecasts – Core:4.6%, Headline: 6.2%.
- Dollar pops as hawkish narrative strengthens.
DOLLAR FUNDAMENTAL BACKDROP
HEADLINE AND CORE INFLATION BEAT ESTIMATES
Market expectations were crushed by both core and headline inflation prints for October which adds additional pressure onto the Fed to bring rate hikes forward. The patient approach has already divided opinions and may further exacerbate the current division or potentially convert individuals in the dovish camp.
Source: DailyFX economic calendar
PRE-INFLATION BUILD UP
FED SPEECHES MAY POINT TO SOONER THAN EXPECTED RATE HIKE
The start of this week saw numerous Fed officials eluding to the fact that interest rates could be raised in 2022 and not 2023 as anticipated, along with a quicker end to asset purchases (tapering). This comes after inflation has avoided the transitory rhetoric for now and proves to be more “sticky” than initially thought by some; primarily Fed Chair Jerome Powell.
EVERGRANDE GIVES BOOST TO HAVENS
Yesterdays U.S. PPI data came in as expected which did little in the way of USD price action however today an uptick in safe-haven currencies including the dollar has propped the Dollar Index (DXY) above the key 94.00 level. Evergrande debt woes are back in play sparking contagion fears once more.
TECHNICAL ANALYSIS
U.S. DOLLAR INDEX (DXY) WEEKLY CHART
Chart prepared by Warren Venketas, IG
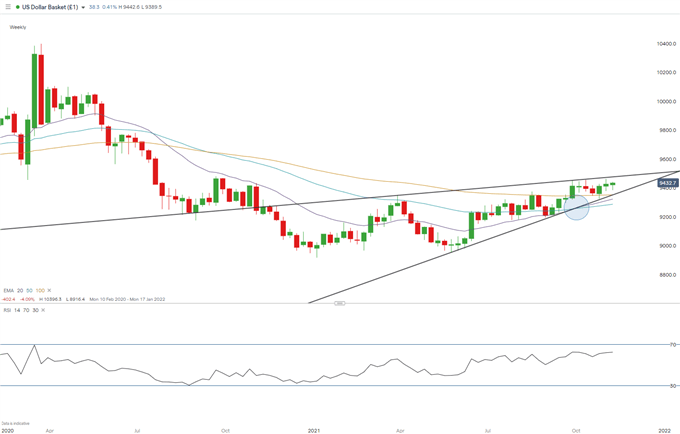
The weekly DXY chart above may be suggestive of a rising wedge pattern (black) which could see a weaker dollar should prices break (candle close below) wedge support.
Contrary to the rising wedge, the 20-day Exponential Moving Average (EMA) has recently crossed above the 50-day EMA, also referred to as a bullish crossover and may indicate further upside to come.
U.S. DOLLAR INDEX (DXY) DAILY CHART
Chart prepared by Warren Venketas, IG
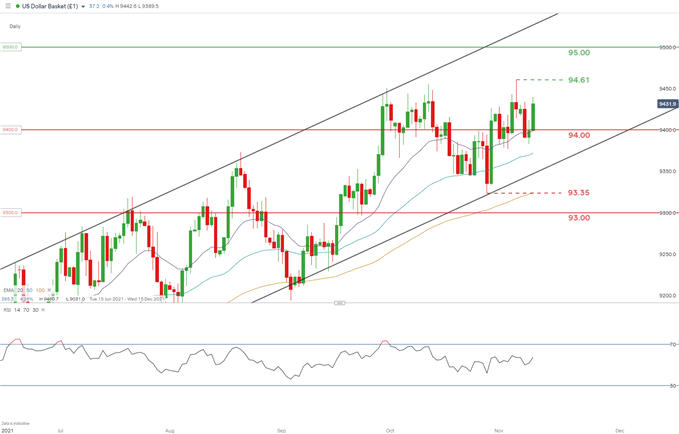
The daily chart shows the DXY pushing higher immediately after the announcement which bring into consideration the recent swing high at 94.61. This looks likely with subsequent resistance at 95.00. Price action within the channel (black) could continue its waver towards channel resistance.
Resistance levels:
Support levels:
— Written by Warren Venketas for DailyFX.com
Contact and follow Warren on Twitter: @WVenketas


Be the first to comment