

Joe Raedle/Getty Images News
By Brian Nelson, CFA
Consumer staples equities tend to be more resilient than most because of the consistent demand for their products through the course of the economic cycle. However, inflationary pressures have put a number of consumer staples stocks against the wall. In many instances, pricing increases haven’t been large enough to offset gross margin pressure, and there have been signs of demand (volume) destruction as consumers balk at price increases. According to the U.S. Bureau of Labor Statistics, the food index showed a 10.1% increase for the 12 months ending in May. That’s a lot for the consumer to swallow, and we think many consumer staples stocks may have peaked for this stock market cycle.
In Procter & Gamble’s (NYSE:PG) calendar first-quarter earnings report, released April 20, the company’s gross margin fell 400 basis points, despite price increases and organic sales expansion. The firm noted that the “decline was driven by 410 basis points of increased commodity costs, 80 basis points of higher freight costs, 30 basis points of product/package reinvestments and 130 basis points of negative product mix.” P&G raised its top-line outlook for its fiscal year thanks to pricing actions, but such pricing strength won’t seem to translate to incremental improvements on the bottom line this fiscal year, as P&G held its earnings per share outlook steady calling for 6-9% growth for the fiscal year. We didn’t like the implication with respect to profitability pressure.
From what we can gather, the market is getting more and more cautious on the consumer staples sector, as a whole, with bellwether P&G’s share price falling to the low $130s per share and notching a 52-week low, as of the trading session Friday, June 17. Though the consumer staples (XLP) sector has held up better in 2022 than any other major sector except for the energy (XLE) and utilities (XLU) spaces, we think the consumer staples group may be in for some tough sledding in the coming quarters, with the group trading at a full forward multiple of 19.3x versus the S&P 500 multiple of ~16x, according to data from FactSet (FDS). Many consumer staples entities have huge net debt positions and hefty dividend obligations, too, so their premium multiple relative to the market multiple makes little sense in our view. Our fair value estimate for P&G stands at ~$121, so more downside in the bellwether’s equity price could be in store, potentially leading the entire sector lower.
Proctor & Gamble‘s Investment Considerations
Image source: Valuentum. Our key investment considerations for Procter & Gamble. (Valuentum)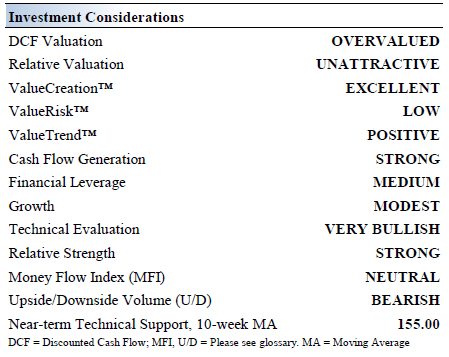
Procter & Gamble boasts some of the most recognized branded consumer packaged goods, but it is not resting on its laurels. The company remains aggressive in the current market environment with a laser focus on innovation, productivity, and pricing initiatives. Though the markets in which its products are sold are highly competitive, particularly with respect to price, the firm remains well positioned in the industry and holds significant market share positions. Still, P&G will face challenges.
P&G rationalized its portfolio a number of years ago, but it still holds a very attractive stable of well-recognized brands. (P&G’s presentation at the Deutsche Bank conference, June 16, 2022.)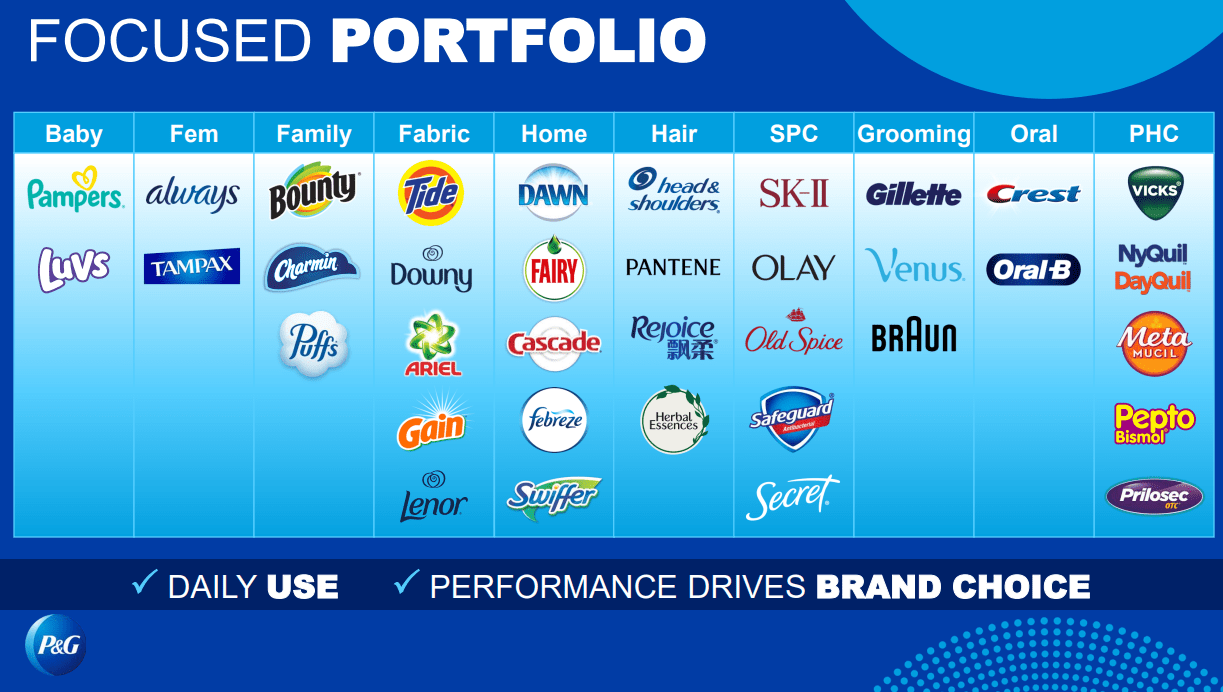
For a company with such established brands as Procter & Gamble, ongoing product innovation and compelling marketing strategies are vital to supporting its long-term sales growth trajectory. Improving its cost structure is another key focus, especially as the company deals with three major headwinds in the near term: market growth pressure, supply chain disruptions, and increased costs due to inflationary pressures. We’re not sure that P&G will have an easy time exceeding bottom-line expectations in the current market environment, and investors should evaluate risks accordingly.
Image: P&G’s is facing three major headwinds to improving margins and profits. (P&G’s presentation at the Deutsche Bank conference, June 16, 2022.)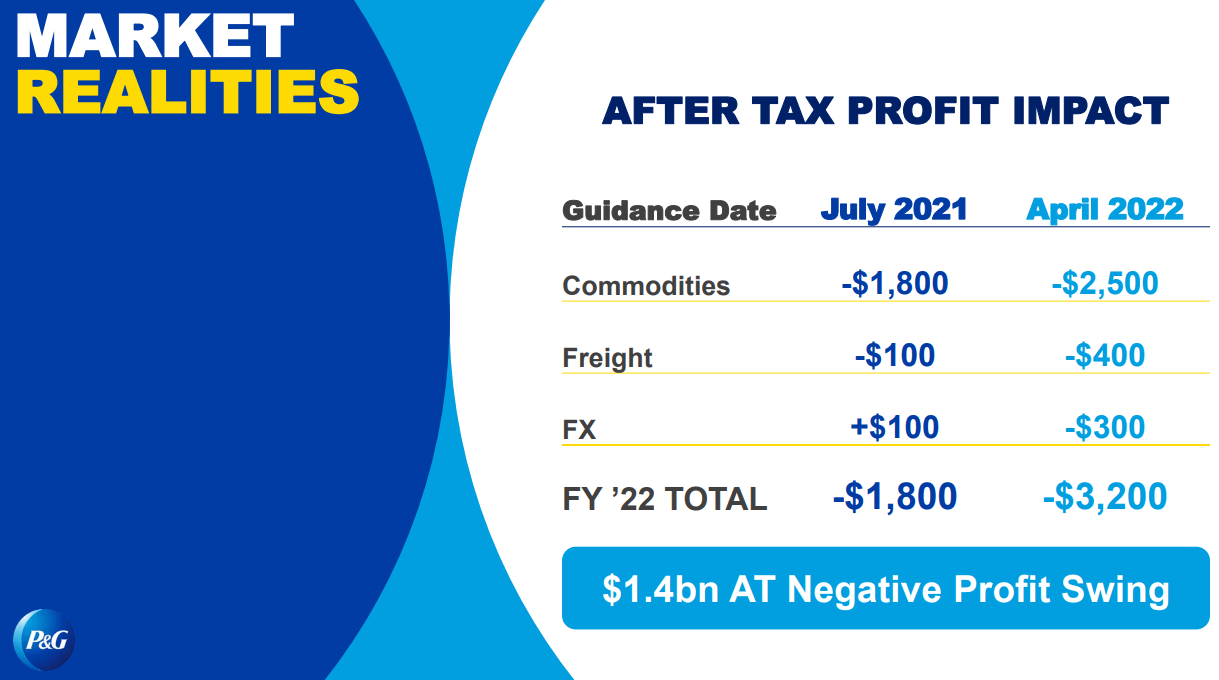
Procter & Gamble worked through a massive portfolio transformation during the past several years. P&G is now focused on ten categories where it holds leading market positions. At the start of 2021, P&G and Billie agreed to walk away from P&G’s deal to acquire the firm after the FTC sued on antitrust grounds. We expect P&G will pursue other deals, but we also expect management to be conservative as it deals with fast-changing market conditions and as inflation continues to come in hot.
P&G’s brands include Tide, Ariel, Gillette, Bounty, Charmin, Olay, Pampers, Crest, and Oral-B. The company’s innovation pipeline is robust, and the markets the firm serves from ‘Baby, Feminine, Family’ to ‘Health & Grooming’ are massive and growing as the global middle class continues to grow. Through the third quarter of its fiscal year, the company has experienced tremendous organic growth in the areas of ‘Personal Health Care’ (+21%), ‘Fabric Care’ (+10%), and ‘Feminine Care’ (+10%).
Procter & Gamble boasts 130+ consecutive years of dividend payments and ~65 consecutive years of dividend increases. The company has become one of the favorite considerations for long-term dividend growth investors, and why not? Free cash flow is robust and free cash flow productivity is generally targeted at 90%+ of net income (levels it achieves consistently on an adjusted basis). Free cash flow is the core driver of its robust Dividend Cushion ratio given its net debt load, with its Dividend Cushion ratio standing at a healthy 1.8 at the time of this writing.
Image Source: Procter & Gamble has been a consistent dividend grower for a long time. (P&G’s presentation at the Deutsche Bank conference, June 16, 2022.)
P&G’s Economic Profit Analysis
The best measure of a company’s ability to create value for shareholders is expressed by comparing its return on invested capital with its weighted average cost of capital. The gap or difference between ROIC and WACC is called the firm’s economic profit spread. Procter & Gamble’s 3-year historical return on invested capital (without goodwill) is 44.5%, which is above the estimate of its cost of capital of 8.8%.
As such, we assign the firm a ValueCreation rating of EXCELLENT. In the chart below, we show the probable path of P&G’s ROIC in the years ahead based on the estimated volatility of key drivers behind the measure. The solid grey line reflects the most likely outcome, in our opinion, and represents the scenario that results in our fair value estimate. We perform scenario and sensitivity analysis to help inform our valuation ranges for the company.
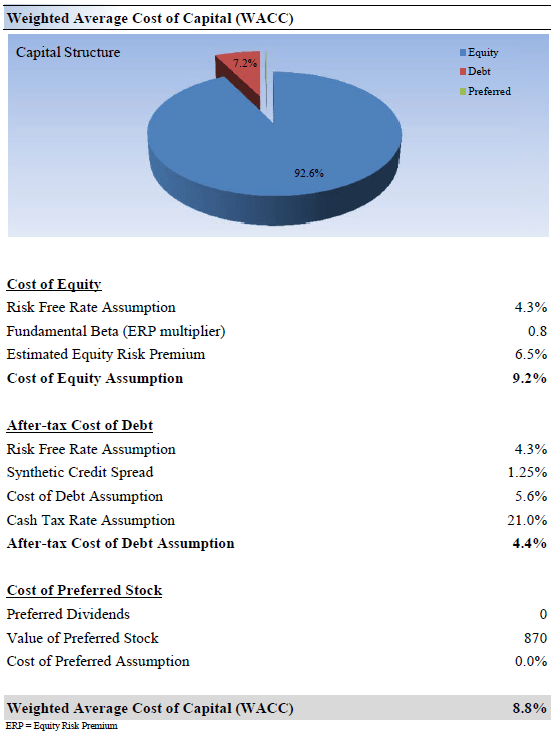
Image source: Valuentum. The probable path of P&G’s ROIC in coming years. We expect P&G to continue to be a robust value generator. (Valuentum) Image source: Valuentum. How we calculate P&G’s weighted average cost of capital. (Image source: Valuentum)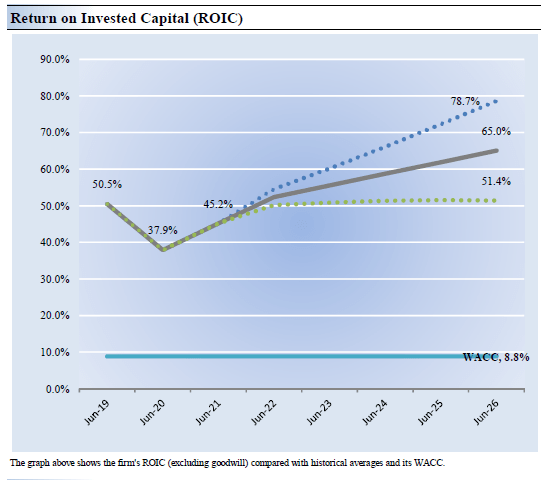
P&G’s Cash Flow & Valuation Analysis
Image source: Valuentum. P&G continues to generate free cash flow in excess of expected cash dividends paid. (Image source: Valuentum)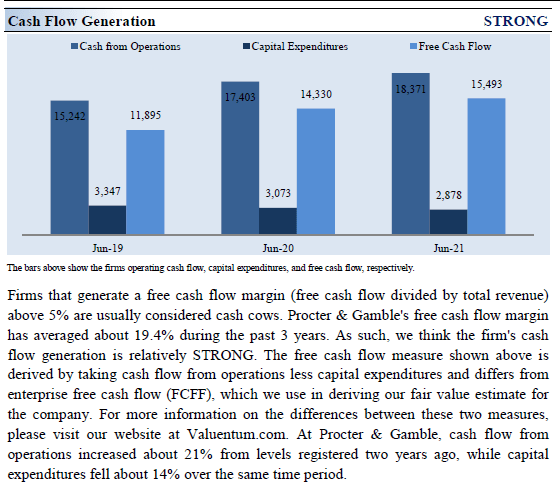
We think Procter & Gamble is worth $121 per share with a fair value range of $97-$145. The margin of safety around our fair value estimate is driven by the firm’s LOW ValueRisk™ rating, which is derived from an evaluation of the historical volatility of key valuation drivers and a future assessment of them.
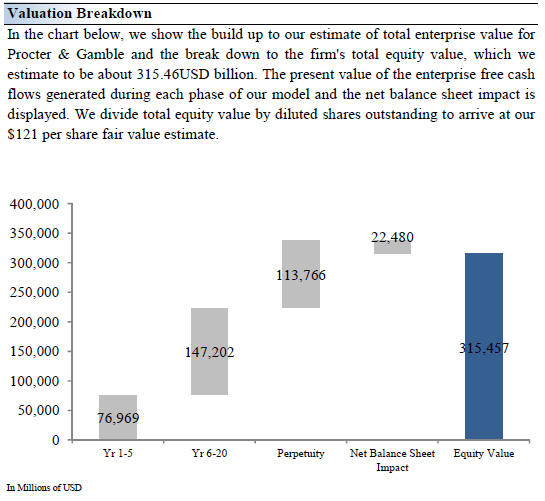
Our near-term operating forecasts, including revenue and earnings, do not differ much from consensus estimates or management guidance. For the most part, the largest percentage of the value of a business is generated from free cash flow over the long run (into perpetuity). We pay the most attention to mid-cycle forecasts that influence the perpetuity value and don’t worry too much about differing from consensus in the near term.
Our valuation model reflects a compound annual revenue growth rate of 4.7% during the next five years, a pace that is higher than the firm’s 3-year historical compound annual growth rate of 4.4%. Our model reflects a 5-year projected average operating margin of 26.1%, which is above Procter & Gamble’s trailing 3-year average.
Beyond year 5, we assume free cash flow will grow at an annual rate of 3.1% for the next 15 years and 3% in perpetuity. For Procter & Gamble, we use an 8.8% weighted average cost of capital to discount future free cash flows. Please note that our 10-year Treasury assumption is still above that of the spot rate, indicating that we’ve built in some conservatism in our valuation model.
Image source: Valuentum. The key assumptions within our discounted cash flow model. (Image source: Valuentum) Image source: Valuentum. How to think about the value that P&G generates through various stages of our valuation infrastructure. (Image source: Valuentum)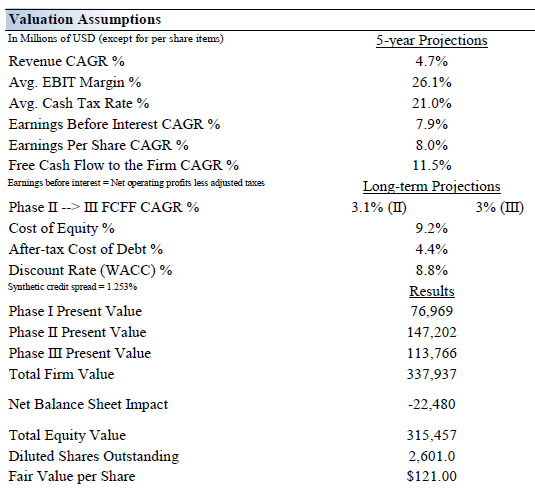
P&G’s Margin Of Safety Analysis
Image source: Valuentum. We view value as a range of probable fair value outcomes. The highest point in this fair value distribution is the most likely fair value estimate for P&G. (Image source: Valuentum)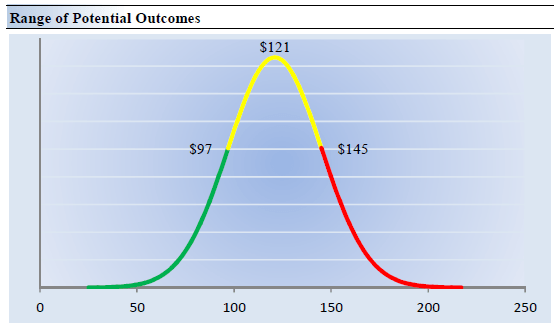
Our discounted cash flow process values each firm on the basis of the present value of all future free cash flows. Although we estimate P&G’s fair value at about $121 per share, every company has a range of probable fair values that’s created by the uncertainty of key valuation drivers (like future revenue or earnings, for example). After all, if the future were known with certainty, we wouldn’t see much volatility in the markets as stocks would trade precisely at their known fair values.
Our ValueRisk rating sets the margin of safety or the fair value range we assign to each stock. In the graph above, we show this probable range of fair values for Procter & Gamble. We think the firm is attractive below $97 per share (the green line), but quite expensive above $145 per share (the red line). The prices that fall along the yellow line, which includes our fair value estimate, represent a reasonable valuation for the firm, in our opinion. We embrace the idea that valuation is an imprecise exercise and focus on fair value ranges within our work.
P&G’s Future Path Of Fair Value
Image source: Valuentum. P&G’s fair value advances over time as the company collects free cash flow in excess of that which it pays out as dividends. (Image source: Valuentum)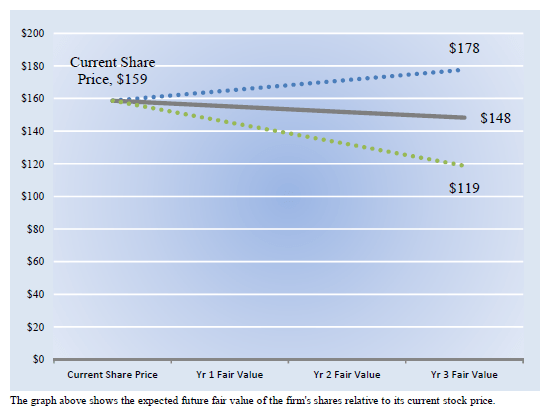
We estimate Procter & Gamble’s fair value at this point in time to be about $121 per share. As time passes, however, companies generate cash flow and pay out cash to shareholders in the form of dividends. The chart above compares the firm’s current share price–which was ~$160 at the time of the publishing of our equity report on our website; its share price is now in the low $130s as it has converged toward our fair value estimate–with the path of Procter & Gamble’s expected equity value per share over the next three years, assuming our long-term projections prove accurate.
The range between the resulting downside fair value and upside fair value in Year 3 represents our best estimate of the value of the firm’s shares three years hence. This range of potential outcomes is also subject to change over time, should our views on the firm’s future cash flow potential change. The expected fair value of $148 per share in Year 3 represents our existing fair value per share of $121 increased at an annual rate of the firm’s cost of equity less its dividend yield. The upside and downside ranges are derived in the same way, but from the upper and lower bounds of our fair value estimate range.
Concluding Thoughts
Proctor & Gamble is a Dividend Aristocrat that has paid out dividends for 130+ consecutive years and has increased its payout over the past ~65 consecutive years. The firm’s free cash flow generating abilities are impressive, though its balance sheet needs to be monitored. P&G has consolidated its brand portfolio in recent years to focus on its most promising brands. We expect P&G will moderately grow its dividend going forward. P&G is deploying new digital tools at its factories, labs, and offices to boost productivity and reduce expenses while also placing a great emphasis on its ecommerce presence as shopping continues to shift online.
One thing is certain: Procter & Gamble is not afraid of change. Innovation remains the lifeblood of its operations, and management feels that it has a better chance of winning after P&G consolidated its brand portfolio in recent years. P&G’s free cash flow generating abilities are impressive, though we caution that its hefty net debt load weighs negatively on its Dividend Cushion ratio and ability to push through meaningful dividend increases in the future. Potential acquisition activity needs to be monitored, as does P&G’s balance sheet. Ongoing inflationary pressures and supply chain disruptions represent other concerns and may prove too much for P&G to overcome to keep its stock price moving in the right direction. Shares may have already peaked for this cycle, but a ~2.8% dividend yield may keep some investors happy while they wait for better times.
This article or report and any links within are for information purposes only and should not be considered a solicitation to buy or sell any security. Valuentum is not responsible for any errors or omissions or for results obtained from the use of this article and accepts no liability for how readers may choose to utilize the content. Assumptions, opinions, and estimates are based on our judgment as of the date of the article and are subject to change without notice.
Be the first to comment