

Razvan
Thesis
The Walt Disney Company (NYSE:DIS) will report its FQ3’22 earnings release on August 10. DIS stock has been mired in a downtrend since its bull trap in March 2021 (significant rejection of buying momentum).
We posited in our previous update that the destruction in DIS could be over soon. However, DIS broke its May lows in July and set up another lower-low support zone. Consequently, we revisited our thesis and parsed whether the market could be expecting further digestion in DIS.
Our updated valuation model suggests that further considerable downside could still occur, as the market seems to demand higher free cash flow (FCF) yields. Our price action analysis indicates that DIS could continue to face challenges in reversing its bearish flow.
As a result, we believe it’s apt to revise our rating on DIS from Buy to Hold, heading into its upcoming earnings card.
Can Disney Stock Recover?
Disney investors should know that the company’s business model is cyclical and could be significantly impacted by a marked economic slowdown. Disney also cautioned in its filings (edited):
A decline in economic activity, such as a recession or economic downturn, in the US and other regions of the world in which we do business, can adversely affect demand for any of our businesses, thus reducing our revenue and earnings. In addition, an increase in price levels generally, or in price levels in a particular sector such as the energy sector, could result in a shift in consumer demand away from the entertainment and consumer products we offer, which could also adversely affect our revenues and, at the same time, increase our costs. (Disney FQ2’22 10-Q)
DIS ad revenue by category (Company filings)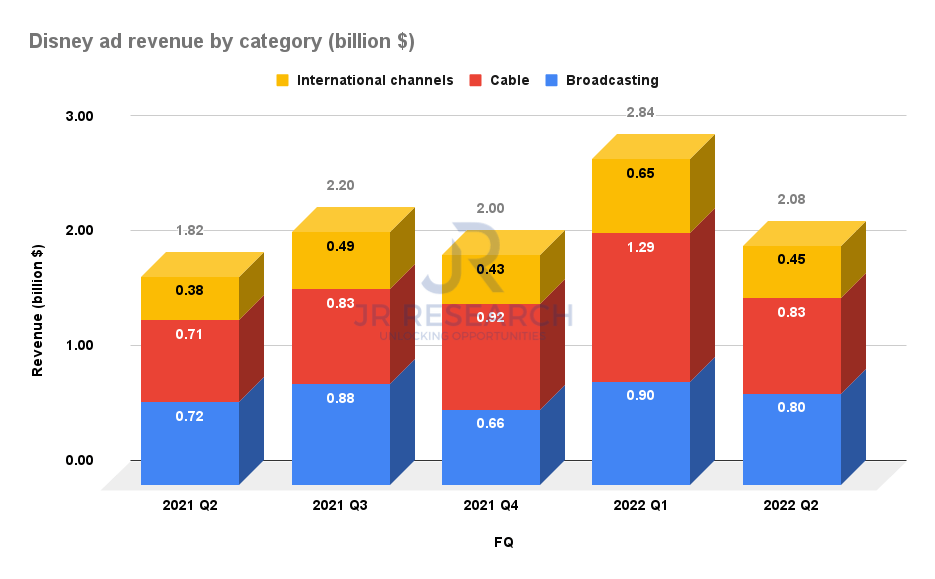
Consequently, the impact has already been felt in FQ2. Disney posted ad revenue of $2.08B, down from FQ1’s $2.84B. Moreover, the effect was broad-based, as seen above. Ad revenue accounted for 14.86% of Disney’s total revenue.
Therefore, we urge investors to pay attention to management’s commentary on its ad revenue. Coupled with its recent partnership with The Trade Desk (TTD) on performance advertising, Disney could offer meaningful insights on its ad performance moving forward.
Disney media and entertainment revenue by category (Company filings)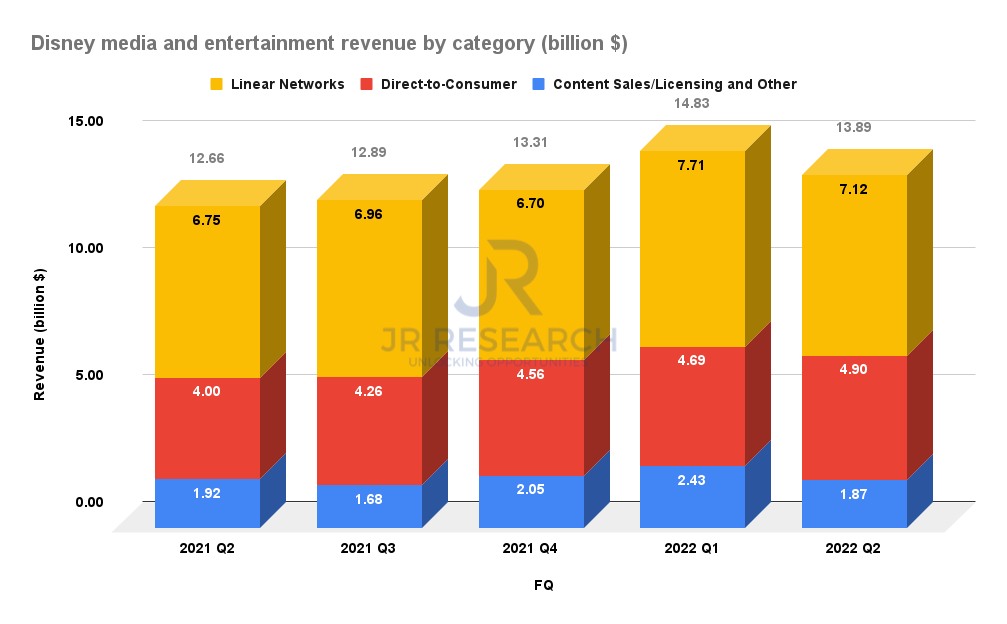
Furthermore, we believe the recessionary impact and current inflation conditions could worsen churn in its media and entertainment category. As a result, investors need to pay particular attention to management’s commentary on churn, as the slowdown in Q2 was also broad-based.
Disney parks visitor statistics % (Company filings)
Notwithstanding, Disney’s Parks have been recovering well, as hotels’ occupancy rates and guests’ spending have continued to improve. However, countervailing recessionary and inflation headwinds could impact the recovery cadence.
Consequently, we believe the market has continued to batter DIS, given the potentially significant impact across all its vital revenue categories. But, given the forward-discounting mechanism of price action, the critical question is whether these headwinds have been priced in accordingly?
Has Disney Stock’s Price Bottomed Out?
DIS price chart (monthly) (TradingView)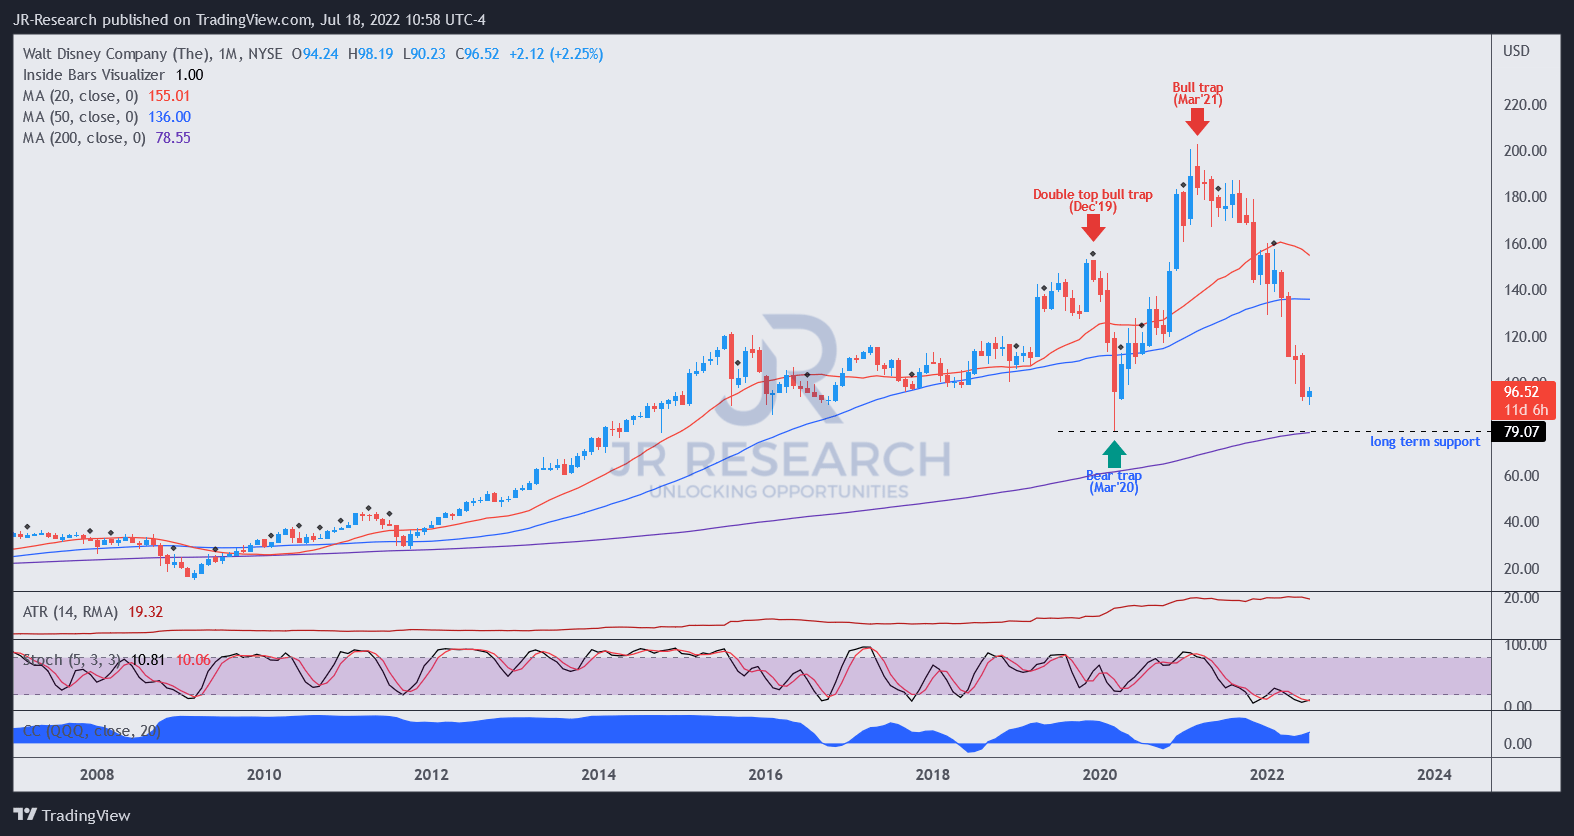
DIS’ long-term chart seems to be getting weaker, but it remains in an uptrend. Therefore, its bearish momentum could turn pretty quickly if we observe a significant price action set-up indicating a reversal of its bearish bias.
DIS price chart (weekly) (TradingView)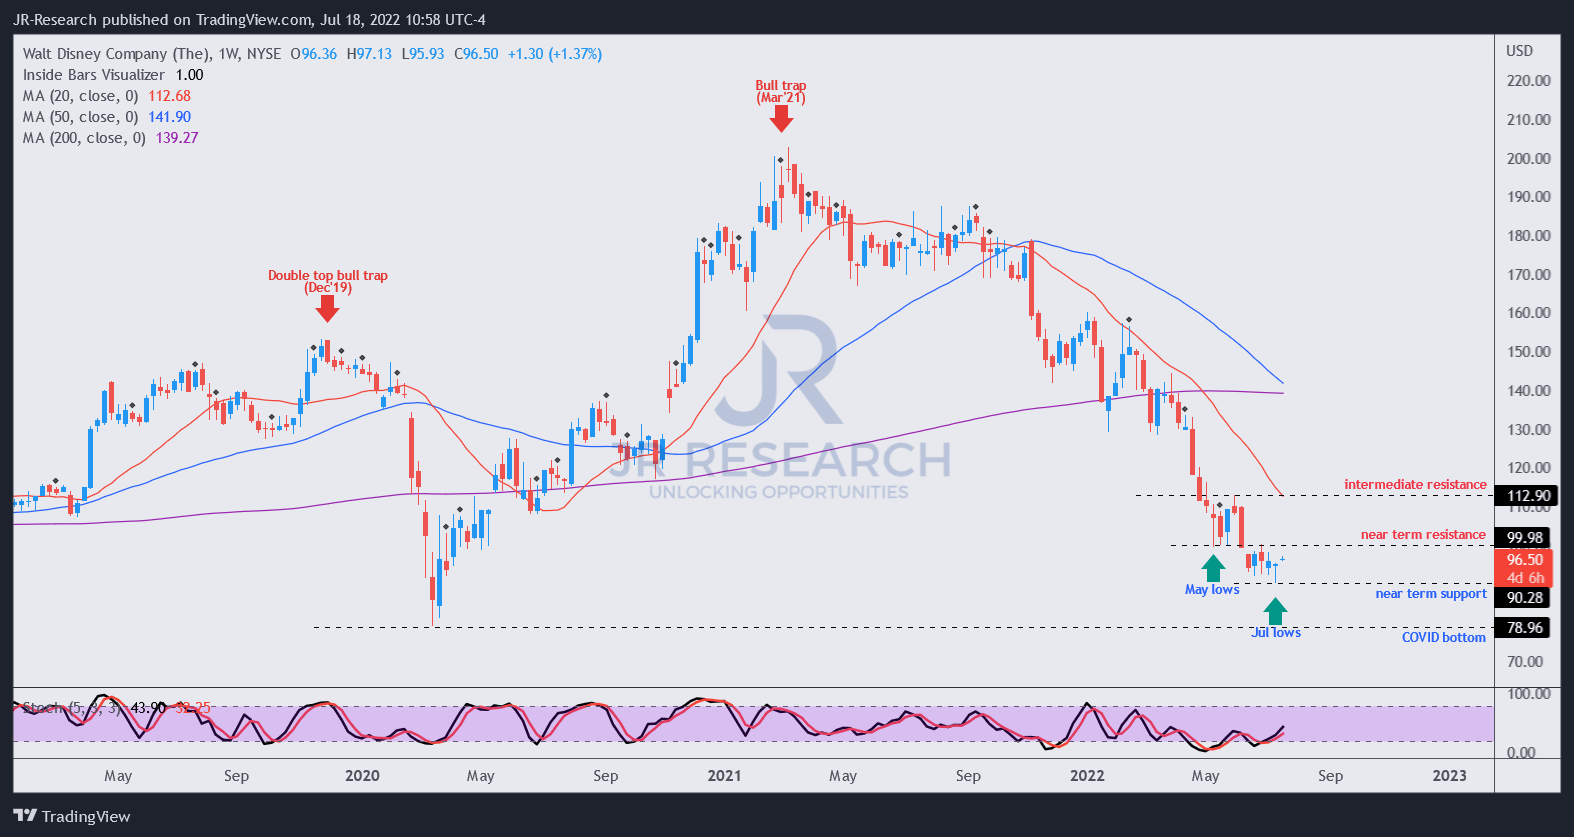
However, its medium-term chart points to a stock deeply embedded in a downtrend. Furthermore, we have not observed a bear trap price action (significant rejection of selling momentum) that could stanch its negative momentum.
Also, the market broke below its May lows, as seen above. So even though it seems to be consolidating, we still need to observe for more constructive price action.
Revised Valuation Model Suggests More Downside For DIS
| Stock | DIS |
| Current market cap | $176.16B |
| Hurdle rate [CAGR] | 11% |
| Projection through | CQ4’26 |
| Required FCF yield in CQ4’26 | 4.5% |
| Assumed TTM FCF margin in CQ4’26 | 10% |
| Implied TTM revenue by CQ4’26 | $126.22B |
DIS reverse cash flow valuation model. Data source: S&P Cap IQ, author
We revised our required FCF yield as we believe the market will likely demand higher yields to compensate for the previously discussed headwinds.
As a result, our TTM revenue target by CQ4’26 has increased markedly to $126.22B. However, we believe Disney could miss our revenue target based on the revised consensus estimates.
We posit that DIS could see further downside, with an entry closer to its COVID bottom ($79) as more appropriate with a reasonable margin of safety.
Is DIS Stock A Buy, Sell, Or Hold?
We revise our rating on DIS from Buy to Hold.
Given the increased recessionary headwinds and inflation impact, we believe the market has increased its demand for higher FCF yields to compensate for the increased risks.
Our valuation model suggests an entry point closer to its COVID bottom could offer investors more buffer as Disney’s recovery cadence could be affected, which would likely impact its valuation.
Furthermore, we have yet to observe constructive price action on its medium-term chart, even though we believe a significant level of its premium has been digested meaningfully.
Be the first to comment