

Editor’s note: Seeking Alpha is proud to welcome Nivesha Investors as a new contributor. It’s easy to become a Seeking Alpha contributor and earn money for your best investment ideas. Active contributors also get free access to SA Premium. Click here to find out more »
Naomi Baker/Getty Images News
Halfords Group (OTCPK:HLFDF)(OTCPK:HLFDY)(LSE:HFD) has placed itself as a defensive stock in this high inflation and low growth environment. Supply chain issues for new cars, higher prices, and the potential of a looming recession mean that older cars will need to remain on the road for longer.
The share price has fallen over 55% over the past year, and given the fundamentals and outlook, the company is looking extremely cheap. Intrinsic value for Halfords derived using cash flow returns on investment-based DCF analysis indicates a potential upside of over 50% in the medium term and 100% over the longer term.
Business Overview
Halfords Group is a leading retailer of cycling and automobile products and services. It operates primarily in the UK and the Republic of Ireland. 38% of revenues are derived from its cycling segment and the remaining 62% from motoring. The company plans on building a more service-focused business, relying less on retail. In line with this strategy, they have made two acquisitions in the tyre and automotive servicing markets: National Tyres (2022, £62m) and its newly announced acquisition of Lodge Tyre (£37.2m). The current market capitalization of Halfords is £350m ($400m).
Business Outlook
The car servicing market is extremely fragmented and Halfords holds a 2% share, giving them ample scope to grow. Halfords has implemented measures where we could see both top-line and bottom-line growth. These include diversification to more needs-based rather than discretionary products and services, the implementation of digital platforms to streamline service offered to B2B operating in multiple locations, and the launch of a motoring loyalty club.
Cost and revenue synergies from the acquisition and integration of National Tyre and Lodge Tyre will also be seen over the next few years. Discretionary spending will be under pressure, but the company has worked hard to diversify and insulate against macroeconomic uncertainty and we will see the benefits going forward.
Supply chain issues in getting your hands on a new car, higher prices if you can get hold of one, and the potential of a looming recession means people may put off buying new all mean that older cars will remain on the road for longer. That definitely is a positive for Halfords, where Motoring revenues account for over two-thirds of revenues.
Financials
Trying to establish the value of a company based on the last couple of years is going to be a tough task. For good measure, we will examine them. In 2020, though the company had not felt the full effect of COVID-19, given the uncertainty they took measures to conserve cash, including a reduction in dividends from 18.6p to 6.2p. This essentially increased dividend cover from 1.3x in 2019 to 3.8x in 2020.
The year ended April 2, 2021 saw a 13.1% increase in revenues, up from £1.14bn to £1.29bn. Underlying PBT over the same period was up 72.3% to £96.3m. Service-related and online sales saw a growth of 29% and 44% respectively. The dividend was reduced further to 5p from 6.2p.
In the year ended April 2022, as the UK emerged from the final COVID-19 lockdown, total revenue increased by 6%. Underlying PBT decreased by 9.7% mainly due to higher selling and distribution costs. Selling and distribution costs were 422.9m in 2021 compared to 472.6m in 2022. The dividend rose to 9p.
In the 20-week trading update, from April 2 to Aug. 19, 2022, revenue growth was 9.2%. However, like for like, this was down 1.9%. It would be prudent to compare the numbers to the pre-COVID era of 2020, and revenue has actually grown 11.7%. If you include the acquisitions, revenue has increased by a significant 30.3%.
The companies increasing focus on non-discretionary motoring services is evident in its acquisition of National Tyres in December 2021 (£62). Services-related sales are expected to be 42% in 2023 compared to 26% in 2020. We can expect this to rise further to 48% with the acquisition of Lodge Tyres, announced on Oct. 5, 2022.
Acquisition of Lodge Tyre
Lodge Tyre is in the commercial tyre market, providing automotive services to business-to-business customers. This will increase Halfords’ garage capacity by 8% and mobile vans by 35%. The total consideration of £37.2m on a cash and debt-free basis, revenues in 2021 of £27.4m, and EBITDA of £4.7m gives Lodge Tyre a P/S of 1.36x and EV/EBITDA of 7.9x. Synergies are expected to be £3.8m in EBITDA, if materialized, this would bring the EV/EBITDA down to 4.7x. Halfords’ 10-year average P/S has been 0.6x and EV/EBITDA 6.6x. If the synergies materialize, this will help boost margins.
Risks
Every company is looking down the double-barreled gun of high inflation and the potential of a recession. Employment is still resilient, so not exactly stagflation just yet. We will leave it to readers to decide on the elasticity of demand for spares, repairs, and replacement of tyres. We are inclined to think Halfords can weather this storm. Halfords has been increasing its focus on non-discretionary motoring services and is well-placed as a defensive stock.
We will take inflation and recession risks into account when valuing the company using DCF tools. The company faces potential supply chain and labour risks. These are some standard business risks beyond the scope of our models and will not be individually addressed.
Valuation
Back-testing first
We will be using a cash flow returns on Investments based DCF valuation tool to derive an intrinsic value of Halfords. Let’s first back-test our model assumptions before we project forward. The lower part of the figure below shows the returns profile and above it is the share price highs and lows (the blue band) and the model-driven valuation, the orange line. The returns profile follows closely the company’s ability to destroy or create wealth over time. This is evident in our case where the returns and the share price follow very similar trajectories. We all know that the last couple of years are exceptions. In the valuation chart, the valuation follows closely with the share price band.
Back-testing Valuation with Returns (ROCGA Research)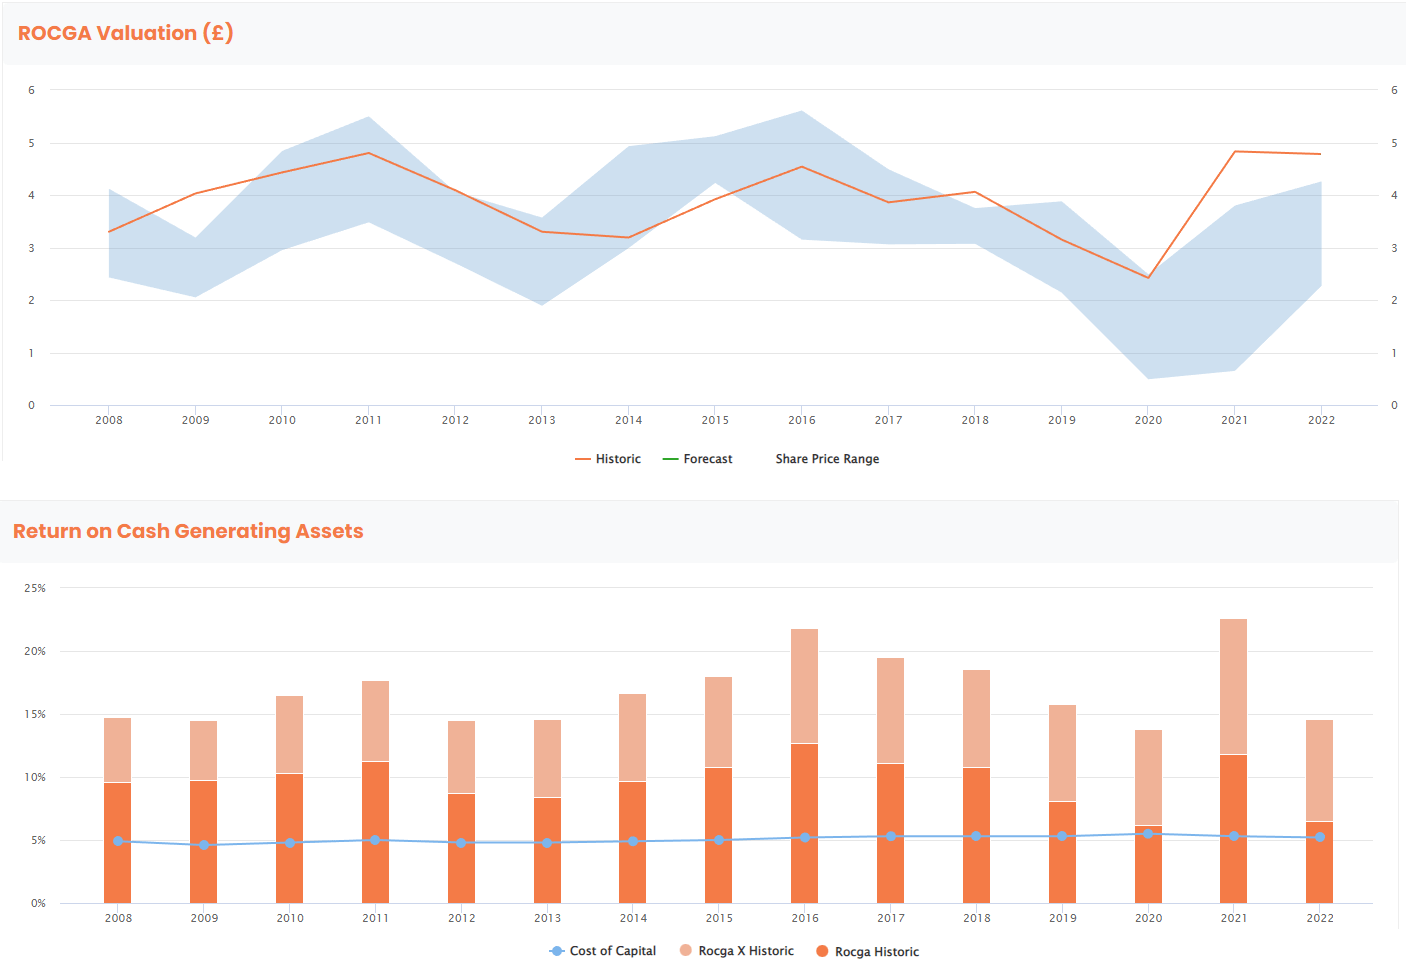
The dark orange bars are the returns on cash generating assets, and the lighter orange bars are the returns on cash generating assets, excluding goodwill. They help calculate the total value of the company as the sum of the present value of existing assets (using ROCGA) and the present value of growth opportunities (using ROCGA-x). The blue line is the WACC. This is calculated by starting with 0.8 unleveraged betas for all companies, calculating the leveraging beta for the company in question and then applying the CAPM. The interest used is the actual company average over the last four years.
The model takes the company returns and fades them to the WACC over a period of time while discounting the cash flows over that period. We see a significant correlation between the historic share prices and the valuation, in turn giving us confidence that most market assumptions are being captured within the model. As mentioned earlier, 2021 and 2022 have to some extent need to be treated as outliers.
Valuation going forward:
We can now use the same model and assumptions to project forward. Under normal circumstances, using consensus estimates for the forecast years is sufficient to derive an intrinsic value. However, we know the landscape is changing again and we have to take into account the macroeconomic risks thrown up by higher inflation and an economic slowdown. We add 2% to the risk premium, setting WACC to 7.2%, and also significantly reduce the system-calculated self-sustainable free cash financed growth projections from 5.6% to 2%.
Valuation forecasting (ROCGA Research)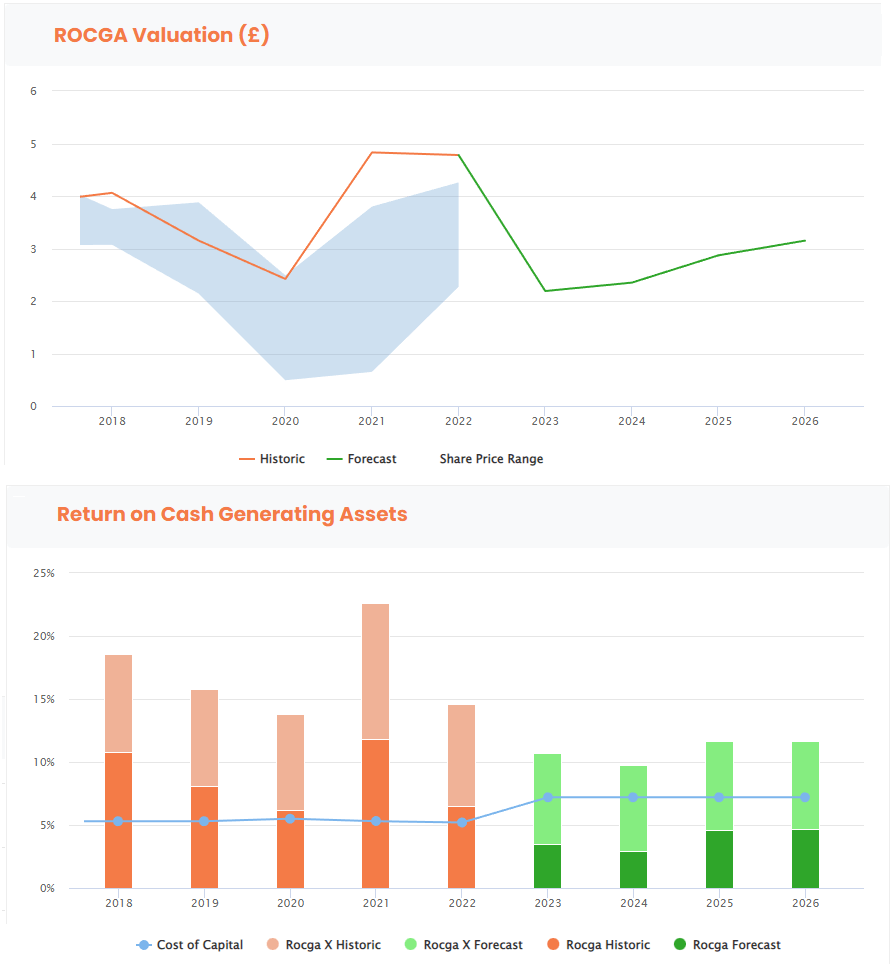
The systematic cash flow returns on investment-based DCF valuation tool points to Halfords intrinsic value being upward of £2.0 per share and surpassing £3.0 going forward. Given the current share price of £1.6, this gives us a potential medium-term upside of 50% and 100% over the longer term. We also see the returns (green bars) improving gradually from 2023 to 2026.
We have not outlined all the workings and assumptions used in our DCF analysis as that would be a thesis in itself. In the future we plan to outline more of the key components of this tool.
FY24 consensus revenue is approximately £1.6bn and EPS is 22.7p. Using Halfords’ 10-year P/S ratio of 0.6x gives us a value of £3.6 and a 10-year average PE of 11x gives us £2.5, both significantly above the current £1.6 per share. Though this is backward-looking, they point in the same direction as our forward-looking DCF valuation.
Company guidance for FY23 underlying PBT is £65m to £75m. Pre-COVID PBT was at these levels last during 2017-18 and the share price then was ranging between £3.0 and £4.5, or equivalent to £2.7 to £4.0 per share if you take into account the additional 22m shares outstanding. These again point in the same direction.
Conclusion
Halfords had been losing the battle against margins, and as a result, the returns and the share price have suffered in the past. We believe Halfords’ strategic acquisitions and diversification to needs-based products and services point to returns and valuation improving over the medium term. The current weakness in the share price makes Halfords an attractive buy, with a potential upside of 50% over the medium term and significantly more over the longer term.
Be the first to comment