

May Lim/iStock via Getty Images
(This article was co-produced with Hoya Capital Real Estate)
Introduction
There are multiple strategies available to ETF investors trying to beat the market as defined by the S&P 500 Index by outperforming the SPDR S&P 500 ETF (SPY). Some are based on style (Growth/Value), others income (High dividend, option writing), or are factor-based like momentum. This article compares two ETFs that equal-weight their Large-Cap focused stocks:
- Goldman Sachs Equal Weight U.S. Large Cap Equity ETF (BATS:GSEW)
- Invesco S&P 500 Equal Weight ETF (NYSEARCA:RSP)
For investors who are concerned that the Top 10 stocks held by SPY are 27% of the portfolio, out of over 500, or that one sector, Technology has a 26% weight, leveling the playing field becomes more attractive. Also, the bottom half of SPY is under 12% of the portfolio, meaning little benefit from over 50% of the stocks held.
Goldman Sachs Equal Weight U.S. Large Cap Equity ETF review
Seeking Alpha describes this ETF as:
GSEW seeks to provide investment results that closely correspond, before fees and expenses, to the performance of the Solactive US Large Cap Equal Weight Index. The index is an equal-weight version of the Solactive US Large Cap Index, a market capitalization-weighted index that includes equity securities of approximately 500 of the largest U.S. companies. GSEW started in 2017.
Source: seekingalpha.com GSEW
GSEW has $613m in assets and provides investors with a 1.7% yield. The managers charge 9bps in fees. Goldman Sachs listed three reasons to consider their ETF:
gsam.com GSEW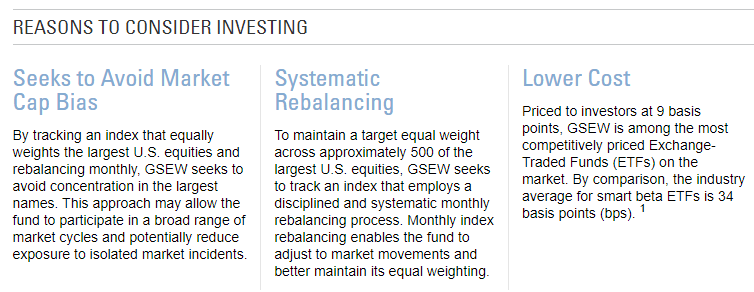
Index review
As with any index-based ETF, due diligence starts there. Solactive describes their indices as:
The Solactive US Benchmark Index Series is calculated and distributed by Solactive AG. The indices aim to track various segments of the US stock market. The index series features Capitalization Weighted and Equal Weight Indices. Both classes are selected according to Free Float Market Capitalization while applying either a Free Float Market Capitalization-based or equal weighting scheme. The indices are adjusted semi-annually in May and November. IPOs can be included additionally on a quarterly basis in case they meet all criteria outlined in the relevant sections of this document. Additionally, Equal Weighted Indices feature a monthly reweighting.
Source: solactive.com Index
In addition, they provide how the index is built, starting with overall criteria that applies to every index in the series.
solactive.com Index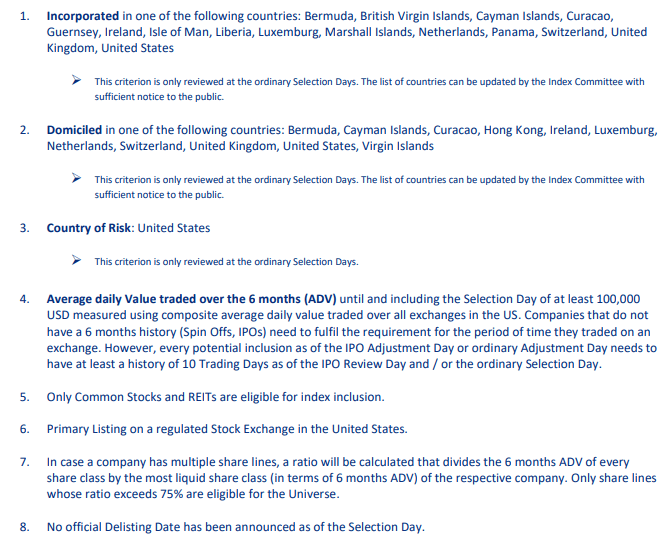
For the index used by GSEW, on each Adjustment Day, the new Index Components of the respective Indices of the Solactive US Benchmark Index Series are weighted equally. Additionally, on each Monthly-Weight-Reset Date all Index Components are equally weighted. The 500 largest companies are added to the index; multiple classes of the same company are permitted. There are also rules to minimize index turnover.
GSEW holdings review
Holdings data provided is before the October rebalancing occurred.
gsam.com sectors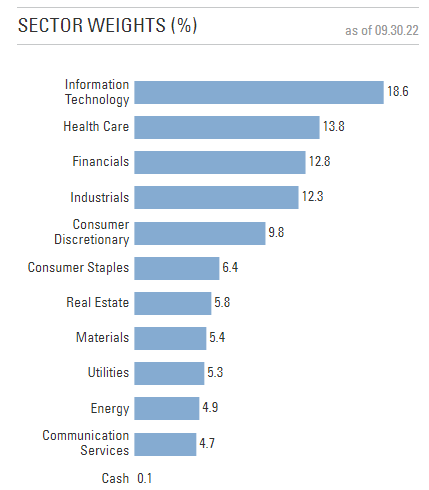
I will leave most of the sector discussion for the comparison section of this article, but will note that Technology stocks are 6% below that of SPY’s weight.
Highest weights on 9/30/22
gsam.com; compiled by Author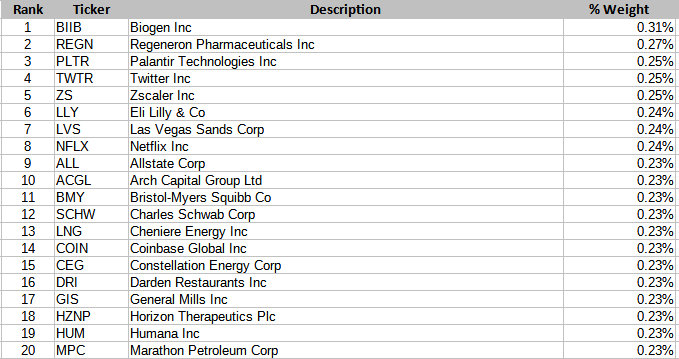
Biogen (BIIB) shot up 33% at the end of September of positive news on Phase 3 Alzheimer’s treatments; rebalancing would have resulted in capturing some of that spike. More on holdings in the comparison section.
GSEW distribution review
seekingalpha.com GSEW DVDs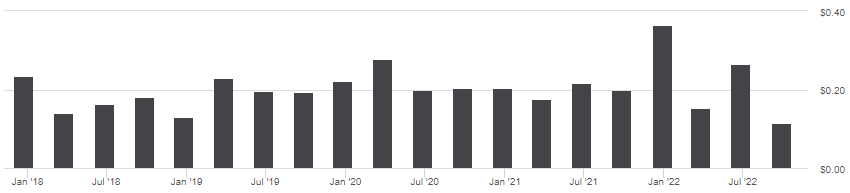
Payouts are wavering around the same level as the initial payout, not a good sign for income keeping pace with inflation. Nevertheless, Seeking Alpha gives GSEW a “B+” grade on this ETF factor.
seekingalpha.com GSEW scorecard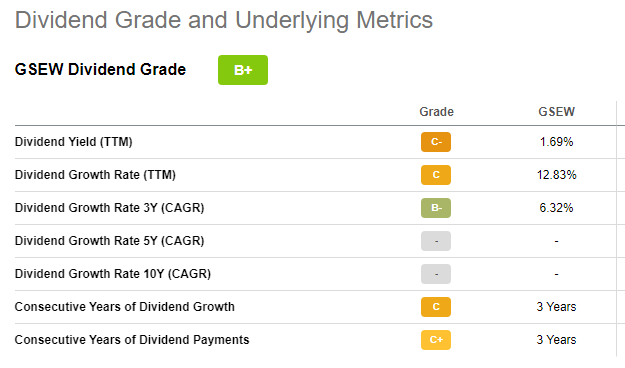
Invesco S&P 500 Equal Weight ETF review
Seeking Alpha describes this ETF as:
RSP seeks to track the investment results (before fees and expenses) of the S&P 500® Equal Weight Index. The fund generally will invest at least 90% of its total assets in securities that comprise the underlying index. RSP started in 2003.
Source: seekingalpha.com RSP
RSP has $30.5b in assets, making it far more popular than GSEW. RSP yields 1.9% and has a 20bps fee, more than twice what GSEW charges its investors. Invesco provides several charts explaining why investors need to own RSP.
invesco.com RSP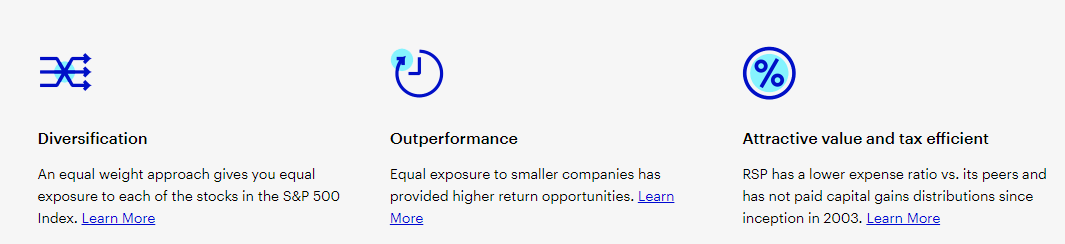
They then provide some charts to emphasise their points. First is, the 2022 vs 2015 increase in the importance of the Top 10 stocks to the S&P 500 Index’s results.
invesco.com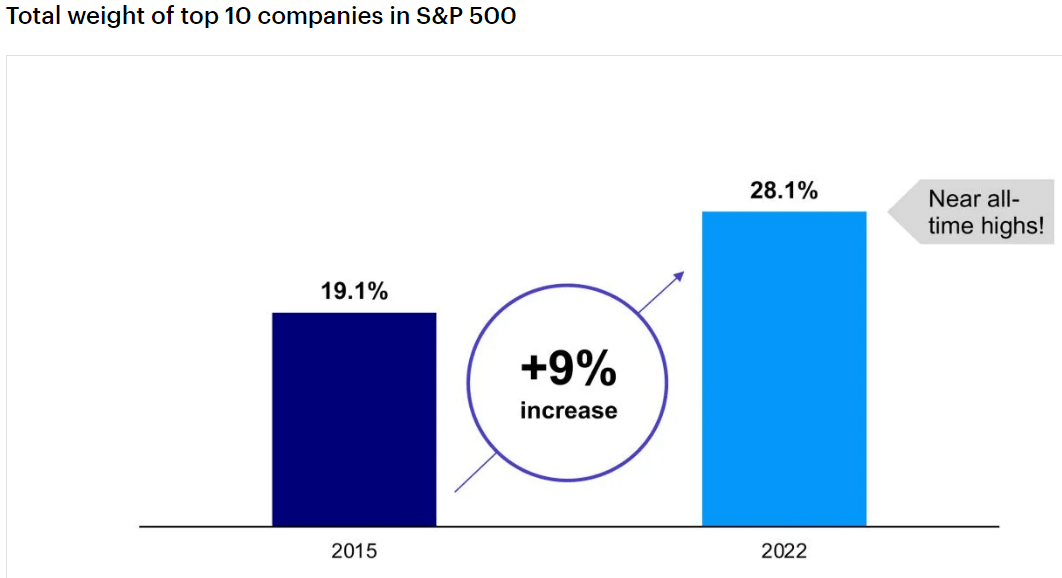
The second one shows while the Top 50 dominate the weighting, the Bottom 50 have performed better; an equal-weighted ETF like RSP would capture much more of that smaller stock results.
invesco.com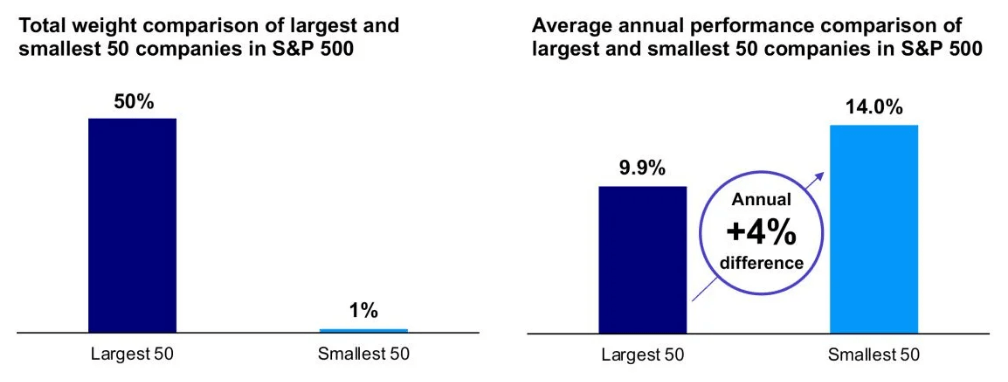
Index review
S&P describes their Index as:
The S&P 500® Equal Weight Index is the equal-weight version of the widely-used S&P 500. The index includes the same constituents as the capitalization weighted S&P 500, but each company in the S&P 500 EWI is allocated a fixed weight – or 0.2% of the index total at each quarterly rebalance.
Source: spglobal.com Index
Two key points:
- stocks are all part of the basic S&P 500 Index
- Stocks are rebalanced each calendar quarter.
RSP holdings review
Like GSEW, the data available pre-dates the rebalancing that would have occurred at the end of September.
invesco.com sectors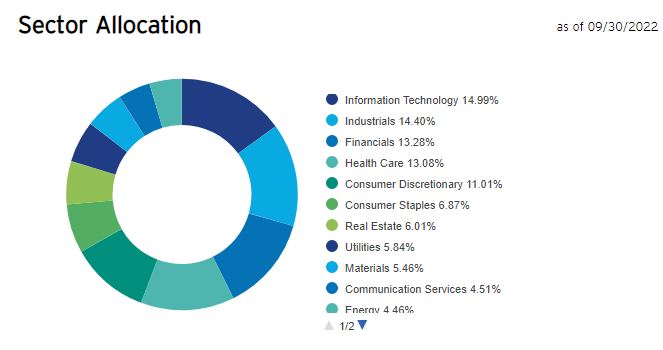
Highest weights on 9/30/22
invesco.com; compiled by Author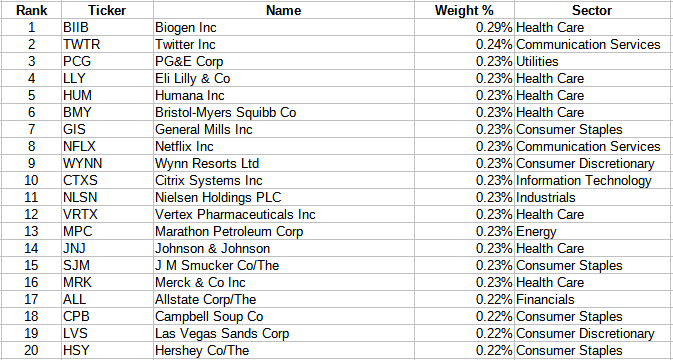
Since GSEW and RSP rebalance on different frequencies, there are differences, subtle, in weights between the two ETFs, which I will show later.
RSP distribution review
seekingalpha.com RSP DVDs
RSP is showing better payout growth recently than what GSEW investors have seen. That said, they only score a “C” on the Seeking Alpha grading scale.
seekingalpha.com RSP scorecard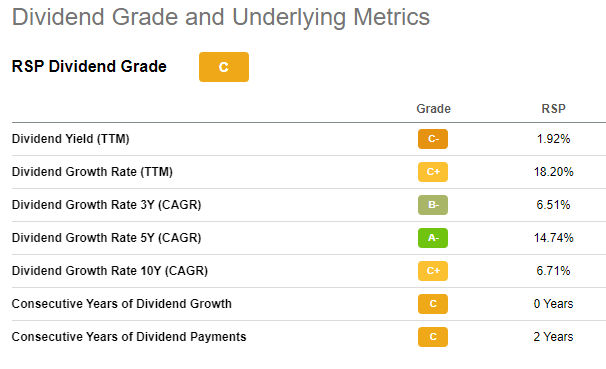
Comparing ETFs
Since the basic concept is replacing some/all one’s SPY holdings with GSEW or RSP, I included SPY in this section too. I start with sectors as I consider that very important since they perform differently as the economic cycle moves along.
Multiple pages; compiled by Author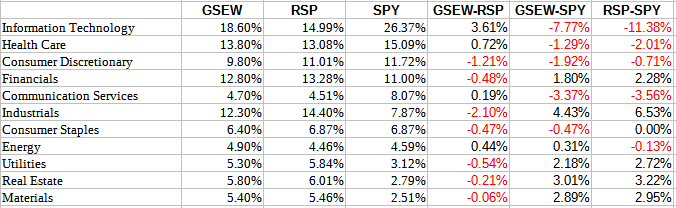
Even though the universes overlap as we will see, the biggest sector weight difference between the two equal-weight ETFs (and vs SPY) is Technology, with RSP having the smaller allocation. Industrials is the only other sector where the two differ by more than 2%, and that is the 2nd largest allocation in RSP. Health Care, #2 in GSEW and SPY, drops to #4 in RSP. Both have eight sectors that differ by 1.8% or more compared to SPY.
After both GSEW and RSP rebalance this month, all their holdings will start out the same (in theory, all at .2%) so the following list for them becomes irrelevant but shows how they moved since the last rebalance date.
Multiple pages; compiled by Author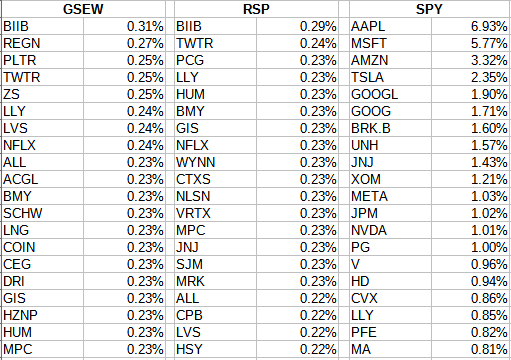
Overlap data
Using the ETFRC.com website, the following overlaps were gleaned.
| Comparison | Weight % | Stock % |
| SPY/RSP | 51% | 100% |
| SPY/GSEW | 49% | 85% |
| RSP/GSEW | 85% | 84%/87% |
While the weight overlap between SPY is close for both ETFs, the stocks in both GSEW and SPY are only 85% the same, reflecting that ETF’s ability to invest beyond the Index, unlike RSP.
Fidelity.com; compiled by Author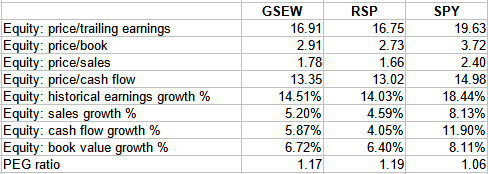
Here we see both equal-weighted ETFs having better Value data, but the Growth data favors SPY. I added the PEG ratio calculation, and it shows SPY to be the best choice; very little difference between the other two.
Portfolio strategy
Since GSEW and RSP have different longevities, separate charts were required.
PortfolioVisualizer.com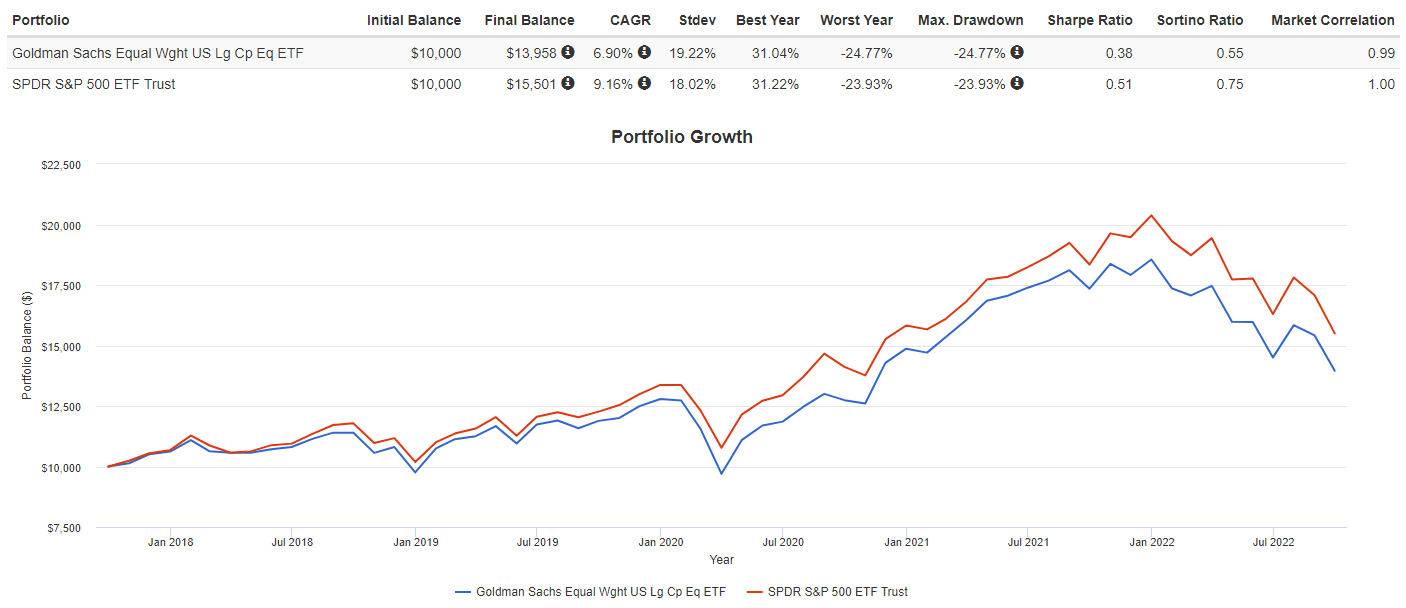
Here, we see that SPY is better in every measure compared to GSEW. That is not the case compared with RSP, which has much more history.
PortfolioVisualizer.com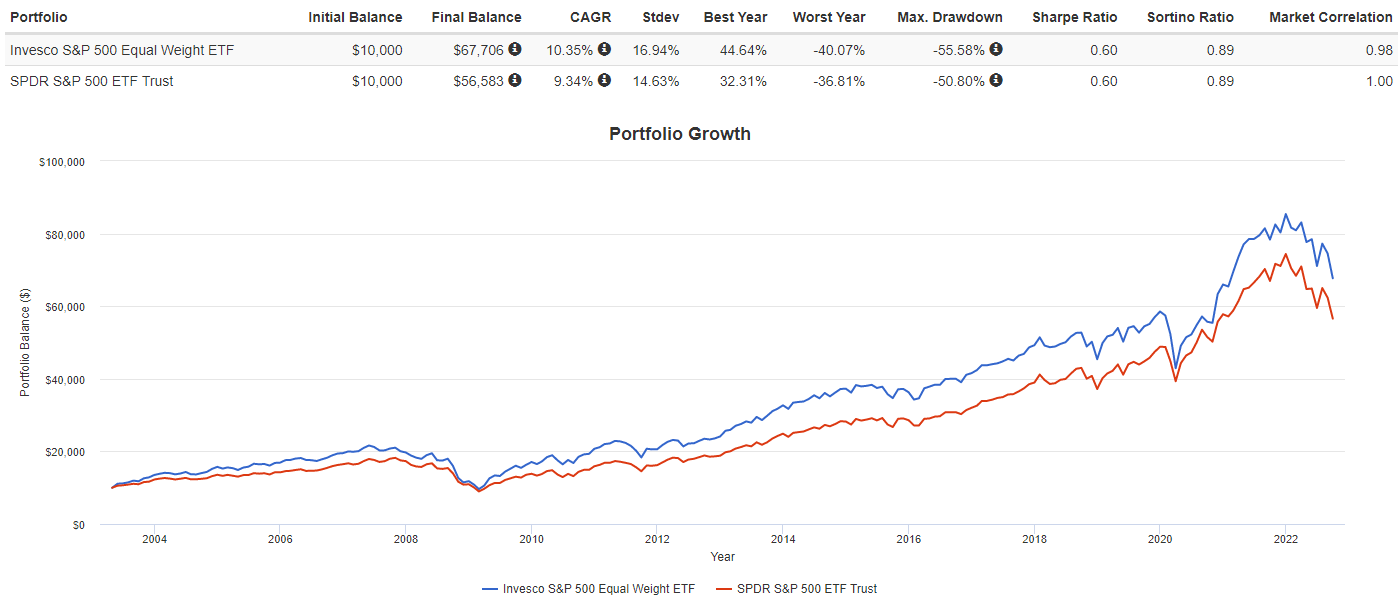
Here RSP wins on return but SPY does on StdDev, giving them a tie on both their Sharpe and Sortino ratios. Finally, all three.
PortfolioVisualizer.com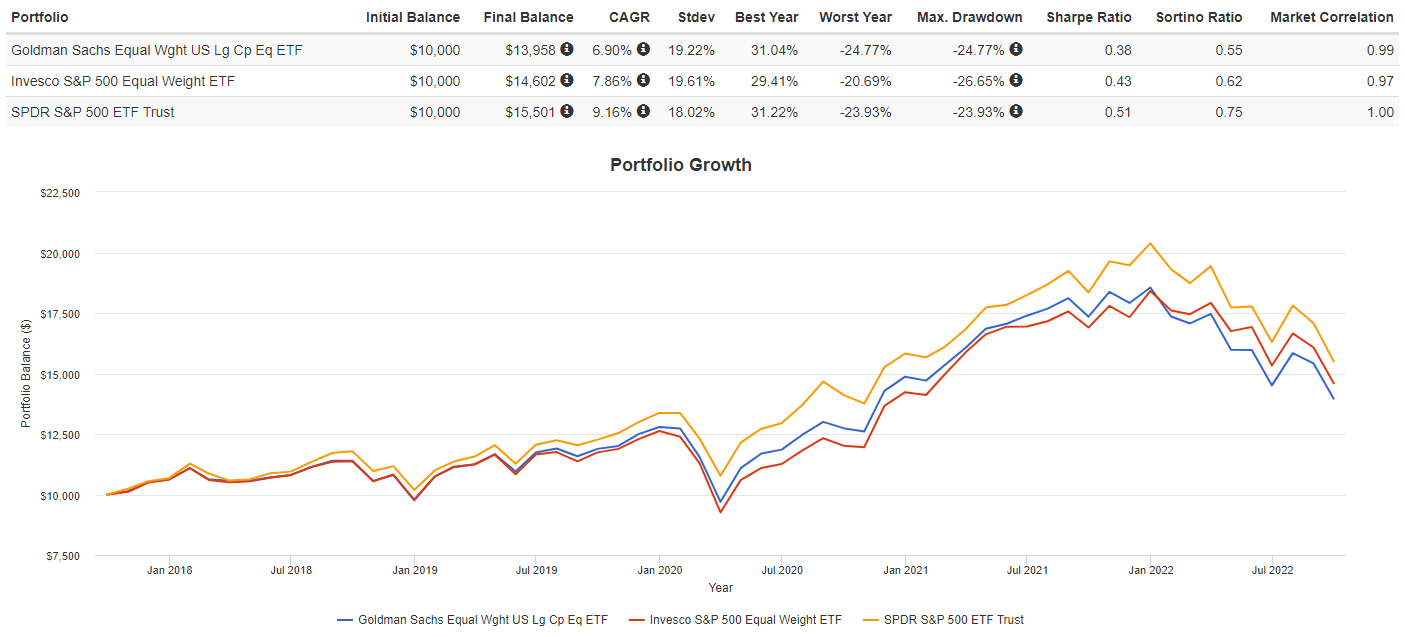
Both trail SPY since GSEW started and the two equal-weighted alternate which was better but overall, the Sharpe and Sortino ratios point to RSP being better. What that seems to indicate is the universe used by GSEW does not provide better investment choices. That might help explain why RSP has almost 50X the AUM as GSEW, the new comer.
Final thought
Since RSP has a longer track record and one that has outperformed SPY, I would pick RSP over GSEW for those looking for an equal-weighted Large-Cap ETF. For those who really like the equal-weight large-cap concept, there is a 2X leverage ETF available: Direxion Daily S&P 500 Equal Weight Bull 2X Shares
Be the first to comment