

erdikocak/iStock via Getty Images
Written by Nick Ackerman, co-produced by Stanford Chemist. This article was originally published to members of the CEF/ETF Income Laboratory on December 1st, 2022.
Gabelli Healthcare & Wellness Trust (NYSE:GRX) has been a fund brought up from time to time. In a more recent article, I posted for another Gabelli fund, it was brought up again. I’ve looked over the fund briefly in the past, but I’ve never fully covered the fund. Today will be my first and initial dive into this healthcare-focused fund.
On the surface, the fund’s discount appears to be quite attractive. This is especially true when considering other healthcare fund peers, such as Tekla Healthcare Opportunities Fund (THQ) and its sister fund Tekla World Healthcare Fund (THW). THW trades at a pretty wild premium. For another “peer,” we also have BlackRock Health Sciences (BME). Although, BME is an options writing fund and not a leveraged fund as GRX and the Tekla funds are.
We will see below that GRX is this group’s laggard. So a wider discount could perhaps be justified.
Another note would be that GRX isn’t solely invested in healthcare names. They invest a great deal into the large caps of the sector but also have exposure to food and other retail staples. That’s where it gets a bit more into the investor’s preference.
Are you really looking for a healthcare fund? Then this might not be the choice. If you are looking for a mostly healthcare fund but some more flexibility outside of the space, then GRX could fit the bill. We also don’t know what future returns will be. Just because the fund underperformed historically doesn’t always mean it will do so in the future.
The Basics
- 1-Year Z-score: -1.63
- Discount: 15.33%
- Distribution Yield: 5.72%
- Expense Ratio: 2.27%
- Leverage: 27.42%
- Managed Assets: $291.78 million
- Structure: Perpetual
GRX’s investment objective is “long-term growth of capital.” It is quite interesting to be structured as a closed-end fund with that goal. For the most part, CEFs are going to be designed to generate income. While that is the stated goal, the fund still delivers a quarterly distribution much higher than you’d get from holding something like the SPDR Healthcare Fund (XLV).
They add that to achieve this goal; they invest in “opportunities for long-term growth presented in the healthcare and wellness industries.”
One thing that caught my attention is the fund’s expense ratio has been climbing.
Ratio of operating expenses to average net assets including liquidation value of preferred shares for the six months ended June 30, 2022 and the years ended December 31, 2021, 2020, 2019, 2018, and 2017 would have been 2.27%, 1.88%, 1.33%, 1.21%, 1.25%, and 1.27%, respectively.
On an absolute basis, going from 1.27% to 2.27% might not sound like much, but on a relative basis, it’s quite a large leap.
The fund’s total expense ratio comes to 3.03%, which is an increase from last year’s 2.24%. One of the reasons for the increases was the fund’s interest expense on preferred shares, going from $800k to $1.6 million. That happened when they issued another Series E preferred. This occurred on October 15th, 2021.
GRX Preferred Leverage (Gabelli)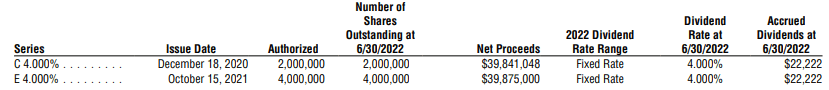
Given the semi-annual reports are posted with data as of June 30th, this would have occurred after their previous semi-annual report. Additionally, with more assets outstanding, that means a large investment advisory fee to be paid too. The benefit of raising more capital, especially at a fixed 4% rate, means that anything over 4% earned by the fund is a net benefit.
As we’ve seen rates rise rapidly in 2022, 4% isn’t looking like a terrible cost now. If they were to try to issue that today, it would have to be much higher.
Also, increasing leverage means the fund’s total size also increases. That can lead to greater trading volume, which can be helpful for investors looking to buy and sell.
The downsides here are that moves lower are also amplified. Anything that the fund doesn’t earn over 4% with this capital means this leverage is costing investors in the common shares.
Performance – Laggard But A Big Discount
As we can see, GRX has underperformed relative to the closed-end fund peers we highlighted at the opening of this article.
YCharts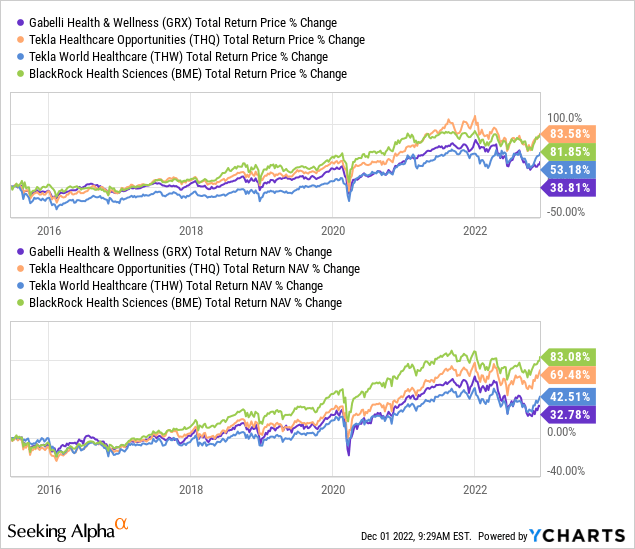
On a YTD basis, the GRX results have been relatively poor. This could be highlighting that the higher focus on healthcare in these other funds is helping support them more firmly. Healthcare is a defensive sector that can get piled into heading into a recession.
At the same time, consumer staples are also generally a defensive play. So the consumer staple exposure that GRX is carrying shouldn’t have been too much of a hindrance in the returns during 2022. The Consumer Staples Select Sector SPDR (XLP) is actually flat YTD, as of the writing, at a decline of 0.26%. So I think we have to also factor in that there was just some poor selection in positioning for the fund overall. The higher expenses will also negatively impact the performance.
YCharts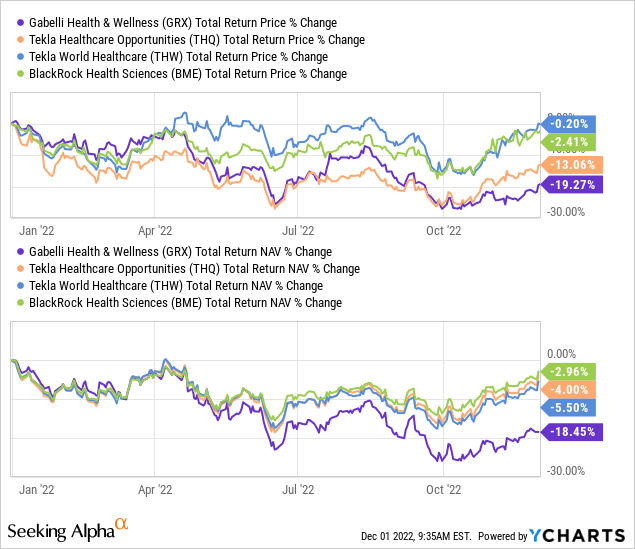
What might be even more interesting to note, outside of just the observation of GRX, is that THW was the second-worst-performing fund. Yet, at this time, it trades at the largest premium. The premium for THW seemed to come during COVID and has just stuck in there. Prior to this, the fund traded at a fairly significant discount regularly.
(The discount for GRX below isn’t 100% accurate because they reported a NAV of $12.39, with a closing price of $10.49. The discount is actually wider at the 15.33% I shared above. It still gives us a relative look at how it compares.)
YCharts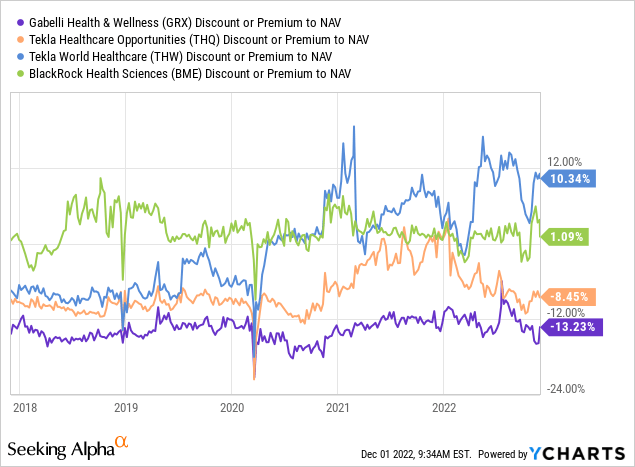
Again, it is important to reiterate that past performance is no guarantee of future results. Therefore, these two laggards could be the big outperformers in the future or not. The past doesn’t tell us what will happen going forward. For THW, that will be a bigger uphill battle as its valuation is overextended. For GRX, it could be a bit easier for them to outperform.
Distribution – Attractive Distribution Yield
For a fund focused on the growth of capital, they payout a generous 5.72% distribution yield. Due to the sizeable discount, this is a big benefit, though, since the fund only has to earn 4.84% to maintain this distribution for shareholders.
I think it is also impressive that they’ve been growing their distribution since 2012 when they initiated a more regular distribution. Aside from investing in CEFs, I’m a big fan of dividend growth stocks, so it naturally draws my attention.
GRX Distribution History (CEFConnect)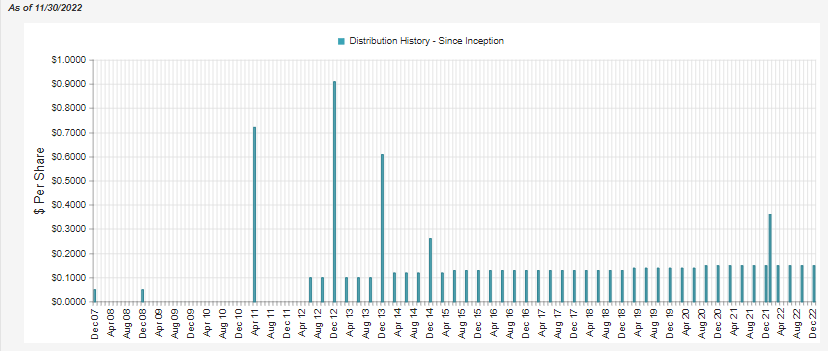
Similar to peers and other equity funds, this fund will generally rely heavily on capital gains to fund the distribution. In fact, the entire distribution will need to be covered through capital appreciation. The reason is that they report negative net investment income or net investment losses.
GRX Semi-Annual Report (Gabelli)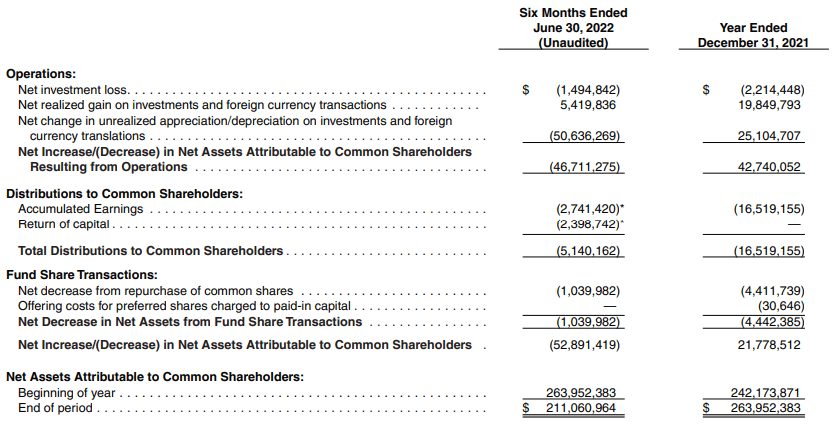
This goes back to the higher expenses; NII is simply the total investment income of the fund minus the fund’s expenses. The expenses eat into the entire income generated from the underlying portfolio.
It isn’t too surprising, either. BME has a materially lower expense ratio and has very limited NII as well. It’s positive, but only just by a bit. In their last semi-annual report, they listed NII coverage as 4.35%. For the entirety of 2021, it was 0.13% for BME. Healthcare stocks pay growing and attractive dividends, but the yields are quite slim. XLV sports a 1.41% yield.
GRX’s Portfolio
The portfolio turnover rate on the fund isn’t that aggressive. Meaning that the portfolio should be fairly predictable in how it is positioned. The last semi-annual report showed a turnover rate of 8%. The highest in the last five years was in 2016, at 34%. All the other years were in between those figures.
At the broader level, the fund’s largest sector exposure is healthcare providers and services. This is then followed by “food.” Then we have pharmaceuticals and healthcare equipment & supplies, both more subindustries of the healthcare sector.
We then have another category that they identify as “food & staples retailing.” Admittedly, I’m not sure what the difference between their food category is and why that’s different from the food in the fifth category weighting.
That gives us 54.3% related specifically to the healthcare industry, which we can see at the top level.
GRX Sector Exposure (Gabelli)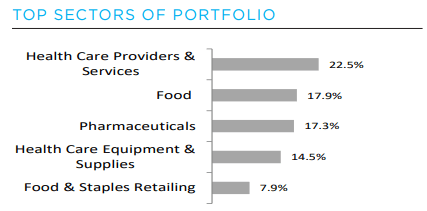
In their annual and semi-annual reports, they break the categories down further. However, this data is as of June 30th, 2022, and the above data is more recent for the quarter that ended September 30th, 2022. For the most part, there weren’t massive shifts but some smaller gyrations.
GRX Industry Exposure (Gabelli)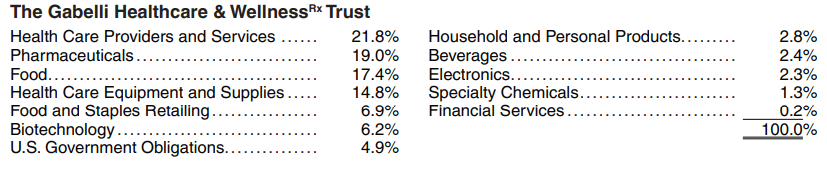
Being familiar with Gabelli’s other funds, I knew that the top ten holdings would have some interesting names. Although a bit surprised that Swedish Match (OTCPK:SWMAF) isn’t included. Perhaps a bit tough justifying it going into a “wellness” fund. For those familiar with Gabelli funds, you might recall that SWMAF is a position in a lot of his funds. In fact, it’s the top position in the Gabelli Global Utility & Income Trust (GLU) fund, a fund heavily tilted towards utilities.
GRX Top Ten Holdings (Gabelli)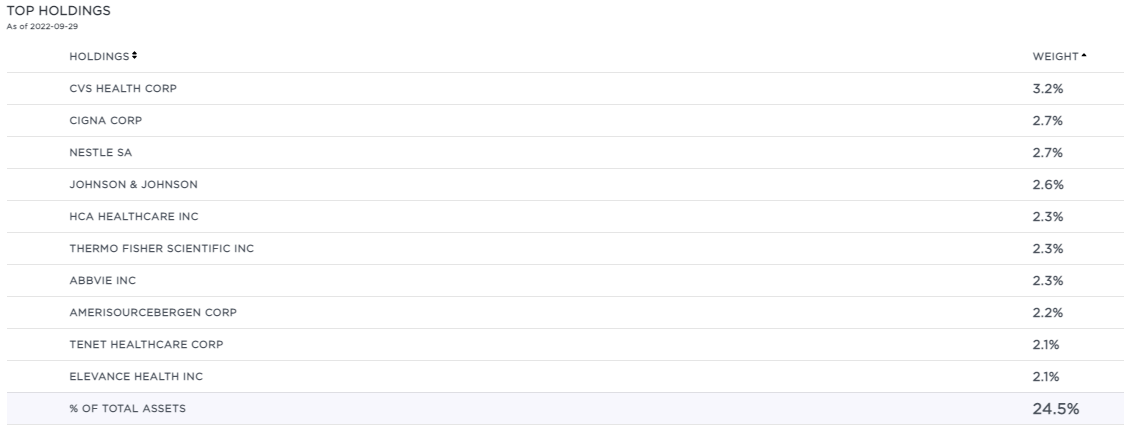
There are several healthcare names that we would expect. CVS Health (CVS), Cigna (CI), Johnson & Johnson (JNJ), Thermo Fisher Scientific (TMO), and AbbVie (ABBV). We also have Elevance Health (ELV). While it is a new name, it was previously Anthem. Those fairly traditional healthcare names make their way into sizeable positions in other healthcare-related funds. Even Nestle (OTCPK:NSRGY), while trading OTC in the U.S., is a stable and popular name. It’s the largest consumer staples food company in the world.
However, it is names such as HCA Healthcare (HCA), AmerisourceBergen (ABC), and Tenet Healthcare (THC) that I’m not overly familiar with. They might be familiar to other people, but I admit, I’ve never heard of these companies. I also don’t recall seeing them in any sort of significant position within the other healthcare funds. I own both THQ and BME.
HCA isn’t any sort of small company, either. They have a market cap of nearly $67 billion. They operate healthcare facilities. However, they aren’t the size of ABBV at a ~$280 billion market cap, nor JNJ at a market cap of around $460 billion. Those are two examples, just to put things into perspective.
ABC is also quite large at a market cap of around $34.5 billion. They are a wholesale drug distributor. THC is fairly small, at less than a $5 billion market cap making it a mid-cap company. They also operate healthcare facilities and medical offices.
On a YTD performance, THC has been a big laggard for GRX. HCA also hasn’t been too strong either. That would be compared to the broader healthcare space represented by XLV being basically flat this year. On the other hand, the drug distribution business would appear to be in full swing. Shares of ABC are crushing the healthcare space.
YCharts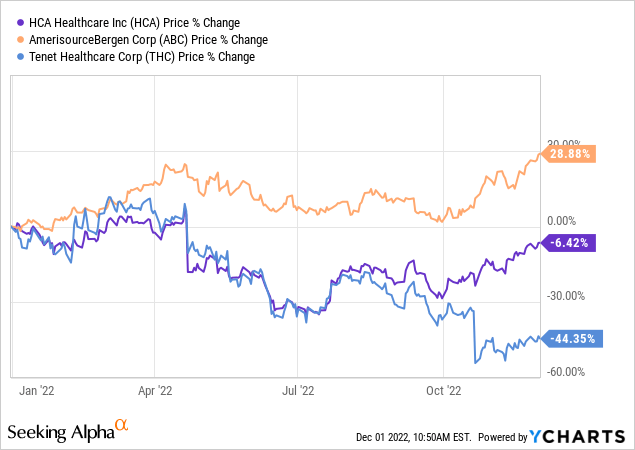
THC seems like a cheap stock on a P/E basis, currently at a forward P/E of 7.55. However, it could be for a reason. The earnings estimates for THC are expected to be negative over the next two years. That’s certainly not likely to be helping the stock price. HCA looks like they’ll post an earnings decline this year but start growing again over the next several years. This could help explain why this company’s P/E is about double at 14.11.
Interestingly, ABC carries a forward P/E similar to that of HCA, coming in at 14.88. Being in a different industry can play a big role in the value that can be assigned to a company. However, ABC also isn’t expected to see any earnings decline for the next several years.
The earnings outlook for ABC:
ABC Earnings Estimates (Seeking Alpha)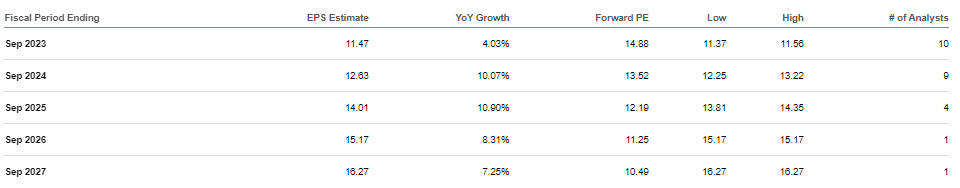
The earnings outlook for THC:
THC Earnings Estimates (Seeking Alpha)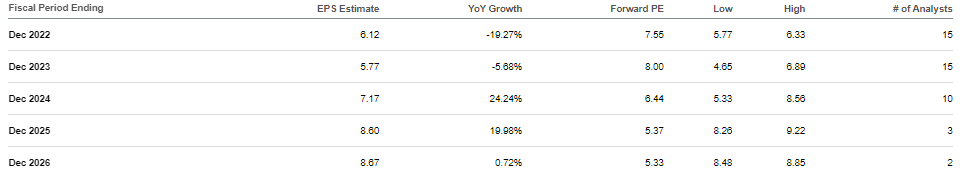
The earnings outlook for HCA:
HCA Earnings Estimates (Seeking Alpha)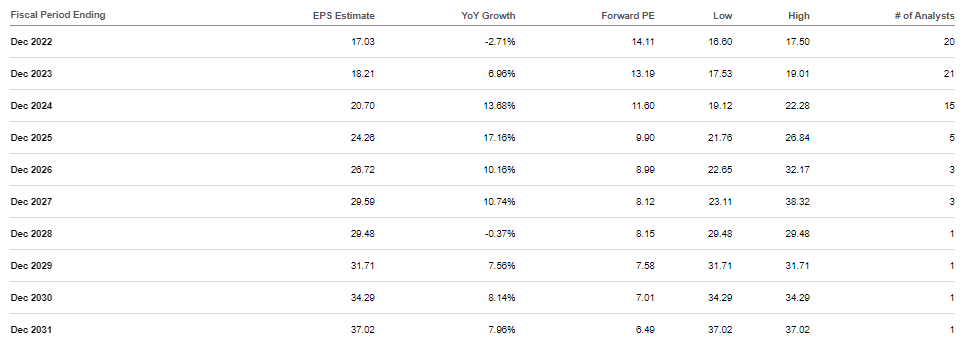
Conclusion
GRX is an interesting closed-end fund at a tempting discount. However, it also is a laggard if you are looking for healthcare exposure. This can help be explained by the fact that it isn’t entirely a healthcare fund but a more flexible fund. It also includes exposure to consumer staples or food stocks. If that is the type of exposure one is looking for, then GRX seems fairly attractive.
I would also say another argument for GRX is Gabelli’s unorthodox portfolios. You will see plenty of names that you see in other peer funds. However, there are always seemingly those more unusual names that one doesn’t hold heavily elsewhere. That can provide some benefits in terms of diversification. Although it is true, the performance hasn’t played out that way. At least historically, this diversification has not been beneficial for GRX.
With that being said, for a more healthcare-focused fund, THQ could offer some investors a more compelling story. The discount is attractive for THQ, even if not as deep as GRX’s.
Be the first to comment