

Galeanu Mihai/iStock via Getty Images
The drivers of the “unprecedented outperformance” of US growth stocks versus US value stocks in the last ten years have been extensively discussed in the literature. However, there is broad consensus that low interest rates and low bond yields have had a major role in what could be one of the most profound market anomalies of the 21st century. In the article, we aren’t interested in why it happened; this usually concerns economists and financial analysts. Rather, we’re interested in what happens next as a result.
I chose to use the S&P 500 Growth and Value indexes (before dividends) for this analysis. There are other indexes used, such as the Russell 1000 Growth and Value indexes, but observations and conclusions are not affected much.
S&P 500 Value Vs. Growth Relative Performance (Price Action Lab Blog – Norgate Data)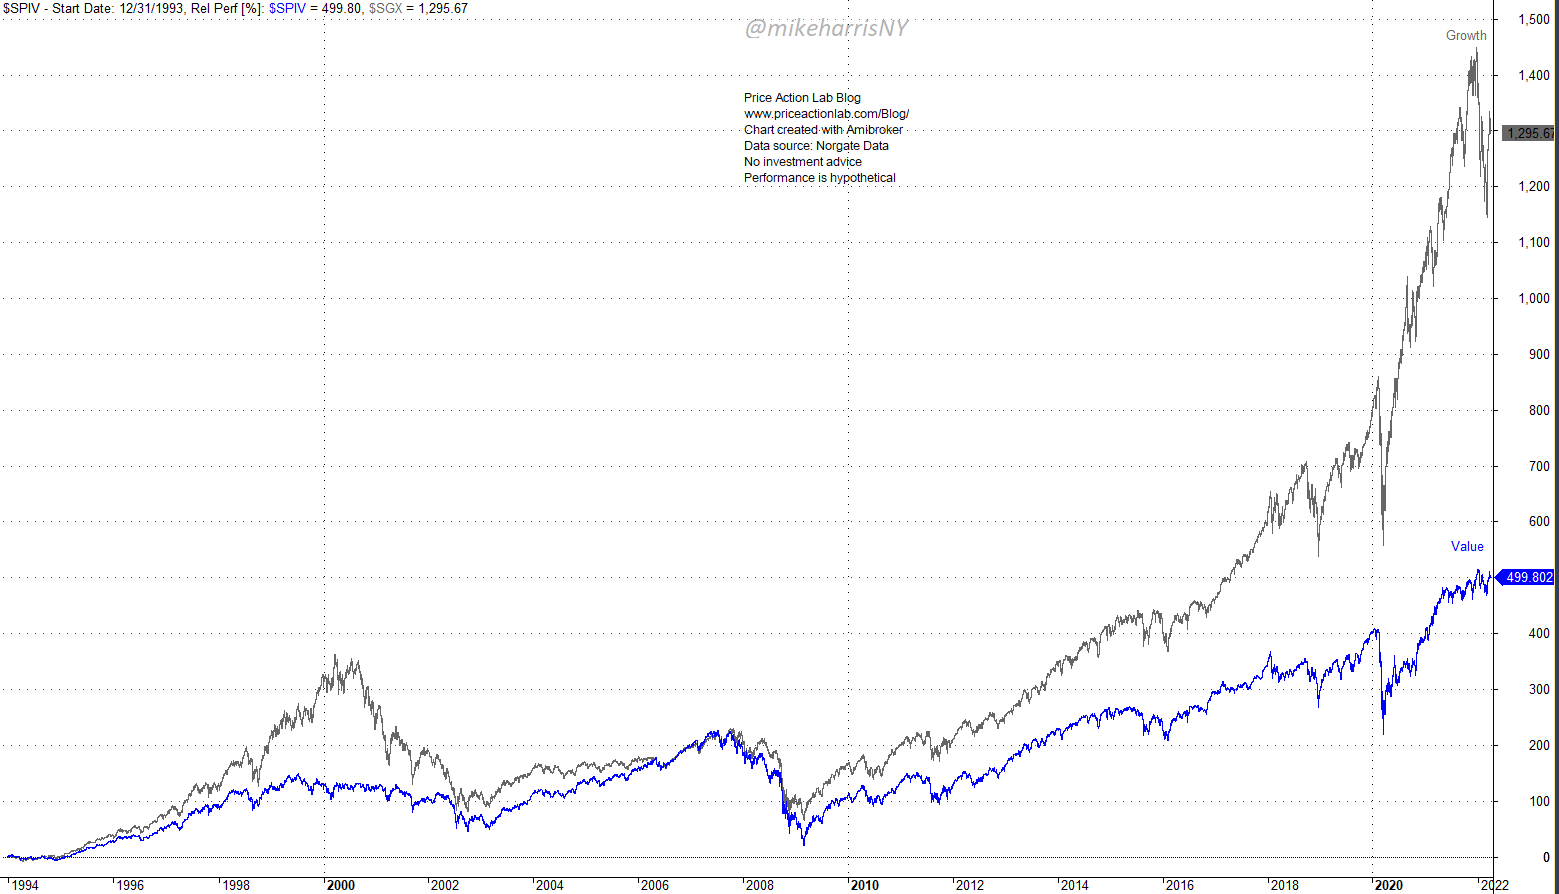
The chart above depicts the relative performance of the S&P 500 (SPX), Value (SPIV), and Growth (SGX) indexes since 1994.
Growth outperformed value, leading to the 2000 dot com top. During the bear market that followed, the outperformance of growth stocks relative to value stocks of about 200% at the top of the dot-com market evaporated, and by mid-2002, it was down by about an order of magnitude to less than 30%.
Although there was a broad equity market recovery after the dot-com bear market bottom, by mid-2007 and near the top of the market before the Great Financial Crisis, growth stocks had barely caught up with value stocks. Indeed, as we’ll see below, the trade of long value and short growth has generated large returns since 2000, all the way up to the end of 2007.
The drawdown profile charts below provide some additional information about growth vs. value performance.
Drawdown profiles of S&P 500 Value and Growth indexes (Price Action Lab Blog – Norgate Data)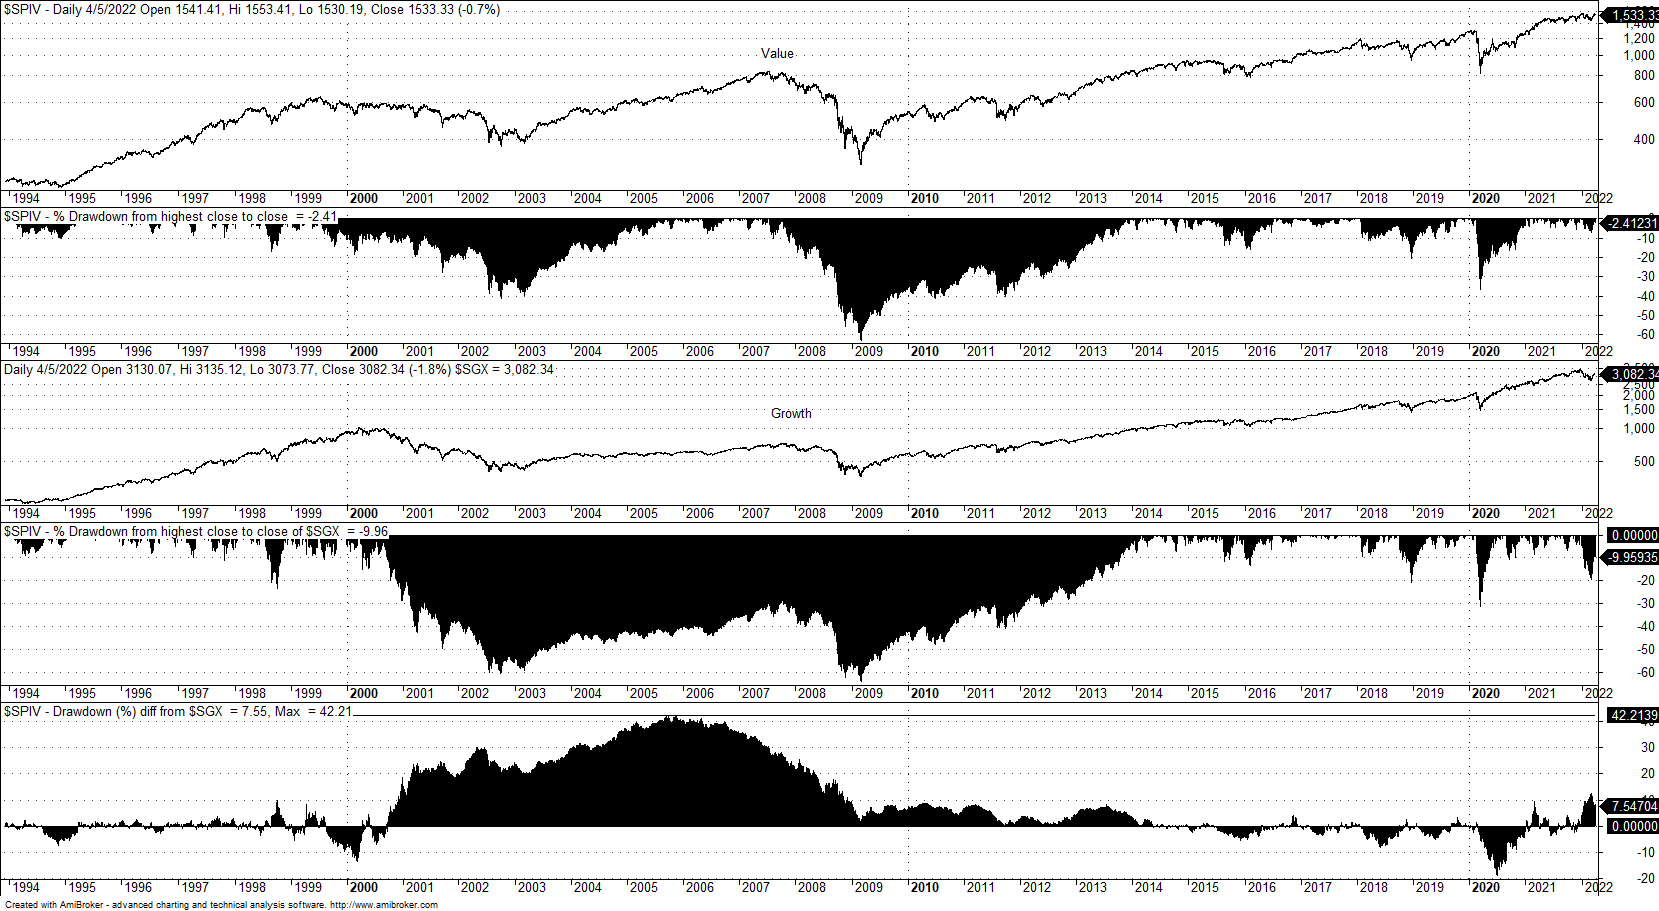
The key and relevant observations are summarized below.
- In the dot-com bear market, the maximum drawdown for value was 40.3%, but for growth it was 60.7%.
- By mid-November 2005, the drawdown difference between value and growth was +42% in favor of the former.
- In the Great Financial Crisis, both value and growth fell about 64% from their highs.
- It took about 13 years for growth stocks to fully recover from the dot-com bear market, but value stocks recovered in about six years.
From (1) and (2) above, we conclude that long value-short growth generated significant returns from 2000 to 2007.
From (3) above, we conclude that when there is a broad market crash due to a financial crisis or other driver that doesn’t affect value and growth asymmetrically, the drop is similar.
Now to the most important part of this article: is the unprecedented outperformance of growth vs. value an indicator (leading) of a bear market?
Given that the key drivers that caused the outperformance have been “neutralized” in a sense, referring to low interest rates and bond yields, the probability of a bear market due to spillover from growth performance neutralization is now much higher. In fact, I have argued in another SA article, that the collapse of ARK Innovation ETF (ARKK) from its highs may be a leading indicator of a bear market.
The chart below depicts the S&P 500 Value to Growth indexes and the difference in cumulative rate of return since 1994.A regression in the rate-of-return is used to derive the minus-one and minus-two standard deviations. This is financial alchemy as regression is a dubious operation when dealing with financial series, but it is used here for the purpose of establishing hypothetical retracement levels.
S&P Value Vs. Index Ratio and Cumulative ROR Difference With Linear Regression (Price Action Lab Blog – Norgate Data)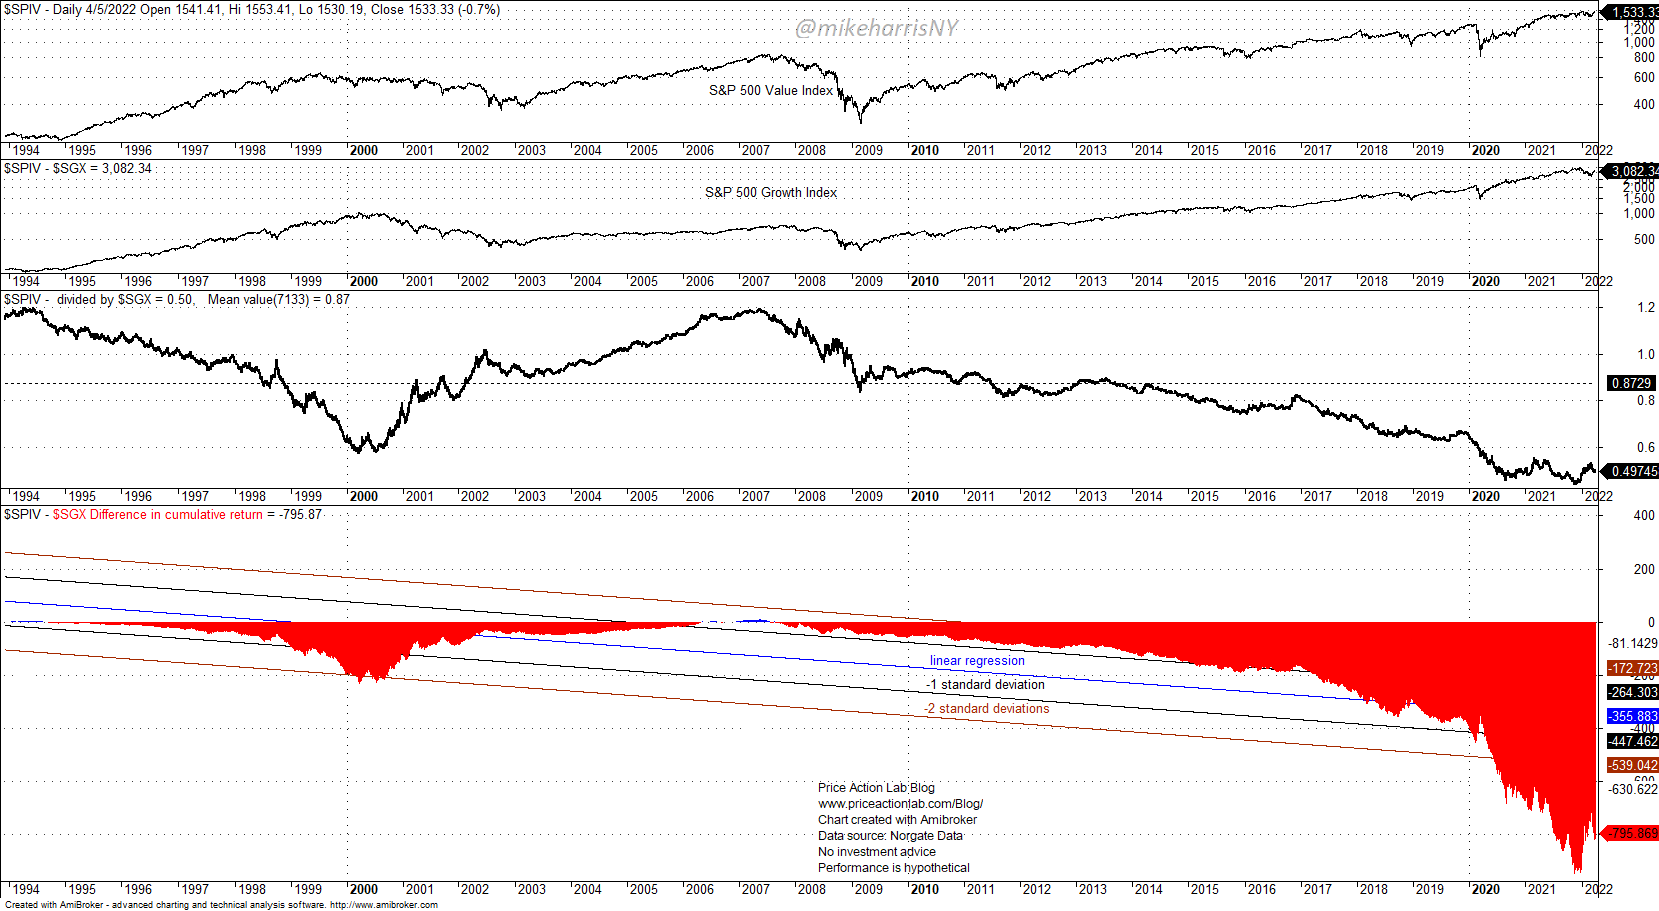
From the ratio indicator, it may be seen how growth outperformed going to the 2000 top and then the dramatic recovery of value going to the 2007 top. After the 2007 top, growth started outperforming again, reaching a maximum in December 2021.
The linear regression line of the cumulative rate-of-return difference ends at -335.8%. Minus-one standard deviation is at -447.5% and minus-two standard deviations is at -539%.
The most conservative target is a mean-reversion towards minus-two standard deviations. This will equate to a relative +36% gain in value.
A mean-reversion to minus-one standard deviations will equate to about +50% relative gain in value.
Full mean-reversion to the linear regression line will equate to about a +63% gain in value.
There is no way to know the magnitude of the relative correction as that may be driven by unknown factors at this time, such as the speed of the increase in interest rates and the rise in bond yields. The potential range is probably between +30% and +60% in favor of value.
Note that both value and growth will fall in a bear market, but the long/short factor value to growth has the potential to generate high returns in such an environment.
Be the first to comment