

Miro Nenchev
Grindrod Shipping’s (NASDAQ:GRIN) stock price increased by 14% in the past month. On the demand side, due to high commodity prices, high inflation, and global economic challenges, the dry bulk shipping market outlook is not as strong as before. However, due to higher dry bulk seaborne tonne-mile demand as a result of the current trade route substitution, TCE rates are supported. Also, on the supply side, due to low fleet growth and environmental regulations, TCE rates will likely remain attractive. The stock is a hold.
1H 2022 results
In its 1H 2022 financial results, GRIN reported revenue of $272 million, compared with 1H 2021 revenue of $178 million. GRIN’s handysize vessel revenue increased from $61 million in 1H 2021 to $89 million in 1H 2022. Its supramax/ultramax vessel revenue increased from $144 million in 1H 2021 to $151 million in 1H 2022. The company’s voyage expenses, vessel operating costs, and charter hire costs in the first half of 2022 were slightly higher than in the first quarter of 2021. In 1H 2022, GRIN reported handysize and supramax/ultramax TCE per day of $24990 and $27604, respectively. In 1H 2021, GRIN reported handysize and supramax/ultramax TCE per day of $15285 and $17606, respectively.
The company’s gross profit increased from $48 million in 1H 2021 to $105 million in 1H 2022. Profit for 1H 2022 attributable to the owners of the company was $86 million, or $4.45 per diluted share, compared with $22 million, or $1.13 million per diluted share in 1H 2021. The company’s net cash flow generated from operating activities increased from $102 million in 1H 2021 to $138 million in 1H 2022. Its cash and cash equivalents on 30 June 2022 were $160 million, compared with $58 million on 30 June 2021. GRIN’s adjusted EBITDA from continuing operations increased from $65 million in 1H 2021 to $124 million in 1H 2022.
Furthermore, it is worth noting that on 10 May 2022, the company exercised the purchase option on the chartered-in 2015-built supramax bulk carrier, IVS Pinehurst, for an amount of $18.0 million with delivery on 25 July 2022. Also, on 1 June 2022, GRIN sold the 2016-built medium range product tanker, Matuku, for a gross price of $30.0 million.
The market outlook
According to the MMI daily iron ore index report, published on 20 October 2022, total iron ore inventories at china ports decreased from more than 135 million tonnes to below 130 million tonnes in recent weeks (see Figure 1). Moreover, Chinese rebar production decreased in the past few weeks. However, Chinese and hot-rolled coil production increased (see Figure 2). We can see that Chinese rebar and hot-rolled coil consumption increased in October.
Figure 1 – Total iron ore inventories at china ports
MMI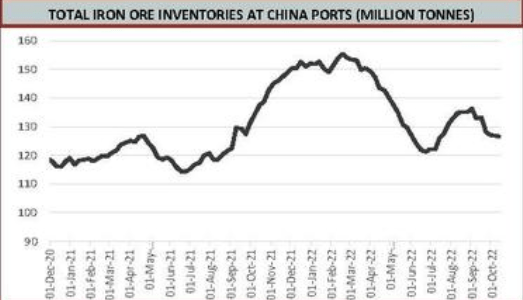
Figure 2 – Chinese steel consumption and production
MMI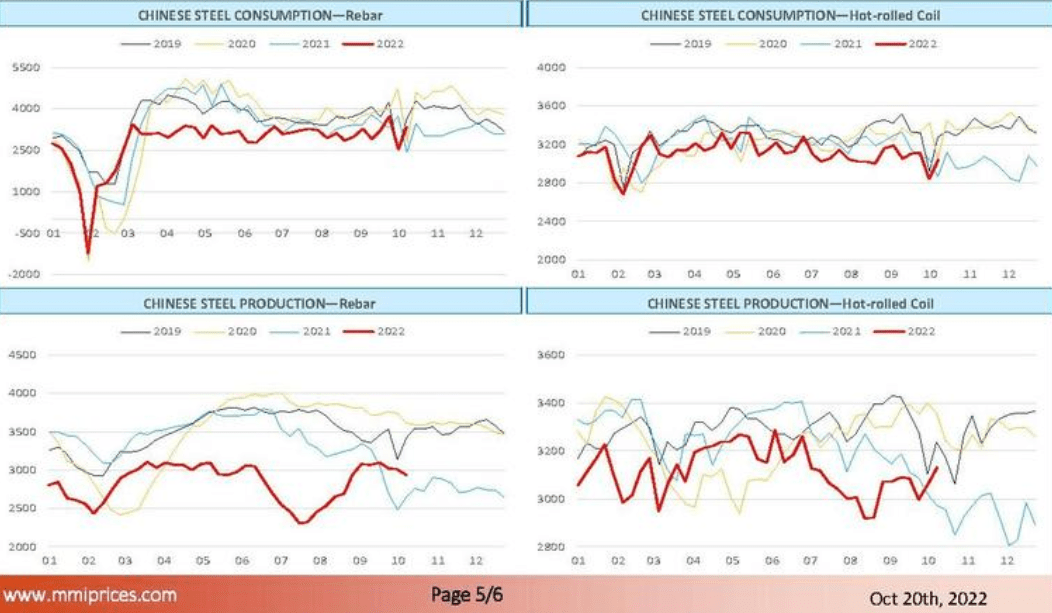
According to Figure 3, the Baltic Dry Index increased from 965 on 31 August 2022 to 1819 on 21 October 2022. However, the current level of the Baltic Dry Index is significantly lower than in October 2021.
Also, the demand for coal remains high as natural gas prices in the European Union hiked as a result of the war in Ukraine. Figure 4 shows that coal prices skyrocketed in 2022 due to increased demand. The war in Ukraine is still going on. Due to hiked natural gas prices, the demand for coal will most likely remain high. Recently, some European countries have announced plans to reactivate old coal power plants. Thus, the increased demand for coal will support the dry bulk shipping market in my opinion. To summarize, on the demand side, due to the war in Ukraine (which has negatively impacted flows of certain dry bulk commodities) and weak economic conditions (which have decreased iron ore demand), the dry bulk market is not as strong as a year ago. However, as the European Union has banned coal imports from Russia, the tonne-mile demand has increased as countries are trying to import coal from further afield. Drybulk seaborne tonne-mile demand is expected to increase by 2.1% in 2023 (see Figure 5).
Figure 3 – The Baltic Dry Index
tradingeconomics.com
Figure 4 – Coal price
tradingeconomics.com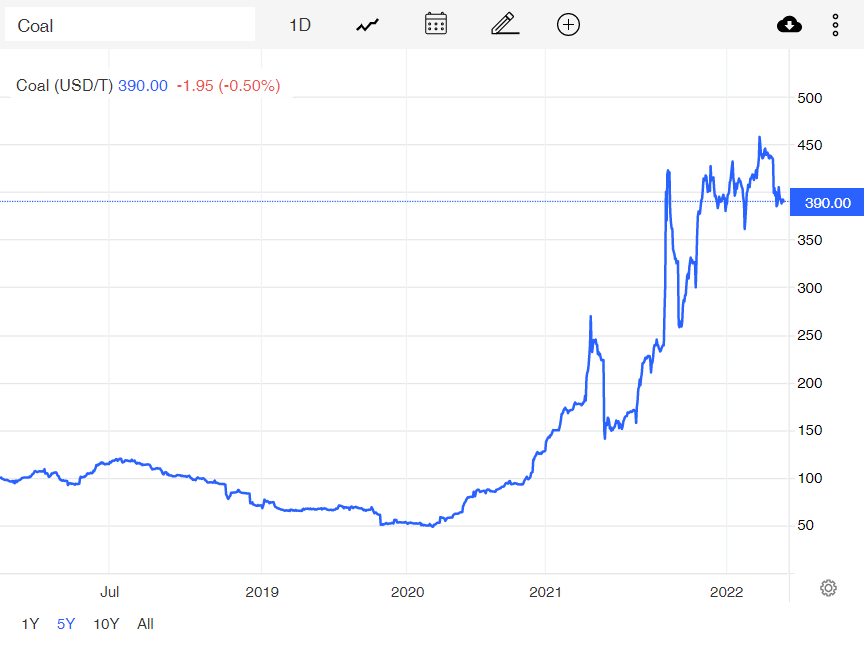
Figure 5 – Drybulk seaborne tonne-mile demand
2Q 2022 presentation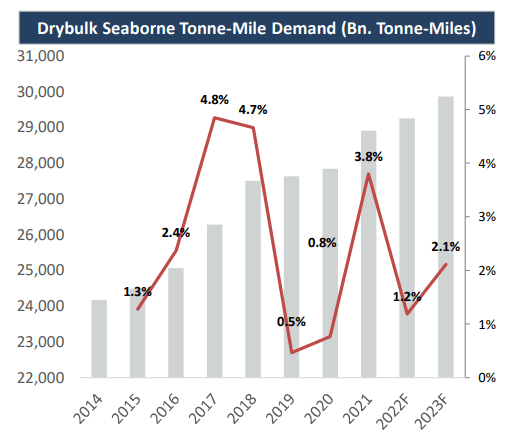
On the supply side, dry bulk fleet growth is expected to decrease to 0.7% in 2023 (see Figure 6). Also, the dry bulk orderbook is shrinking to multi-decade lows. Handysize and supramax orderbooks are 5.6% and 7.8% of the fleet, respectively. Thus, due to the low vessel supply growth, combined with limited shipyard spare capacity and environmental regulations in 2023, TCE rates will remain attractive.
Figure 6 – Drybulk fleet trends
2Q 2022 presentation
Performance outlook
As of 30 June 2022, GRIN had total debt, total cash, and net debt of $209 million, $170 million, and $40 million, respectively. According to Figure 7, the company’s low debt maturities before 2025, will help GRIN to address potential growth opportunities in the following years. However, to mitigate financial stability risks, the company has to be able to cover its obligations.
In this detailed analysis, I have investigated GRIN’s performance across the board of leverage ratios. Leverage ratios could be very insightful to show how the company is financing its assets and business operations. In other words, does it use debt or equity financing for most of its operations? I used some common leverage ratios that have significant comparability to its debt. The ratios are calculated in comparison with previous years to be more helpful.
The debt-to-assets ratio is one of the significant calculations that measures the company’s debt capacity. This ratio indicates the proportion of assets that are being financed with debt. Thereby, the higher the ratio, the greater the degree of leverage and financial risks. It is observable that after a modest increase to 0.43 in March 2020, the debt-to-asset ratio of GRIN decreased to 0.37 in June 2022. Moreover, GRIN’s debt-to-EBITDA ratio, which determines the probability of defaulting on debt, decreased from 5.68 in 1Q 2022 to 4.00 in 2Q 2022. Finally, the company’s asset-to-equity ratio decreased to 1.77 on 30 June 2022 from its previous level of 1.92 at the end of March 2022. The company’s asset-to-equity ratio is still high; implying that GRIN has funded a greater portion of its assets by issuing debt than by equity. However, the company is trying to decrease its asset-to-equity ratio and manage its risks. Altogether, the leverage ratios of GRIN indicate the company’s solvency and its ability to meet its current and future obligations (see Figure 8).
Figure 7 – GRIN’s debt amortization and maturity profile
2Q 2022 presentation
Figure 8 – GRIN’s leverage ratios
Author (based on SA data)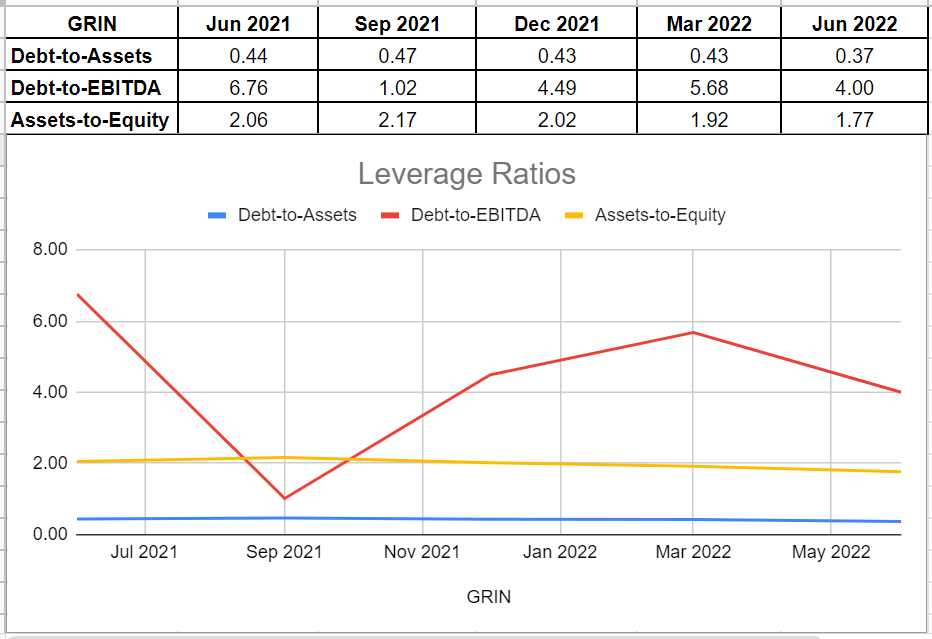
Summary
Increased interest rates in western countries caused their iron ore imports to decrease, and with current fiscal and monetary policies to combat inflation, I do not expect the United States and European countries’ iron ore demand to increase in the following months. However, due to higher tonne-mile demand, decreased handysize and supramax orderbooks, environmental regulations, and limited shipyard spare capacity, I think TCE rates will remain attractive. Thus, GRIN’s time charter contracts will be profitable. The stock is a hold.
Be the first to comment