

Vertigo3d
Earnings of Great Southern Bancorp, Inc. (NASDAQ:GSBC) will likely continue to grow this year, mostly on the back of mid-single-digit loan growth. Further, the large balance of loans indexed to LIBOR and prime rates will lead to higher interest income amid a rising rate environment. Meanwhile, provisioning for expected loan losses will remain subdued because of the portfolio’s exceptional credit quality. Overall, I’m expecting Great Southern Bancorp to report earnings of $5.89 per share for 2022, up 8% year-over-year. For 2023, I’m expecting earnings to grow by a further 9% to $6.40 per share. The year-end target price suggests a small upside from the current market price. Based on the moderately-high total expected return, I’m adopting a buy rating on Great Southern Bancorp.
CRE Loan Growth to Make Up for the Anticipated Slowdown in Residential Loans
Great Southern Bancorp’s loan portfolio grew by a remarkable 9% during the first half of 2022, or 18% annualized. This growth was broad-based across the chief loan segments, as mentioned in the earnings release. Going forward, I’m expecting loan growth to slow down because of several factors, especially high interest rates.
Great Southern Bancorp focuses on commercial and residential real estate. The bank mainly caters to customers in Missouri, Iowa, Kansas, Minnesota, Nebraska, and Arkansas. However, it operates in several other states as well. As a result, it is best to take national averages when attempting to determine future demand for the company’s loan products.
Residential real estate loan growth will most probably decelerate in the second half of the year because of high interest rates. Further, real estate prices are still very high from a historical perspective despite the recent downturn.
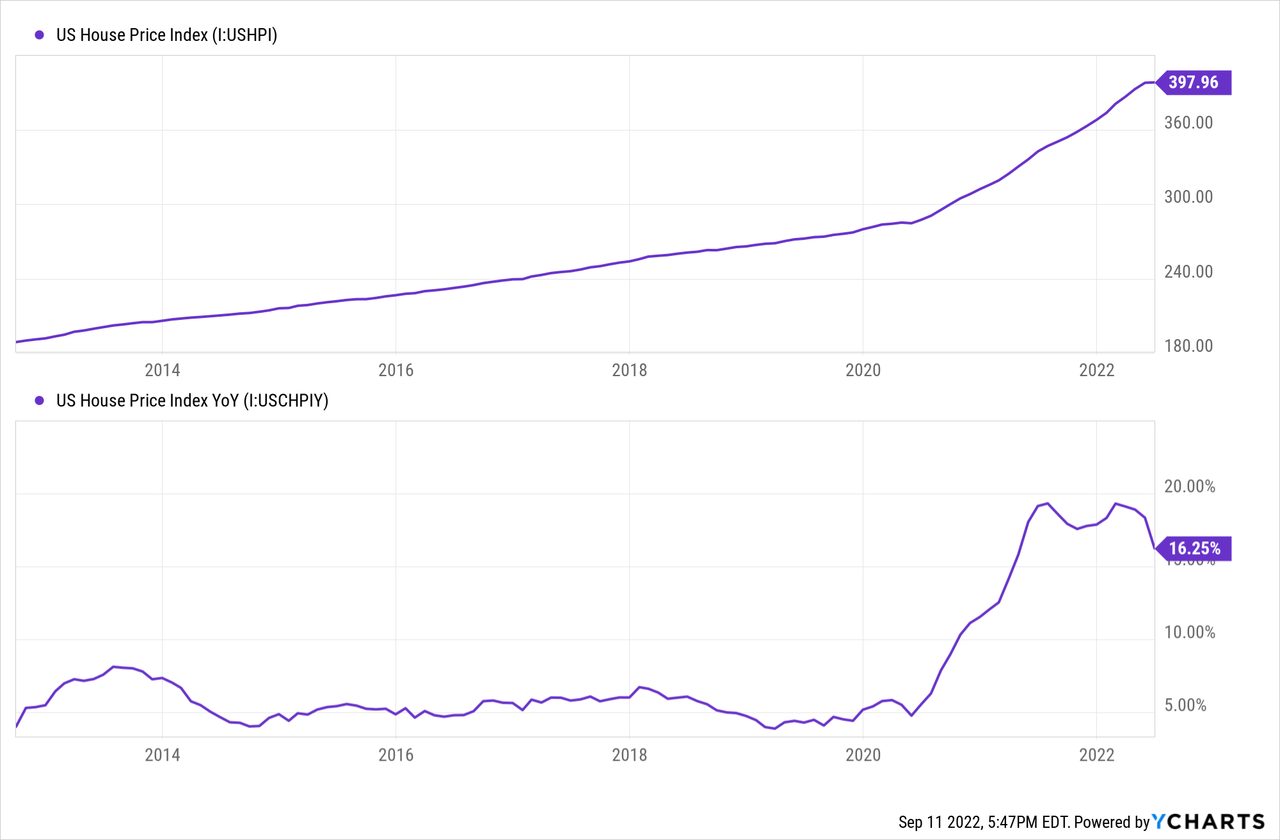
Additionally, the Mortgage Bankers Association expects mortgage purchase volume to decline this year and then grow by only a moderate 4% next year.
Mortgage Bankers Association
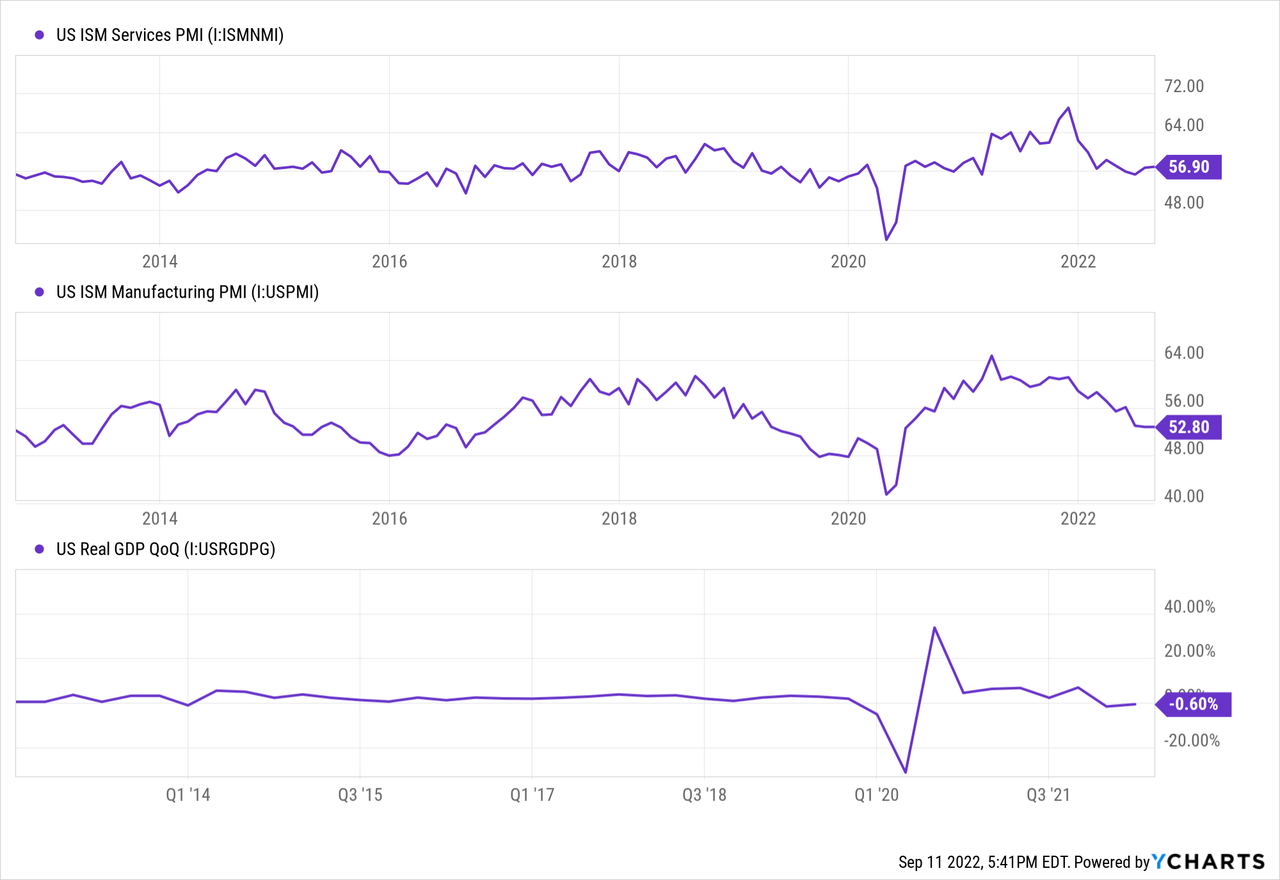
On the other hand, I’m expecting commercial real estate loan growth to remain strong. This is because the purchasing managers’ index indicates that commercial activity is in an expansionary state, despite the overall GDP decline.
Considering these factors, I’m expecting the loan portfolio to grow by 4% annualized every quarter till the end of 2023. Historically, as well the loan portfolio has grown in the mid-single-digit range.
The growth of other balance sheet items will mostly match loan growth. However, equity book value will face pressure from rising interest rates and the resultant hit to the market value of the available-for-sale securities portfolio. The unrealized mark-to-market losses will continue to flow directly into the equity account, bypassing the income statement. The equity book value has already dropped to $44.53 per share at the end of June 2022 from $46.09 at the end of June 2021 and $45.65 at the end of March 2022. The following table shows my balance sheet estimates.
| FY18 | FY19 | FY20 | FY21 | FY22E | FY23E | |
| Financial Position | ||||||
| Net Loans | 3,989 | 4,154 | 4,297 | 4,008 | 4,449 | 4,630 |
| Growth of Net Loans | 7.0% | 4.1% | 3.4% | (6.7)% | 11.0% | 4.1% |
| Other Earning Assets | 338 | 504 | 904 | 1,137 | 851 | 885 |
| Deposits | 3,725 | 3,960 | 4,517 | 4,552 | 4,607 | 4,794 |
| Borrowings and Sub-Debt | 398 | 412 | 340 | 239 | 426 | 443 |
| Common equity | 532 | 603 | 630 | 617 | 579 | 639 |
| Book Value Per Share ($) | 37.3 | 42.1 | 44.6 | 45.1 | 45.6 | 50.4 |
| Tangible BVPS ($) | 36.7 | 41.5 | 44.2 | 44.7 | 44.8 | 49.5 |
|
Source: SEC Filings, Author’s Estimates (In USD million unless otherwise specified) |
Margin’s Moderate Rate-Sensitivity Attributable to the Loan Mix
Around 28% of the loan portfolio is tied to 1-month or 3-month LIBOR and another 16% of the portfolio is linked to the prime rate, according to details given in the 10-Q filing. Therefore, around 44% of the loan portfolio is likely to re-price within only a few months of a rate hike.
Unfortunately, Great Southern Bancorp’s average deposit cost will also respond quickly and strongly to interest rate hikes because of the large balance of interest-bearing, non-maturing deposits. These deposits, namely interest-bearing demand and savings accounts, made up an overbearing 52% of total deposits at the end of June 2022. The management mentioned in the latest conference call that customers are going to start expecting increases in their rates.
Considering these factors, I’m expecting the margin to grow by 10 basis points in the second half of 2022 before stabilizing in 2023.
Earnings to Grow by 8%
The anticipated loan growth and margin expansion will likely drive earnings this year. Meanwhile, provisioning for expected loan losses will likely remain subdued as most of Great Southern Bancorp’s loans are secured. Non-performing loans made up just 0.10% of total loans, while allowances made up 1.38% of total loans at the end of June 2022.
On the other hand, non-interest expenses will likely surge this year amid a high-inflation environment, which will restrict earnings growth. Further, as mentioned in the conference call, the management expects system conversion costs to almost double due to implementation and training. The management expects these system-related costs to remain elevated until the third quarter of 2023.
Overall, I’m expecting Great Southern Bancorp to report earnings of $5.89 per share for 2022, up 8% year-over-year. For 2023, I’m expecting earnings to grow by a further 9% to $6.40 per share. The following table shows my income statement estimates.
| FY18 | FY19 | FY20 | FY21 | FY22E | FY23E | |||||
| Income Statement | ||||||||||
| Net interest income | 168 | 180 | 177 | 178 | 195 | 211 | ||||
| Provision for loan losses | 7 | 6 | 16 | (6) | 6 | 9 | ||||
| Non-interest income | 36 | 31 | 35 | 38 | 37 | 38 | ||||
| Non-interest expense | 115 | 115 | 123 | 128 | 131 | 138 | ||||
| Net income – Common Sh. | 67 | 74 | 59 | 75 | 75 | 81 | ||||
| EPS – Diluted ($) | 4.71 | 5.14 | 4.21 | 5.46 | 5.89 | 6.40 | ||||
|
Source: SEC Filings, Earnings Releases, Author’s Estimates (In USD million unless otherwise specified) |
||||||||||
Actual earnings may differ materially from estimates because of the risks and uncertainties related to inflation, and consequently the timing and magnitude of interest rate hikes. The Ukraine war is at an important junction, which has direct bearing on inflation. Further, a stronger or longer-than-anticipated recession can increase the provisioning for expected loan losses beyond my estimates.
Adopting a Buy Rating Due to a Material Total Expected Return
Great Southern Bancorp has increased its dividend every year since 2013. Given the earnings outlook, it’s likely that the company will maintain the dividend trend this year. Therefore, I’m expecting the company to increase its dividend by $0.02 per share to $0.42 per share in the second quarter of 2023. The earnings and dividend estimates suggest a payout ratio of 26% for 2023, which is below the five-year average of 35%. Based on my dividend estimate, Great Southern Bancorp is offering a dividend yield of 2.8%.
I’m using the historical price-to-tangible book (“P/TB”) and price-to-earnings (“P/E”) multiples to value Great Southern Bancorp. The stock has traded at an average P/TB ratio of 1.33 in the past, as shown below.
| FY17 | FY18 | FY19 | FY20 | FY21 | Average | |
| T. Book Value per Share ($) | 32.5 | 36.7 | 41.5 | 44.2 | 44.7 | |
| Average Market Price ($) | 51.7 | 54.4 | 57.1 | 43.5 | 55.0 | |
| Historical P/TB | 1.59x | 1.48x | 1.37x | 0.99x | 1.23x | 1.33x |
| Source: Company Financials, Yahoo Finance, Author’s Estimates | ||||||
Multiplying the average P/TB multiple with the forecast tangible book value per share of $44.8 gives a target price of $59.7 for the end of 2022. This price target implies a 0.9% upside from the September 9 closing price. The following table shows the sensitivity of the target price to the P/TB ratio.
| P/TB Multiple | 1.13x | 1.23x | 1.33x | 1.43x | 1.53x |
| TBVPS – Dec 2022 ($) | 44.8 | 44.8 | 44.8 | 44.8 | 44.8 |
| Target Price ($) | 50.7 | 55.2 | 59.7 | 64.2 | 68.6 |
| Market Price ($) | 59.1 | 59.1 | 59.1 | 59.1 | 59.1 |
| Upside/(Downside) | (14.2)% | (6.6)% | 0.9% | 8.5% | 16.1% |
| Source: Author’s Estimates |
The stock has traded at an average P/E ratio of around 11.5x in the past, as shown below.
| FY17 | FY18 | FY19 | FY20 | FY21 | Average | |
| Earnings per Share ($) | 3.64 | 4.71 | 5.14 | 4.21 | 5.46 | |
| Average Market Price ($) | 51.7 | 54.4 | 57.1 | 43.5 | 55.0 | |
| Historical P/E | 14.2x | 11.6x | 11.1x | 10.3x | 10.1x | 11.5x |
| Source: Company Financials, Yahoo Finance, Author’s Estimates | ||||||
Multiplying the average P/E multiple with the forecast earnings per share of $5.89 gives a target price of $67.5 for the end of 2022. This price target implies a 14.2% upside from the September 9 closing price. The following table shows the sensitivity of the target price to the P/E ratio.
| P/E Multiple | 9.5x | 10.5x | 11.5x | 12.5x | 13.5x |
| EPS 2022 ($) | 5.89 | 5.89 | 5.89 | 5.89 | 5.89 |
| Target Price ($) | 55.7 | 61.6 | 67.5 | 73.4 | 79.3 |
| Market Price ($) | 59.1 | 59.1 | 59.1 | 59.1 | 59.1 |
| Upside/(Downside) | (5.8)% | 4.2% | 14.2% | 24.1% | 34.1% |
| Source: Author’s Estimates |
Equally weighting the target prices from the two valuation methods gives a combined target price of $63.6, which implies a 7.6% upside from the current market price. Adding the forward dividend yield gives a total expected return of 10.4%. Hence, I’m adopting a buy rating on Great Southern Bancorp.
Be the first to comment