

surasak petchang/iStock via Getty Images
The Setup
GrafTech (NYSE:EAF) is poised to benefit from periods of higher inflation for several reasons.
First, as the low-cost producer in the industry, higher raw material costs for competitors will result in higher prices for Graphite Electrodes (GE), leading to margin expansion and higher profits for GrafTech.
Second, sustained periods of high steel prices provided GrafTech’s customers with record profits, allowing them to absorb higher costs for Graphite electrodes.
Third, supply of Graphite electrodes has come offline over the past decade as a downturn in the GE market drove competitors out of business or forced them to shutter facilities.
Lastly, anti-dumping duties on GE’s produced in China have reduced and, in some cases, eliminated the lowest cost supplier of Graphite Electrodes in Europe, where GrafTech generates a material amount of revenue.
We recommend going long EAF.
Business Description
GrafTech is a leading manufacturer of ultra-high powered (UHP) graphite electrodes essential for electric-arc furnace steel production. GrafTech operates manufacturing facilities in Spain, France, and Mexico with a combined capacity of ~200kt and ~30kt at the St. Marys USA plant (currently warm idle), for a total capacity of ~230kt.
Petroleum needle coke is the primary raw material needed to manufacture graphite electrodes and represents 40-70% of the cost of GE’s. GrafTech became the only vertically integrated GE producer when it acquired Seadrift Coke in 2010. Seadrift supplies 140,000 MT of Needle coke; therefore, GrafTech would only need to source 35% in the spot market if they run at 100% utilization rates.
According to the World Steel Association (“WSA”), since 2000, EAF steelmaking grew at an annual pace of ~2%, compared with 1% for steelmaking overall, excluding China, and represents ~50% of steel production. 2020 EAF steel production by region was 86 million MT in Europe, 71 million MT in North America, and 56 million MT in India. China is the world’s largest steel producer but primarily utilizes Blast Oxygen Furnaces. China’s Ministry of Industry and Information Technology has ambitions for Electric Arc Furnace steelmaking to constitute 15% of overall steel production by 2025, doubling its current share of output. If Chinese EAF steelmaking production reached 15%, based on 2020 production levels, 62 million MT of additional EAF steel production would be added.
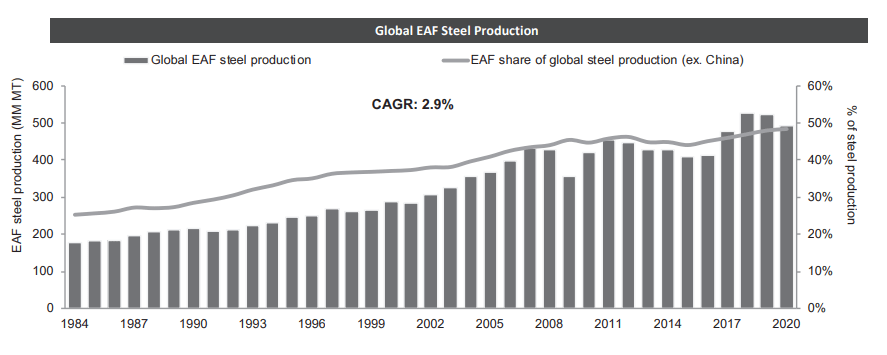
Global EAF Steel Production (World Steel Association)
Petroleum Needle Coke
40-70% of the cost to manufacture Graphite Electrodes comes from the primary raw material used to manufacture them, Needle Coke. Seadrift is one of only five petroleum needle coke suppliers outside of China.
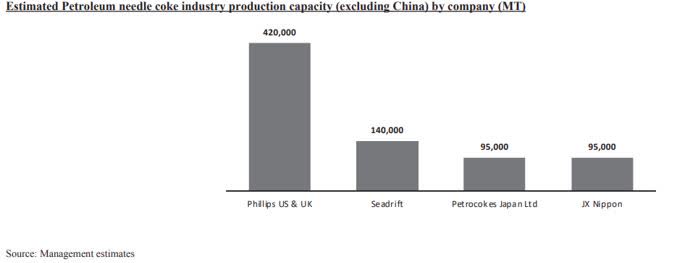
Needle Coke Production Capacity (EAF 2022 Annual Report – Management Estimates)
Historically, Graphite Electrodes are priced based on a spread over the price of Needle Coke. The spread has averaged $3,600 per MT from 2007-to 2021. Petroleum needle coke is produced through a manufacturing process similar to a refinery. Decant oil, a byproduct of the gasoline refining process, is converted into petroleum needle coke and takes two to three months to produce.
Needle coke’s primary use case has gone towards the manufacturing of Graphite Electrodes; however, the proliferation of Electric Vehicles has added a new source of demand. Needle coke is used in the anodes of lithium-ion batteries that power electric vehicles. Electric vehicle manufacturers prefer artificial graphite such as petroleum needle coke in batteries because of its greater energy density, providing batteries with longer driving ranges and longevity. Over the past several years, Petroleum Needle Coke capacity outside of China has remained flat. Inflation occurs when theirs a supply/demand imbalance. No added supply of Needle Coke combined with added demand due to EVs could lead to materially higher Needle Coke and Graphite Electrode prices. Based on IEA’s estimates for electric vehicle sales, battery pack size, and management estimates for needle coke used in anodes, demand for needle coke from electric vehicles could grow significantly from over 100,000 MT in 2020 to over 650,000 MT in 2025. This added demand is more than the largest Needle Coke producer Philips 66. While I believe the switch to Green Energy will take longer than the government and other green proponents say, the anticipated demand vs. what can be supplied is out of line.
GrafTech competitors source Needle Coke in the spot market, whereas GrafTech relies on their in-house Seadrift facility. Competitors will thus have to price Graphite Electrodes based on the spot market of Needle Coke, allowing GrafTech to take advantage of these high prices while not having the correspondingly high-cost structure. Lastly, one can envision a scenario where GE competitors cannot source the necessary supply of needle coke, increasing the demand for GrafTech’s GEs.
Steel Producers
Historically, the steel industry is cyclical, following the traditional boom-bust cycle. The chart below shows that steel prices are elevated compared to a few years ago and have remained elevated for over a year. While prices are off from their highs, steelmakers continue to report record or near-record quarters. Current earnings and margins for steel makers should allow GrafTech to continue increasing Electrode prices. GE’s are critical components of the Steel Making process yet make up less than 5% of the total cost. Due to these sustained high steel prices, steelmakers have dramatically cleaned up their balance sheets. For instance, US Steel had net debt of ~$2.7B at the end of 2020 and ended 2021 with net debt of ~$1.3B, which is likely to be down again in Q1 22. Nucor Steel has taken advantage of its relatively healthy balance sheet by repurchasing ~$3.3B worth of stock. Typically these companies had high debt loads due to the capital intensity of the business. These companies are in much better shape to weather any downturn and allow them to reinvest in the business without tapping debt and equity markets. Healthier balance sheets increase GrafTech’s customers’ credit quality and lower the risks of defaulting on Long Term Volume and Price Agreements EAF has with customers.
Lastly, plant expansions by Nucor and US Steel have been announced. Nucor is building a $2.7B mill with 3m tons of capacity and expanding an existing plant by 1.4m tons. US Steel recently announced a $3B facility with a capacity of 3m tons. In 2021, China approved the construction of 43 new Electric Arc Furnaces with a capacity of 29.33m mt/year which are expected to come online in 2022-2025. All signs point to increased demand for Graphite Electrodes.
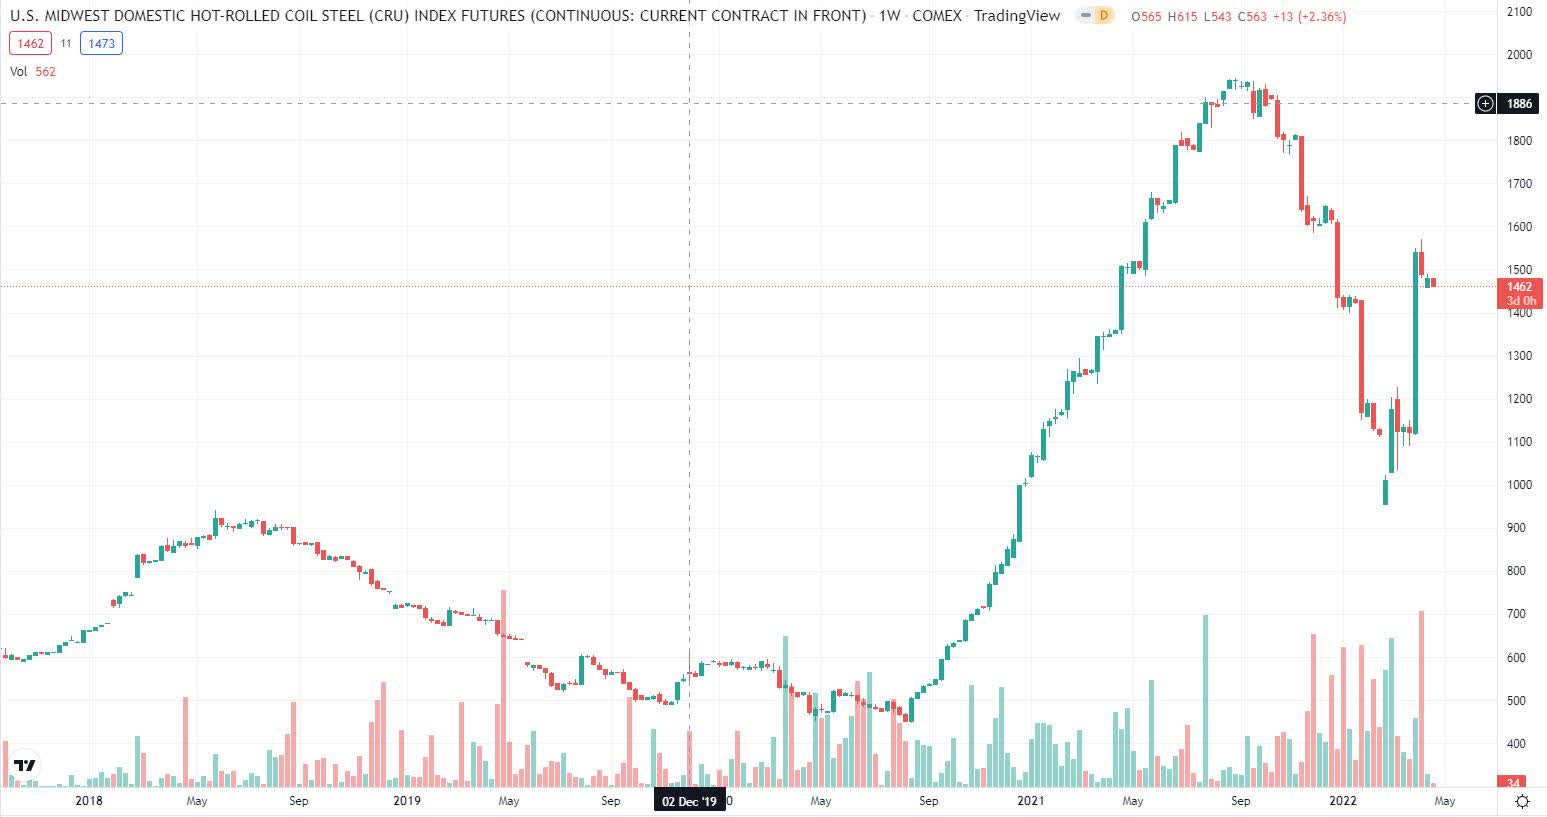
Hot Rolled Steel Prices (TradingView)
Lack of New Supply
Increased demand is only beneficial if GE producers remain rational on the supply side. During a downturn in the steel industry from 2014-2016, management estimates that 20% of the global production capacity of Graphite Electrodes was permanently closed. These facilities tended to be smaller in nature and had higher operating costs. Since then, new supply has remained limited and typically comes from de-bottlenecking existing facilities and not from new ground-up construction. It is doubtful a new competitor would enter the industry as it takes years for these plants to come online, and it’s unlikely the operator has the technical expertise to construct a facility.
EU Anti Dumping
China is the low-cost producer of Graphite Electrodes, though they tend to be lower quality and use coal as the base raw material and not decant oil. Needle coke made from coal is known as pitch needle coke, whereas a needle coke made out of decant oil is called Petroleum Needle Coke. Recent European duties were placed on exports of Graphite Electrodes from China. In January 2022, the European Commission set 25% – 75% anti-dumping duties on Graphite electrodes exported from China. In 2020, China’s exports to the EU were around 43,113 tonnes, making up approximately 34% of the market. Some GE suppliers have abandoned the European market because of these duties as the price for their GE’s after factoring the duties is no longer competitive with European producers. GrafTech generates a material amount of revenue from Europe. As shown in the graph below, GrafTech generated 50% of revenues from EMEA. They do not give a specific breakdown of what came from Europe, the Middle East, and Africa; however, five of GrafTech’s top 10 customers were based in Europe.
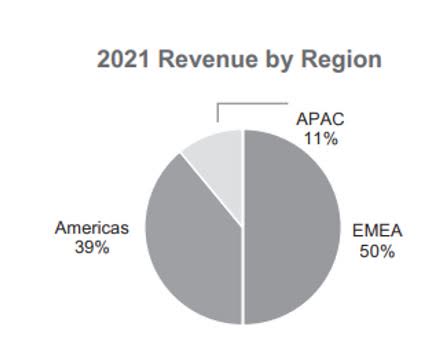
Revenue By Region (EAF 2022 Annual Report)
Valuation
In 2021, EAF generated $1.46 in EPS, which understates the actual results for the year due to a one-time bonus for executives when Brookfield Asset Management’s (BAM) stake fell below 25%, resulting in a $0.24 hit to earnings. Given the current pricing environment, 2022 will likely be GrafTech’s best year since 2019. Spot prices have rebounded from a low of $3,900 at the end of 2020 to $6,100 to start 2022, and the remaining Long Term Agreements in place are priced at $9,500/mt. Management expects prices to increase throughout the year.
In 2022, if spot prices average $6,500 and GrafTech has a utilization rate of 75%, equating to 173,000 mt, I expect EAF to generate almost $1.5B in revenues, $680m in EBITDA, and $486m in FCF. Cash flows will go towards paying off debt as EAF has $1B in debt, with the closest maturity in 2025. While it’s unrealistic to forecast prices returning to record highs seen in 2017-2018. The bulk of GrafTech’s remaining Long Term Agreements ends in 2022. I estimate that at 80% utilization and $7,500 /mt, GrafTech would generate $1.43B in Revenues, $590m in EBITDA, and $415m in FCF. Utilizing these as normalized earnings put EAF’s current valuation at 6x EV/EBITDA and 8.5x EV/FCF, though if the company pays down $400m+ of debt this year, the valuation is even cheaper. The capital intensity of the business is relatively minimal, requiring $40-50m per year in maintenance CAPEX. Once the balance sheet is a little cleaner, I expect management to reduce the share count regularly.
Assumptions underlying these estimates revolve around the current pricing environment while factoring in historical prices. As noted above, current spot prices are $6,100 with the expectation of increasing throughout the year as management noted. While the magnitude of the move throughout the year is unknown, to start 2021 prices were in the low $4,000s and finished at $6,100, a 50% increase in one year! I don’t expect this move to occur again as excess GE inventories were worked down throughout 2020-2021, driving GE prices to what I believe were artificially low prices. A 10-20% increase during the year is attainable as customer demand should remain strong with steel prices at these levels. In 2017-2018, supply of Graphite Electrodes were heavily constrained, leading to panic buying by customers, and at one point, drove prices to ~$20,000/mt. Between 2007 and 2021, GrafTech’s weighted average realized price of graphite electrodes, excluding LTAs, was approximately $5,700 per MT. For the reasons laid out above, I believe future prices of Graphite Electrodes will be higher, it is just a question of how much higher.
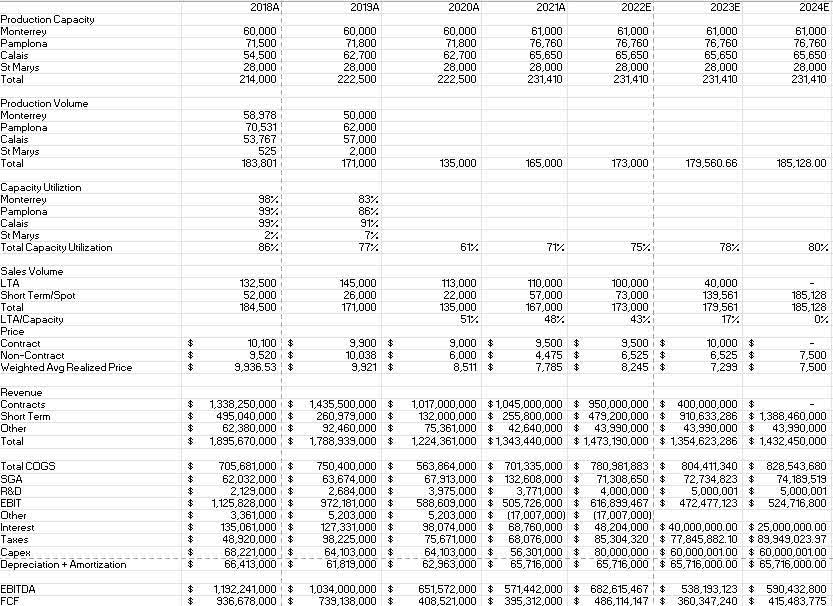
Personal EAF Estimates (My Estimates)
Risks
The steel industry is tied to the economy and generally exhibits a boom-bust cycle. A recession would likely cause steel demand to drop, resulting in less demand for GE. GrafTech’s healthier balance sheet relative to the last period should put it in a favorable position to whether such an event. Another risk is sourcing an alternative to Needle Coke for Anodes in Lithium-Ion batteries resulting in less demand for Needle Coke, causing GE prices to decline. Lastly, plant expansions by competitors would result in increased supply of GE’s, potentially leading to an oversupplied market, a significant factor in 2014-2016, leading GrafTech to the brink of bankruptcy and causing other players to shutter manufacturing plants. De-bottlenecking will likely occur at other companies such as HEG or Graphite India. However, given the added demand, it’s unlikely enough supply will come online and significantly cause an imbalance in the supply-demand equation.
One of the primary risks discussed throughout 2020-2021 was the potential for force majeure clauses to be enacted due to COVID, allowing customers to get out of existing contracts. This risk did not materialize as EAF entered 2020 with 372,000 MT of Long Term Agreements with customers from 2020-2022, with the breakdown of 130k mt in 2020, 125k mt in 2021 117k in 2022. In 2020 and 2021, when steel companies were struggling or had an excess supply of Graphite Electrodes, GrafTech delivered 224k out of the 242k mt expected to be sold. At the beginning of 2020, they expected to sell 117k mt in 2022. At the start of 2022, they now expect to sell 100k mt. GrafTech did not lose out on the 35k mt (18k in 2020-2021 and 17k in 2022); instead, they pushed out the delivery dates of these orders to 2023-2024, where GrafTech expects to deliver 40k mt over the two years. All told, the worst environment one could imagine for GrafTech did not result in any lost contracts!
Summary
GrafTech is experiencing multiple tailwinds after several years of operating in a challenging environment. The supply of Graphite Electrodes continues to remain steady while demand is rising, resulting in rising prices for Graphite Electrodes. Additionally, increasing demand for Needle Coke will result in an advantageous position for GrafTech since they are the low-cost producer of GE’s and are the only vertically integrated player in the industry. Positive developments out of China and Europe support higher GE prices. Taken all together, GrafTech appears to be very cheap given these factors.
Go Forward Expectations and Metrics to Monitor
Utilization rates and prices of Non-LTAs are the two primary metrics to watch. If the thesis plays out correctly, prices of Non-LTAs should trend up throughout the year, as should utilization rates. Management should continue to pay down debt with some share buybacks throughout the year. One potential catalyst could be refinancing the 2025 debt, extending it out to 2030 or a later date, and using cash flows to repurchase shares instead of reducing debt. A move like this would signal confidence in the business’s near and long-term outlook. Most Long Term Agreements expire at the end of this year; we should hear about contract renewals in Q3 and Q4.
Be the first to comment