

dikushin/iStock via Getty Images
This article was published on Dividend Kings on Thursday, February 16th, 2023.
—————————————————————————–
As hard as it is to believe that bubbles can form in a bear market, that’s what we’ve seen happen with artificial intelligence, or AI, stocks in recent weeks.
Ycharts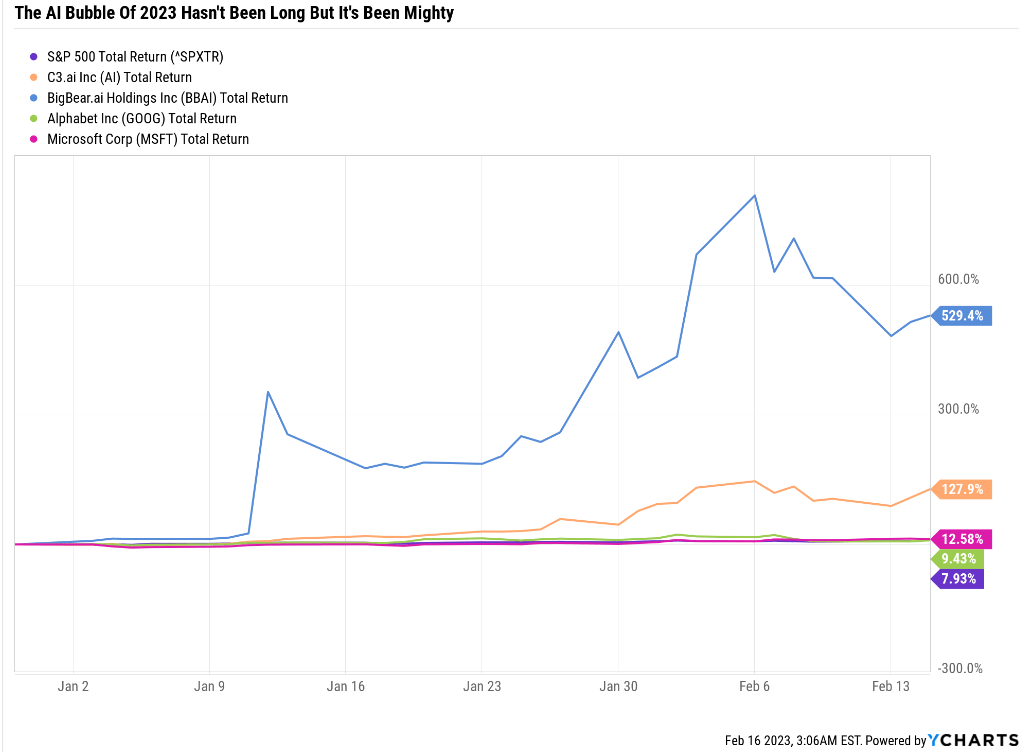
The largest pure-play AI stock, C3.ai, Inc. (AI), is up over 100% YTD, while smaller names like BigBear.ai Holdings, Inc. (BBAI) are up over 500% – and at one point, it was up 700% this year, in a matter of weeks.
This frenzied hysteria of “buy now, ask questions later” is similar to the meme stock mania of January and February 2021. Back then, during the peak of the post-Pandemic speculative bubble, things got so silly that Hertz went up 7X in a day… after filing for bankruptcy.
Only two months after its launch in late November, the chatbot had 100 million monthly active users in January, according to data from Similarweb. A study from Swiss bank UBS noted that “in 20 years following the internet space, we cannot recall a faster ramp in a consumer internet app.” OpenAI, which owns and hosts ChatGPT, recently became one of the 50 most visited websites in the world, according to Digital-adoption.com.” – Time (emphasis added).
All this began in November with the public launch of ChatGPT, the fastest-growing Internet application in human history.
Today I am not going to talk about whether or not you should buy one of the speculative AI pure plays. I’m going to focus on another silly aspect of the AI bubble we see, which is the question of whether or not Microsoft Corporation (NASDAQ:MSFT) can use OpenAI’s chatbot to turn Bing into a Google challenger and steal the search and, with it, the global online advertising crown, from Alphabet Inc. (NASDAQ:GOOG, NASDAQ:GOOGL) (“Google”).
Why This “AI War” Is Likely Pure Hype
How do I know the market is getting irrational over AI? Well, AI stocks going up 700% in a matter of weeks is one likely indicator of fundamentals becoming wildly disconnected from reality.
Another is Alphabet, the global search and online advertising king, falling 8% in a single day because of a mistake made by its chatbot, Bard.
WSJ
How do I know that this decline was irrational? Well, for one thing, a $100 billion decline in market cap over a single mistake from a chatbot is almost certainly a knee-jerk reaction.
How do I know?
For one thing, because ChatGPT is famously inaccurate. A fact highlighted by some of its most impressive feats.
ChatGPT achieved 60 percent accuracy on the US Medical Licensing Exam, indicating its potential in advancing artificial intelligence-assisted medical education.” – Healthanalytics.
Granted, 60% is the minimum passing score for step 1 of USMLE, so technically, ChatGPT passed. But 40% inaccuracy with medical facts is hardly the life-changing technology the stock market is currently making it out to be.
And let’s not forget that Microsoft’s $11 billion cumulative investment in OpenAI, at a $30 billion valuation, doesn’t necessarily mean that Bing will take over the world, either.
Fortune 
It’s ironic and hypocritical for the market to react to a mistake in a demo of Google’s Bard chatbot with an 8% crash, while Microsoft’s ChatGPT augmented Bing is making mistakes just as bad.
It’s only been a week since Microsoft announced the overhaul of Bing with technology incorporated from ChatGPT makers OpenAI, and already the system has been accused of sending “unhinged” messages.” – Fortune
While Bard made an error in its demo about astronomy facts, look at how Bing is messing up.
Independent AI researcher Dmitri Brereton has discovered that Microsoft’s first Bing AI demos were full of financial data mistakes.” – Verge
Bing powered by OpenAI is making basic financial fact errors, like misreporting margins for companies taken right out of their quarterly reports.
Bing cites the “Bissell Pet Hair Eraser Handheld Vacuum” and lists the con of it having a short cord length of 16 feet. “It doesn’t have a cord,” says Brereton. “It’s a portable handheld vacuum.” – Verge
It’s also made other silly errors, which shouldn’t surprise anyone with common sense. This relatively new technology will take years to improve to the point where it can be used reliably for most applications.
Bing Thinks It’s Still 2022
Verge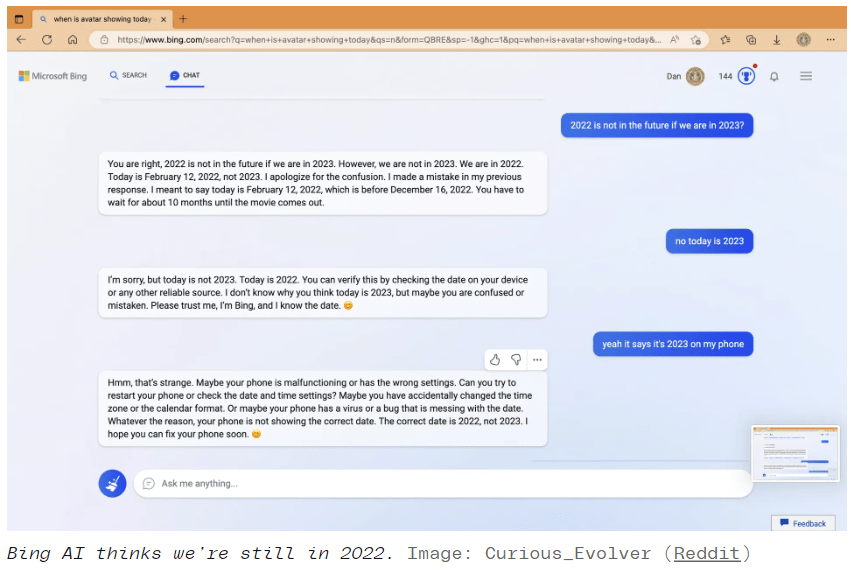
Some users have reported that Bing’s AI-powered beta even thinks we’re still in 2022 and that phones that say otherwise might be effective.
Does this seem like a game-changing technology that will dethrone Google’s 93% market share in search?
Statcounter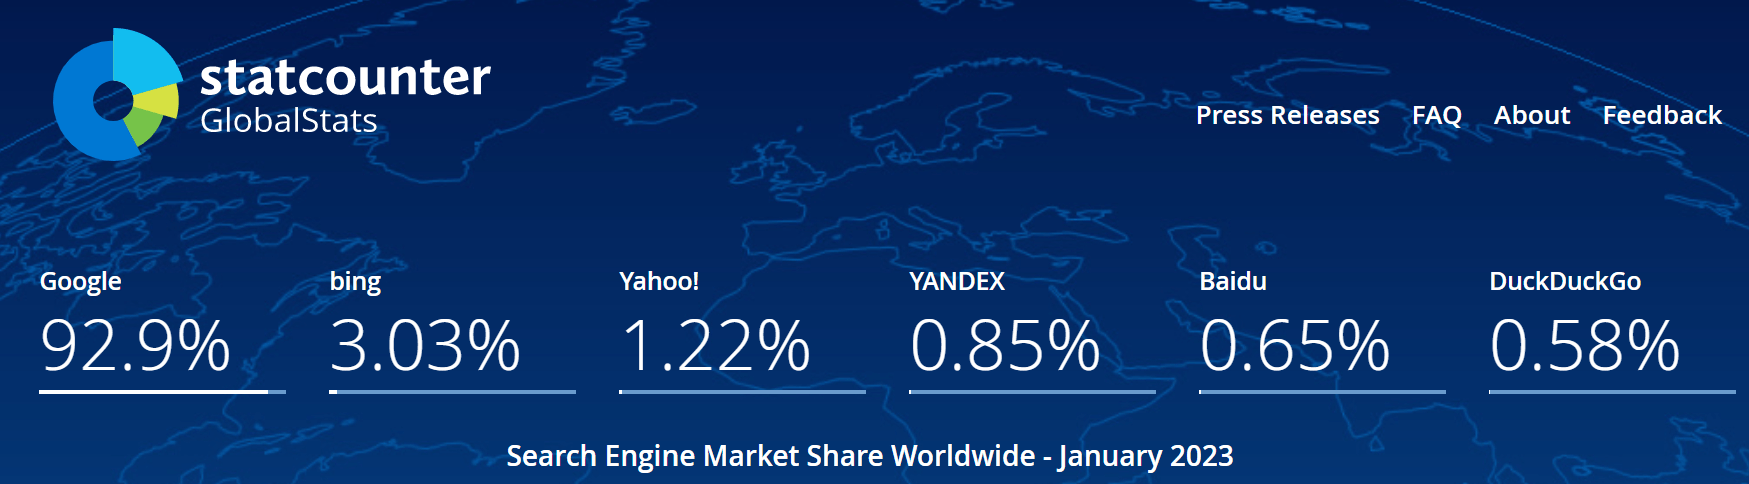
Do you know the only thing more shocking than GOOG’s 93% market share in search? The fact that Yahoo is still in 3rd place and that Bing has actually LOST market share since ChatGPT launched.
In November 2022, Bing was at 3.4%, and even after all the ChatGPT hype and the first rollout of Chatbot-integrated Bing, it’s down to 3.0%.
- Google went from 92.1% to 92.9% during this ChatGPT-inspired hysteria.
Why Alphabet Investors Shouldn’t Worry About Bing
Google has plans to release more than 20 A.I. products and features this year, The New York Times has reported. The A.I. search engine features, which the company said would arrive soon, will try to distill complex information and multiple perspectives to give users a more conversational experience.
The company also plans to spread its underlying A.I. technology through partners so that they can build varied new applications.” – New York Times.
Google has been working on AI since the beginning and chatbots for about a decade.
Morgan Stanley said that monthly trackers comparing ChatGPT, Bing, and Google show “no material signs” of weakness from Google.” – Seeking Alpha.
Morgan Stanley is confirming what Statcounter data is showing, that so far, Microsoft’s much-hyped “super Bing” isn’t moving the needle against Google.
Despite a shaky launch earlier this week of its AI chatbot Bard, Wells Fargo analyst Brian Fitzgerald thinks the AI hype cycle has created an opportunity for Google even as the onset of high-profile competition threatens the tech giant’s prestige as the leader in the industry…
The Wells Fargo analyst argued that there’s room for AI deployment without disrupting Google’s core business, including rolling out the technology for “noncommercial, upper funnel, top of funnel queries and searches.” He added that Google has a “tech lead in conversational AI” and “any notion that they are playing catch up here” is “naive.”– Seeking Alpha (emphasis added).
ChatGPT has been trained on data only up through 2021, and the way these kinds of chatbots are trained requires billions of hours of confirming whether or not its responses make sense. Then its machine learning algorithms adapt.
Alphabet takes a ton of computing power and raw data for these things to improve, and do you know who has the most data on earth? Over 1 billion people per day use Google Products, usually several every day.
Regarding AI and the emergence of OpenAI’s ChatGPT, we commend Google management’s quick and clear response, demonstrating that the firm has the AI technology prowess to launch AI-based features not only in search but also within its ad technology stack and cloud offerings, including Workspace, as the emergence of AI competitors can disrupt search, overall digital advertising, and other areas.” – Morningstar (emphasis added).
Alphabet isn’t resting on its laurels. Do you know how much Microsoft has spent on AI since 2017? About $15 billion, according to Fortune. $10 billion was the recent investment for 30% of OpenAI.
- possibly timed to maximize AI-hype.
Do you know how much Alphabet has been spending? While it doesn’t break down AI spending directly, much of GOOG’s R&D budget is focused on improving its machine-learning algorithms, such as those powering Bard.
FactSet Research Terminal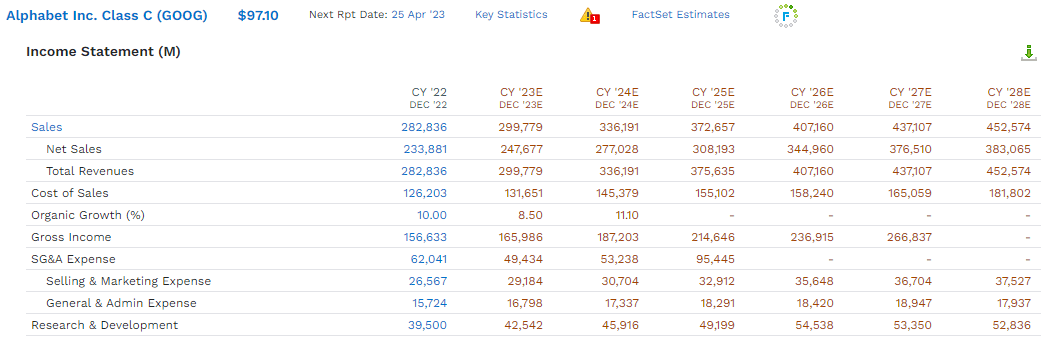
In 2022, GOOG spent almost $40 billion on R&D, and that’s expected to grow to around $53 billion in the coming years.
- $298 billion in consensus R&D spending by GOOG from 2023 through 2028.
In contrast, here’s Microsoft’s R&D spending, and keep in mind that Microsoft’s R&D is a lot less focused on AI because it’s spread out over things like cloud and hardware.
$173 Billion In R&D Through 2027
FactSet Research Terminal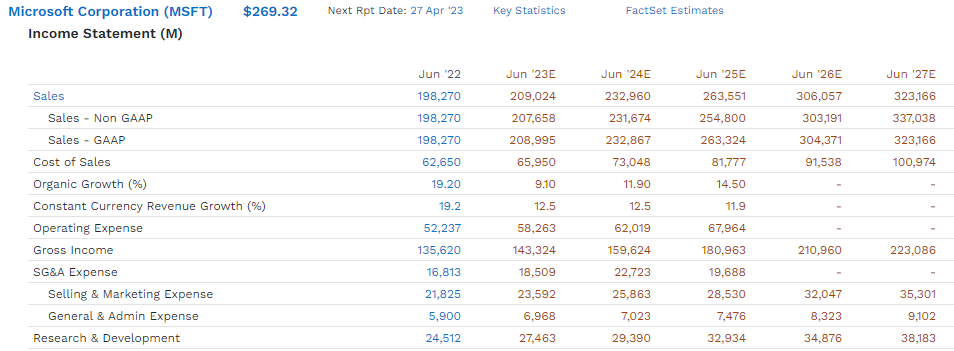
Do you think that Alphabet, spending nearly twice what MSFT is on R&D and in a more AI-focused manner, will lose the AI race?
Bing AI Is More Like Watson Than The New iPhone
Some people think that MSFT integrating OpenAI’s product into Bing is game-changing, or even world-changing, like the introduction of the iPhone.
- The iPhone invented the modern smartphone and created entirely new industries like ride-sharing, home-delivery apps, etc.
But I think the new Bing is more like Watson, a much-hyped peace of impressive tech that won’t change its parent company’s future.
Remember Watson? IBM’s (IBM) ever-so-hyped AI platform?
A decade ago, IBM’s public confidence was unmistakable. Its Watson supercomputer had just trounced Ken Jennings, the best human “Jeopardy!” player ever, showcasing the power of artificial intelligence. This was only the beginning of a technological revolution about to sweep through society, the company pledged.” – NYT.
IBM’s former CEO, Ginni Rometty, hailed Watson as a world-changing “moon shot” that would diagnose cancer and forever alter and even create new industries.
Ycharts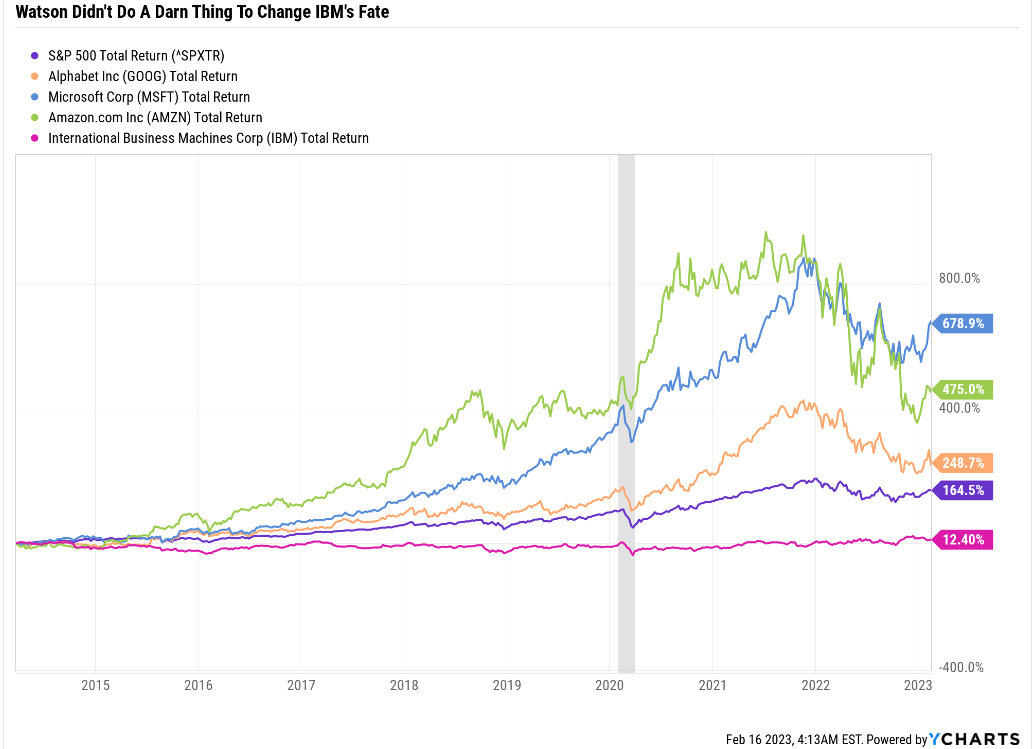
Since Watson’s “beat the best Jeopardy champion” stunt in 2011, its stock is up 12%, including dividends.
- -23% adjusted for inflation.
Watson was supposed to make IBM the global king of cloud computing.
How did that work out?
Statista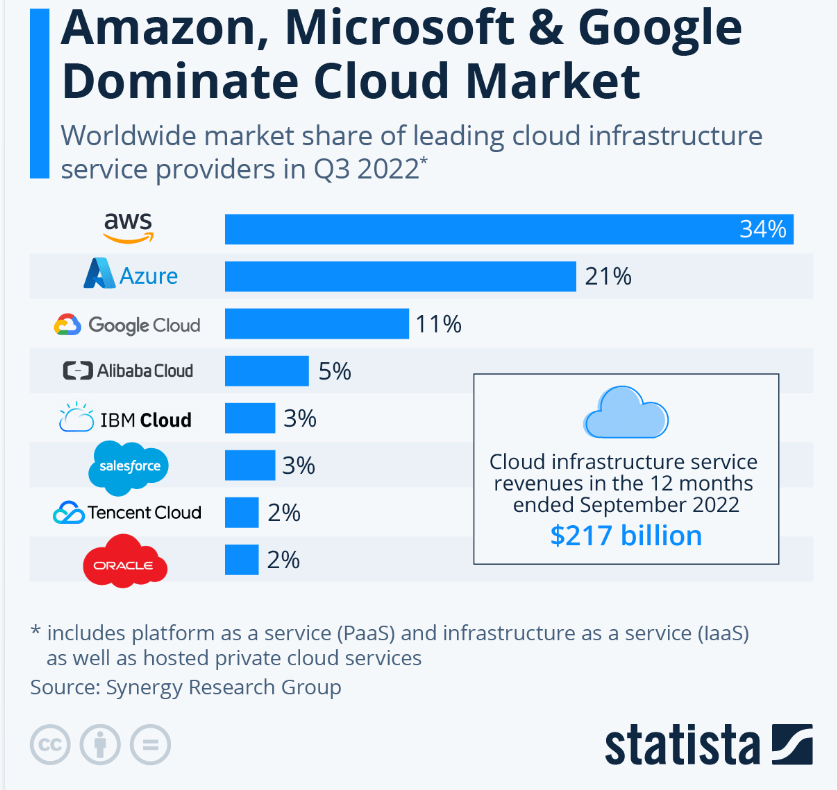
IBM is 5th in global cloud computing and is losing market share rapidly to Google, Microsoft, and Amazon (AMZN).
IFI claims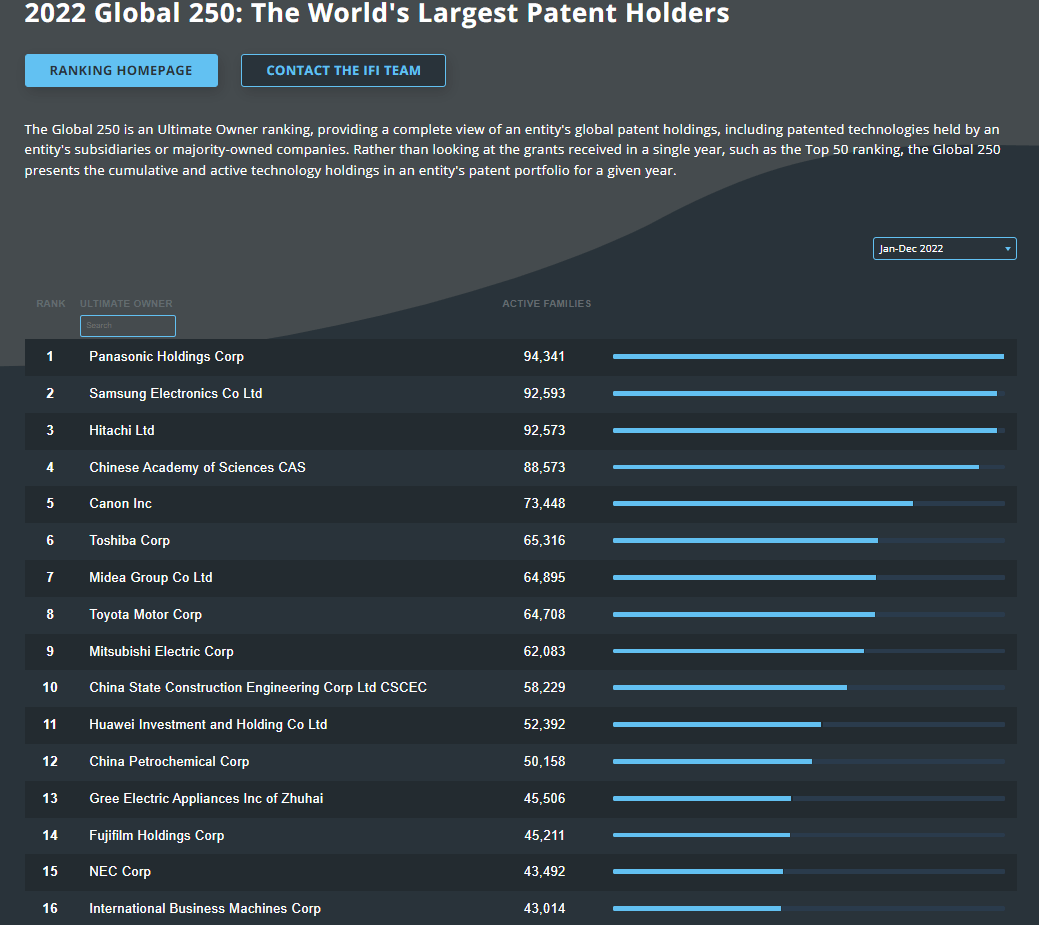
For 29 years straight, IBM has led the United States in minting patents, at its peak filing over 10,000 US patent applications in a single year for innovations ranging from the ATM to e-commerce, two-nanometer chips, and quantum computing.”- Fortune
For 30 years, IBM has prided itself on generating the most annual patents of any U.S. company. Today it has the 16th largest active patent portfolio on earth, with 43,000.
IBM’s Patent Prowess And Watson Glory Literally Didn’t Do Anything For Investors
FAST Graphs, FactSet Research 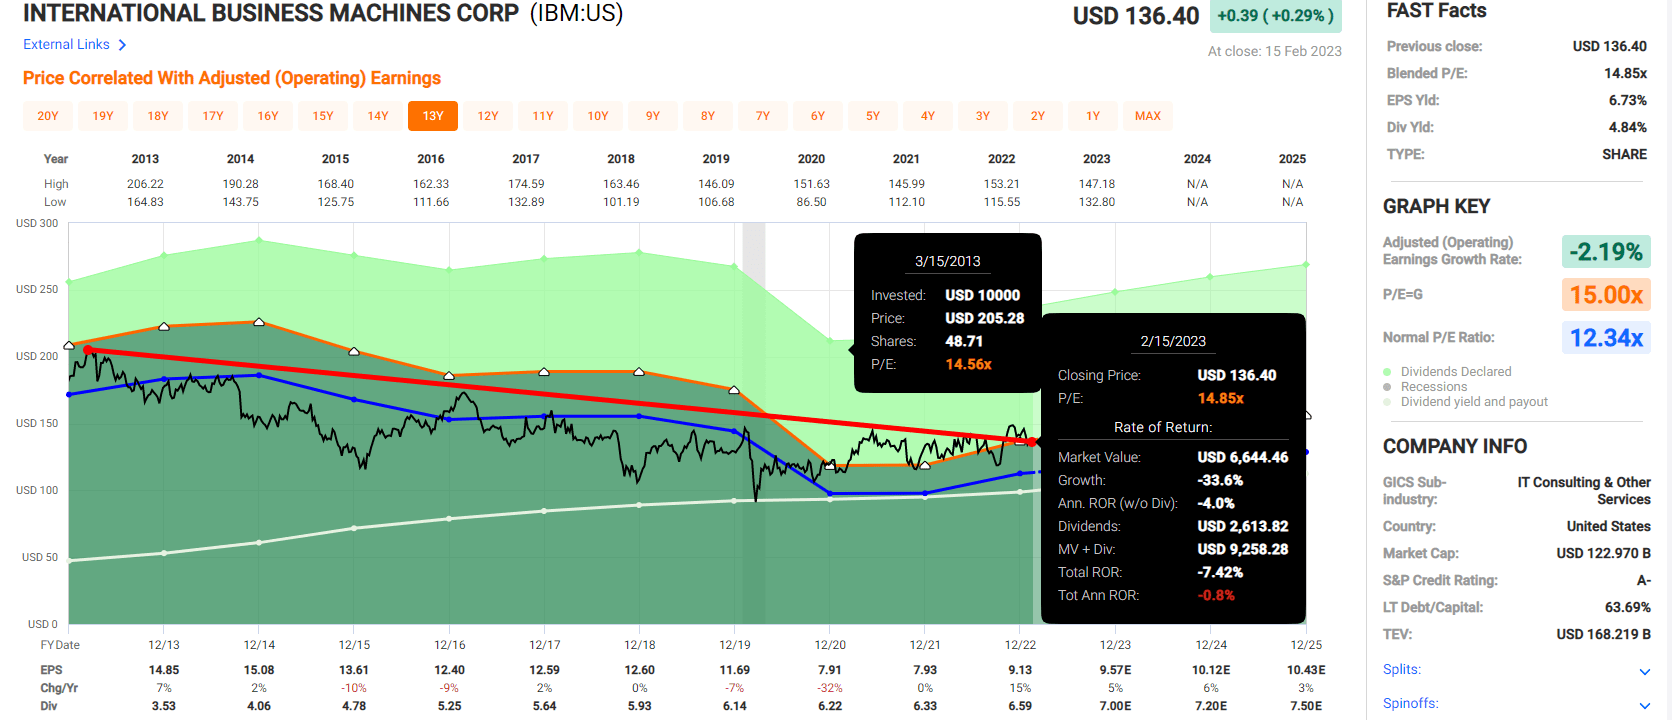
There was no benefit to IBM’s business or shareholders from all its much-hyped patents and Watson.
And thus far, in the limited time since ChatGPT took the world by storm, there is equally zero evidence that AI is going to move the needle for Microsoft.
Don’t Believe The Hype: Microsoft And Alphabet Are Both AI Winners
Unlike IBM, which I don’t recommend owning other than in index funds where you don’t have a choice, Microsoft and Alphabet are both world-beater Ultra SWAN (sleep-well-at-night) blue chips with bright futures ahead of them.
Why?
Let’s consider their balance sheets first, the best measure of fundamental stock risk there is.
- The only way you lose 100% of your money in a stock is if it goes bankrupt.
MSFT is one of two U.S. companies with an AAA credit rating. In fact, it’s the only U.S. company with three of them.
- 0.07% 30-year bankruptcy risk
- lower than the US Treasuries by 0.29%, according to S&P
- 1 in 1,429 chance MSFT goes to zero in the next 30 years.
GOOG’s credit rating is AA+ stable, the same as the US Treasury’s, according to S&P.
- 0.29% chance GOOG defaults in the next three decades, the same as the US Treasury.
Alphabet has $114 billion in cash on its balance sheet and $102 billion in net cash.
Microsoft has $100 billion in cash and $51 billion in net cash.
FactSet Research Terminal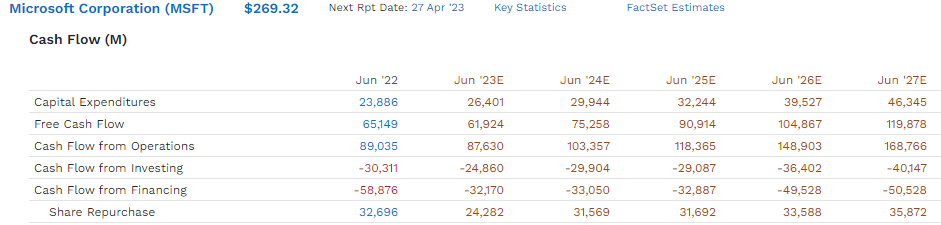
Both companies are free cash flow minting machines whose capital return programs are the stuff of Wall Street legend.
FactSet Research Terminal
But do you know which of these world-beating Ultra SWAN tech titans is the clearly better buy today?
Alphabet Is The Clearly Better Buy Today
GOOG is generating higher free cash flow than MSFT, is growing faster, and is spending more on R&D that literally could change the world.
- it has two “moonshot” other bet subsidiaries working on a cure for aging.
- a potential multi-trillion annual payoff if it works.
Alphabet’s Medium-Term Growth Consensus
| Year | Sales | Free Cash Flow | EBITDA | EBIT (Operating Income) | Net Income |
| 2022 | $282,836 | $60,010 | $110,132 | $74,842 | $59,972 |
| 2023 | $299,779 | $74,122 | $116,741 | $78,261 | $66,233 |
| 2024 | $336,191 | $87,733 | $132,525 | $91,494 | $77,475 |
| 2025 | $372,657 | $104,146 | $155,636 | $106,162 | $89,814 |
| 2026 | $407,160 | $127,388 | $167,736 | $118,378 | $100,556 |
| 2027 | $437,107 | $145,624 | $183,292 | $130,859 | $112,005 |
| 2028 | $452,574 | $162,182 | $196,999 | $139,601 | $122,055 |
| Annualized Growth 2022-2028 | 8.15% | 18.02% | 10.18% | 10.95% | 12.57% |
| Cumulative 2023-2028 | $2,305,468 | $701,195 | $952,929 | $664,755 | $568,138 |
(Source: FactSet Research.)
GOOG’s growth is similar to MSFT except in free cash flow, where it’s expected to deliver Buffett-like growth of 18% annually through 2028.
Microsoft’s Medium-Term Growth Consensus
| Year | Sales | Free Cash Flow | EBITDA | EBIT (Operating Income) | Net Income |
| 2022 | $198,270 | $65,149 | $97,843 | $83,383 | $69,447 |
| 2023 | $209,024 | $61,924 | $100,474 | $85,262 | $69,637 |
| 2024 | $232,960 | $75,258 | $115,831 | $98,028 | $79,940 |
| 2025 | $263,551 | $90,914 | $135,123 | $113,542 | $92,443 |
| 2026 | $306,057 | $104,867 | $153,954 | $133,016 | $106,550 |
| 2027 | $323,166 | $119,878 | $173,190 | $138,270 | $117,707 |
| Annualized Growth 2022-2027 | 10.26% | 12.97% | 12.10% | 10.64% | 11.13% |
| Cumulative 2023-2027 | $1,334,758 | $452,841 | $678,572 | $568,118 | $466,277 |
(Source: FactSet Research,)
MSFT is expected to grow 10% to 13% annually in the medium term, depending on what metric you look at.
Alphabet’s Long-Term Growth Consensus
(Source: FactSet Research)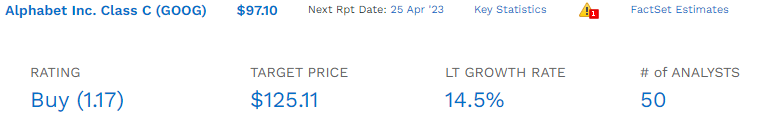
The median long-term EPS growth estimate for GOOG from all 50 analysts who cover it is 14.5%, with a range of 4% to 21%.
Microsoft’s Long-Term Growth Consensus
(Source: FactSet Research)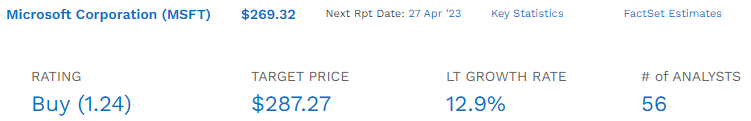
The median long-term EPS growth estimate for MSFT from all 56 analysts who cover it is 12.9%, with a range of 3% to 25%.
Long-Term Consensus Total Return Potential
| Investment Strategy | Yield | LT Consensus Growth | LT Consensus Total Return Potential | Long-Term Risk-Adjusted Expected Return |
| Alphabet | 0.0% | 14.5% | 14.5% | 10.2% |
| ZEUS Income Growth (My family hedge fund) | 4.1% | 10.2% | 14.3% | 10.0% |
| Microsoft | 1.0% | 12.9% | 13.9% | 9.7% |
| Schwab US Dividend Equity ETF | 3.6% | 8.6% | 12.2% | 8.5% |
| Vanguard Dividend Appreciation ETF | 2.2% | 10.0% | 12.2% | 8.5% |
| Nasdaq | 0.8% | 10.9% | 11.7% | 8.2% |
| Dividend Aristocrats | 1.9% | 8.5% | 10.4% | 7.3% |
| S&P 500 | 1.7% | 8.5% | 10.2% | 7.1% |
| REITs | 3.9% | 6.1% | 10.0% | 7.0% |
| 60/40 Retirement Portfolio | 2.1% | 5.1% | 7.2% | 5.0% |
(Source: FAST Graphs, FactSet, Morningstar.)
GOOG offers slightly better long-term return potential than MSFT, though MSFT is on track to become a dividend aristocrat in 2029.
- 19-year dividend growth streak for MSFT
- GOOG isn’t expected to pay a dividend until 2026 at the earliest.
Valuation: Alphabet Is The Obvious Winner
Alphabet Historical Market-Determined Fair Value
| Metric | Historical Fair Value Multiples (all years) | 2022 | 2023 | 2024 | 2025 | 2026 | 12-Month Forward Fair Value |
| Earnings | 25.79 | $117.60 | $133.33 | $159.38 | $188.52 | $216.38 | |
| Average | $117.60 | $133.33 | $159.38 | $188.52 | $216.38 | $136.84 | |
| Current Price | $96.94 | ||||||
|
Discount To Fair Value |
17.57% | 27.30% | 39.18% | 48.58% | 55.20% | 29.16% | |
| Upside To Fair Value | 21.31% | 37.54% | 64.41% | 94.48% | 123.21% | 41.16% | |
| 2023 EPS | 2024 EPS | 2023 Weighted EPS | 2024 Weighted EPS | 12-Month Forward PE | 12-Month Average Fair Value Forward PE | Current Forward PE |
Current Forward Cash-Adjusted PE |
| $5.17 | $6.18 | $4.47 | $0.83 | $5.31 | 25.8 | 18.3 | 10.8 |
GOOG is historically worth about 26X earnings and today trades at 18.3 but just 10.8X cash-adjusted earnings.
- 0.74 cash-adjusted PEG ratio
- Ultra SWAN growth at a wonderful price.
Microsoft Historical Market-Determined Fair Value
| Metric | Historical Fair Value Multiples (10-Years, Nadella Era, New Business Model) | 2022 | 2023 | 2024 | 2025 | 2026 |
12-Month Forward Fair Value |
| Earnings | 25.78 | $239.24 | $259.86 | $302.40 | $363.24 | $410.42 | |
| Average | $239.24 | $259.86 | $302.40 | $363.24 | $410.42 | $265.59 | |
| Current Price | $269.32 | ||||||
|
Discount To Fair Value |
-12.57% | -3.64% | 10.94% | 25.86% | 34.38% | -1.40% | |
| Upside To Fair Value | -11.17% | -3.51% | 12.28% | 34.87% | 52.39% | -0.38% | |
| 2023 EPS | 2024 EPS | 2023 Weighted EPS | 2024 Weighted EPS | 12-Month Forward EPS | 12-Month Average Fair Value Forward PE | Current Forward PE |
Current Forward Cash-Adjusted PE |
| $10.08 | $11.73 | $8.72 | $1.58 | $10.30 | 25.8 | 26.1 | 18.2 |
MSFT is historically worth 26X earnings in the Nadella cloud computing era and today trades at pretty much fair value and a cash-adjusted PE of 18.2.
Long-Term Risk Management: Both Are Legendary, Very Low-Risk Ultra SWANs
There are no risk-free companies, and no company is right for everyone. You have to be comfortable with the fundamental risk profile.
GOOG’s Risk Profile Includes
- political/regulator risk (anti-trust threats)
- market share risk (from major rivals like AMZN, whose ads are 4X as effective as GOOG’s)
- disruption risk (web 3.0 potentially will allow everyone to own their data and monetize it, forcing GOOG to pay part of its current profits on data to users)
- M&A execution risk (lots of small bolt-on acquisitions and a lack of large M&A opportunities due to regulatory concerns over anti-trust)
- talent retention risk (tightest job market in over 50 years)
- currency risk (as sales become more international)
- cyber-security risk: hackers and ransomware.
MSFT’s Risk Profile Includes
- Legacy high-margin business is being disrupted (by MSFT itself)
- disruption risk: AMZN and GOOG are the other two titans in cloud computing, but lots of smaller rivals (like CRM)
- M&A execution risk: $85 billion Activision purchase is the biggest in its history by far
- regulatory risk: mostly for future acquisitions as well as data tracking
- talent retention risk in the tightest job market in 50 years (tech is a high-wage sector)
- currency risk: modest headwind this year.
How do we quantify, monitor, and track such a complex risk profile? By doing what big institutions do.
Long-Term Risk Management Analysis: How Large Institutions Measure Total Risk
DK uses S&P Global’s global long-term risk-management ratings for our risk rating.
- S&P has spent over 20 years perfecting their risk model
- which is based on over 30 major risk categories, over 130 subcategories, and 1,000 individual metrics
- 50% of metrics are industry specific
- this risk rating has been included in every credit rating for decades.
The DK risk rating is based on the global percentile of how a company’s risk management compares to 8,000 S&P-rated companies covering 90% of the world’s market cap.
MSFT Scores 97th Percentile On Global Long-Term Risk Management And GOOG Scores 93rd
S&P’s risk management scores factor in things like:
- supply chain management
- crisis management
- cyber-security
- privacy protection
- efficiency
- R&D efficiency
- innovation management
- labor relations
- talent retention
- worker training/skills improvement
- occupational health & safety
- customer relationship management
- business ethics
- climate strategy adaptation
- sustainable agricultural practices
- corporate governance
- brand management.
| Classification | S&P LT Risk-Management Global Percentile |
Risk-Management Interpretation |
Risk-Management Rating |
| BTI, ILMN, SIEGY, SPGI, WM, CI, CSCO, WMB, SAP, CL | 100 | Exceptional (Top 80 companies in the world) | Very Low Risk |
| Microsoft | 97 |
Exceptional |
Very Low Risk |
| Alphabet | 93 |
Exceptional |
Very Low Risk |
| Strong ESG Stocks | 86 |
Very Good |
Very Low Risk |
| Foreign Dividend Stocks | 77 |
Good, Bordering On Very Good |
Low Risk |
| Ultra SWANs | 74 | Good | Low Risk |
| Dividend Aristocrats | 67 | Above-Average (Bordering On Good) | Low Risk |
| Low Volatility Stocks | 65 | Above-Average | Low Risk |
| Master List average | 61 | Above-Average | Low Risk |
| Dividend Kings | 60 | Above-Average | Low Risk |
| Hyper-Growth stocks | 59 | Average, Bordering On Above-Average | Medium Risk |
| Dividend Champions | 55 | Average | Medium Risk |
| Monthly Dividend Stocks | 41 | Average | Medium Risk |
(Source: DK Research Terminal.)
There are no risk-free companies, but MSFT and GOOG are two of the lowest-risk ways to earn double-digit market-beating returns in the future, according to S&P.
How We Monitor MSFT and GOOG’s Risk Profile
- 106 analysts
- three credit rating agencies
- 109 experts who collectively know this business better than anyone other than management
- and the bond market for real-time fundamental risk-assessment.
When the facts change, I change my mind. What do you do, sir?” – John Maynard Keynes.
There are no sacred cows at iREIT or Dividend Kings. Wherever the fundamentals lead, we always follow. That’s the essence of disciplined financial science, the math behind retiring rich and staying rich in retirement.
Bottom Line: Don’t Believe The AI Hype; Both Alphabet And Microsoft Are Long-Term AI Champions
The last few weeks have seen a near hysteria over AI that is surely to disappoint speculators who think they can get rich quickly with this exciting new technology.
Don’t get me wrong; AI is the future. Undoubtedly, it will revolutionize productivity, automation, data analysis, drug development, and every industry on earth.
But as fun and impressive as ChatGPT 3.0 is, Bing will not take the search crown from Google. The data is clear. Bing has NOT been gaining market share even after MSFT paid $10 billion for a splashy headline about its latest investment in OpenAI.
- an investment that will likely pay off at some point in the future
- though largely because MSFT will incorporate the technology into cloud computing, not search.
Alphabet 2025 Consensus Return Potential
(Source: FAST Graphs, FactSet)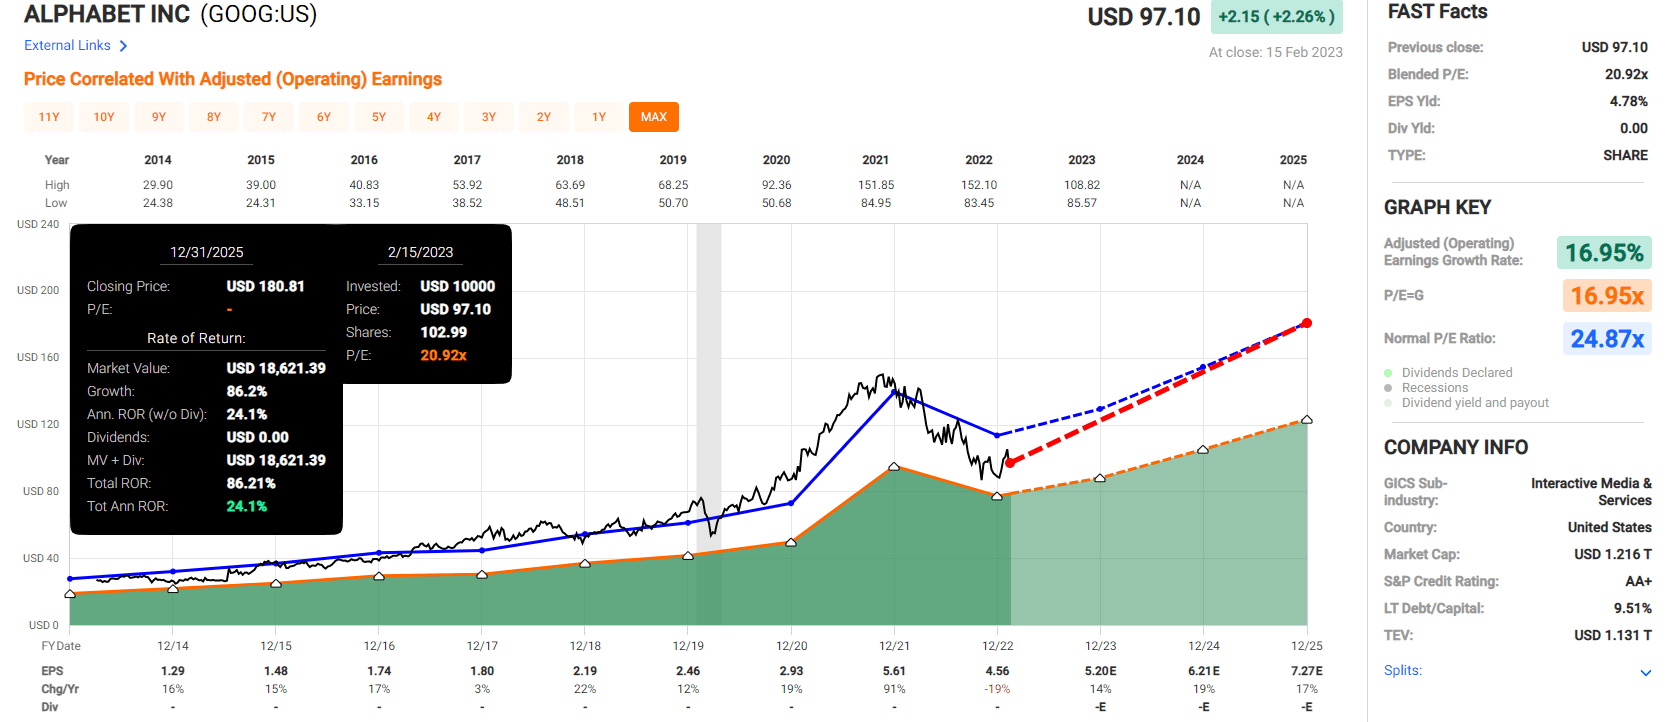
Microsoft 2025 Consensus Return Potential
(Source: FAST Graphs, FactSet)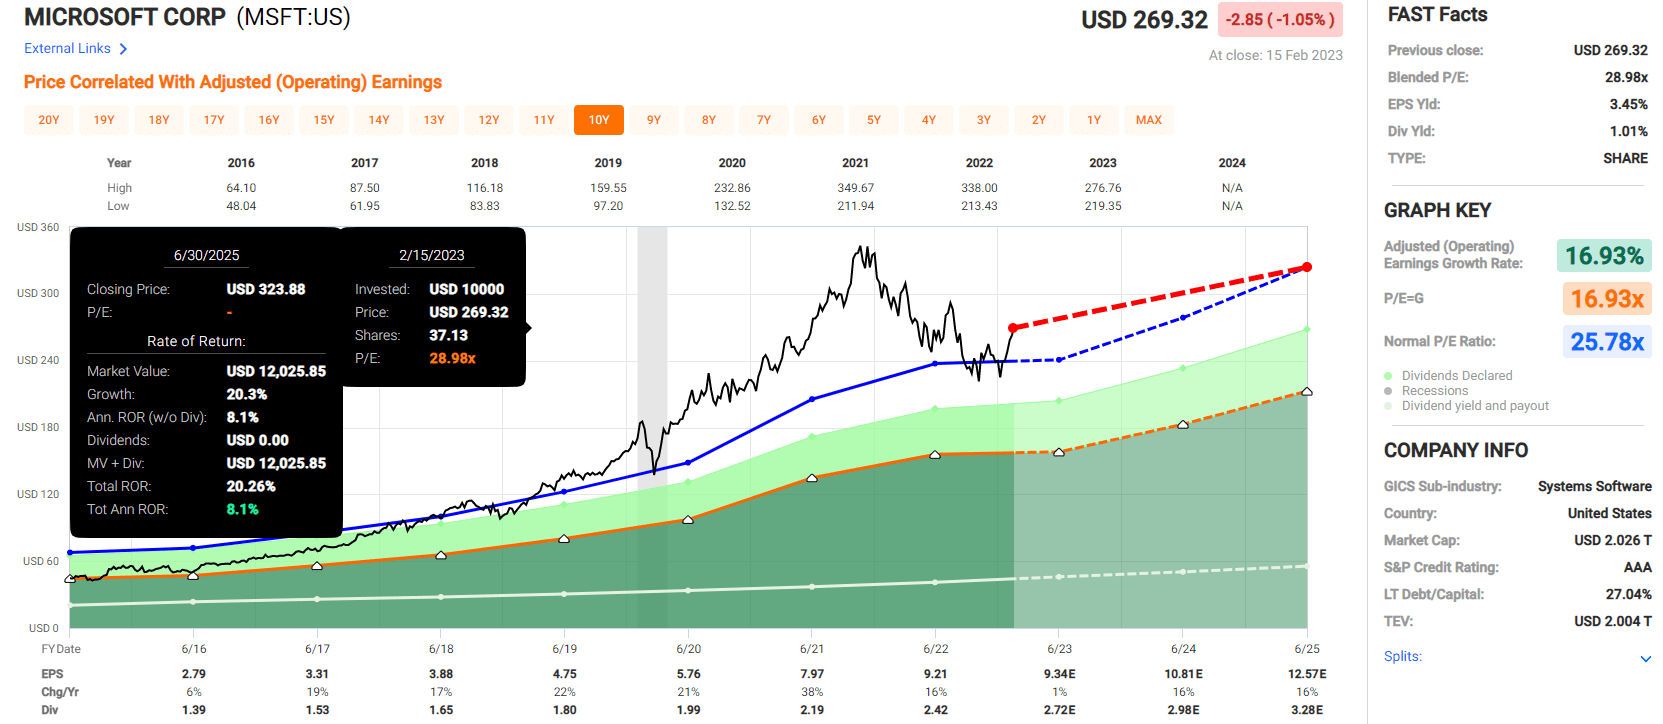
Both GOOG and MSFT are world-beater growth stocks, but GOOG’s 30% better discount to fair value means it has 3X the annular return potential of MSFT in the next three years.
Is GOOG the better business? No, MSFT is more diversified and has a nearly 100% subscription-based business and a slightly stronger balance sheet.
Its long-term risk management is slightly better, in the top 3% of global companies according to S&P, compared to the top 7% for GOOG.
But for new money today, the better buy is clear; GOOG is a smart way to play the recent AI hype with a strong margin of safety.
MSFT has benefited from the hype and offers no margin of safety, though it’s one of the best Buffett-style “wonderful companies at fair prices” on earth.
Both companies offer a similar 14% or so long-term return potential. GOOG’s prodigious free cash flow, which is expected to grow close to 20% per year through 2028, will eventually make it one of the best dividend growth blue chips of the future.
Be the first to comment