

Oat_Phawat
Introduction
Colorado Springs-based Gold Resource (NYSE:GORO) released the second quarter of 2022 results on July 27, 2022.
Note: This article is an update of my article published on May 16, 2022. I have followed GORO on Seeking Alpha since March 2014.
1 – Investment thesis
Gold Resource is produced from one single called the Don David Gold mine. I was pleased with the gold production at the Don David gold mine this quarter, with another over 10K GEOs produced.
GORO Assets map Presentation (Gold Resource)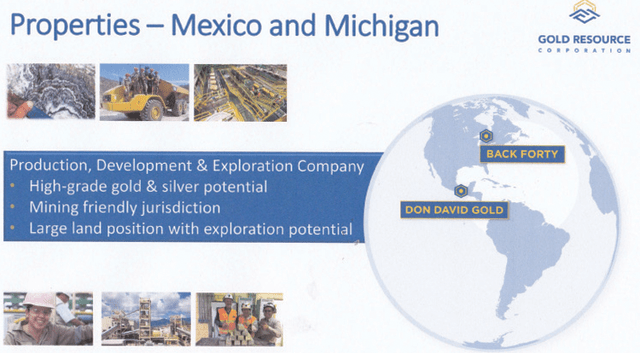
Furthermore, the Back Forty project is advancing smoothly, and the company is still debt-free with $33.34 million in cash and cash equivalent.
The only issue we can see for a long-term investment in GORO is that the company relies on a single gold mine complex in Mexico.
One recent example of a gold miner with only two producing mines that has run into problems recently is New Gold (NGD) with its Rainy River mine. I recommend reading my recent article on the issue here.
The lack of diversification significantly raises the risk attached to a long-term position. The investment thesis could improve if the Back forty project, acquired on September 7, 2021, brings the green light from authorities and starts producing. However, we are talking about 2025 or later.
GORO indicated that the feasibility study work for the Back Forty Project in Michigan, USA, progressed during 2Q22 with completion expected in H2 2022, followed by permit applications being submitted with state agencies in Michigan. It is not an easy project and has some serious opposition.
Allen stated that the Back Forty had all four permits, and Dr. Gedicks corrected him, since the only permit Aquila fully possessed was the NPDES permit for the discharge of 1.52 million gallons of water back into the Menominee River per day. Other permits were not fully granted because they were challenged in legally contested cases. They also did not have the Dam Safety Permit that, according to EGLE of Michigan, is definitely necessary before a shovel ever hits the ground.
The company posted a presentation in May below:
GORO Back Forty Presentation May (Gold Resource)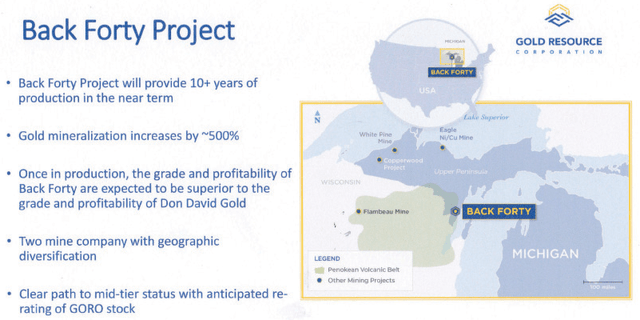
One thorny subject is the dilutive effect of the acquisition, which boosted the shares’ outstanding diluted count to 88.79 million (fully diluted by adding Options, DSUs, RSUs id 91.3 million shares) from 77.91 million in 4Q21. Furthermore, the company is investing a non-negligible CapEx in the project estimated at $33 million to $37 million in 2022, of which $15.66 million have been spent at the end of 2Q22.
Thus, I do not favor investing in a large dollar amount for the long term but recommend holding a small core position while trading short-term LIFO at about 60% of your long position.
2 – Stock performance
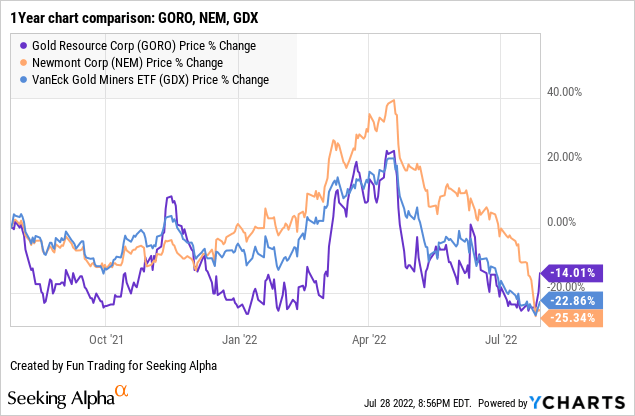
Let’s compare GORO to Newmont Corporation (NEM) and GDX. We can see that the stock recovered recently and is down 14%, outperforming NEM and GDX.
Gold Production For The Second Quarter Of 2022
1 – The gold/silver ratio?
The gold and silver ratio for the second quarter of 2022 is 84.9:1 for Gold Resource. Below are the two historic charts describing the quarterly production Ag and Au equivalent.
GORO Quarterly Gold and Silver production history (Fun Trading)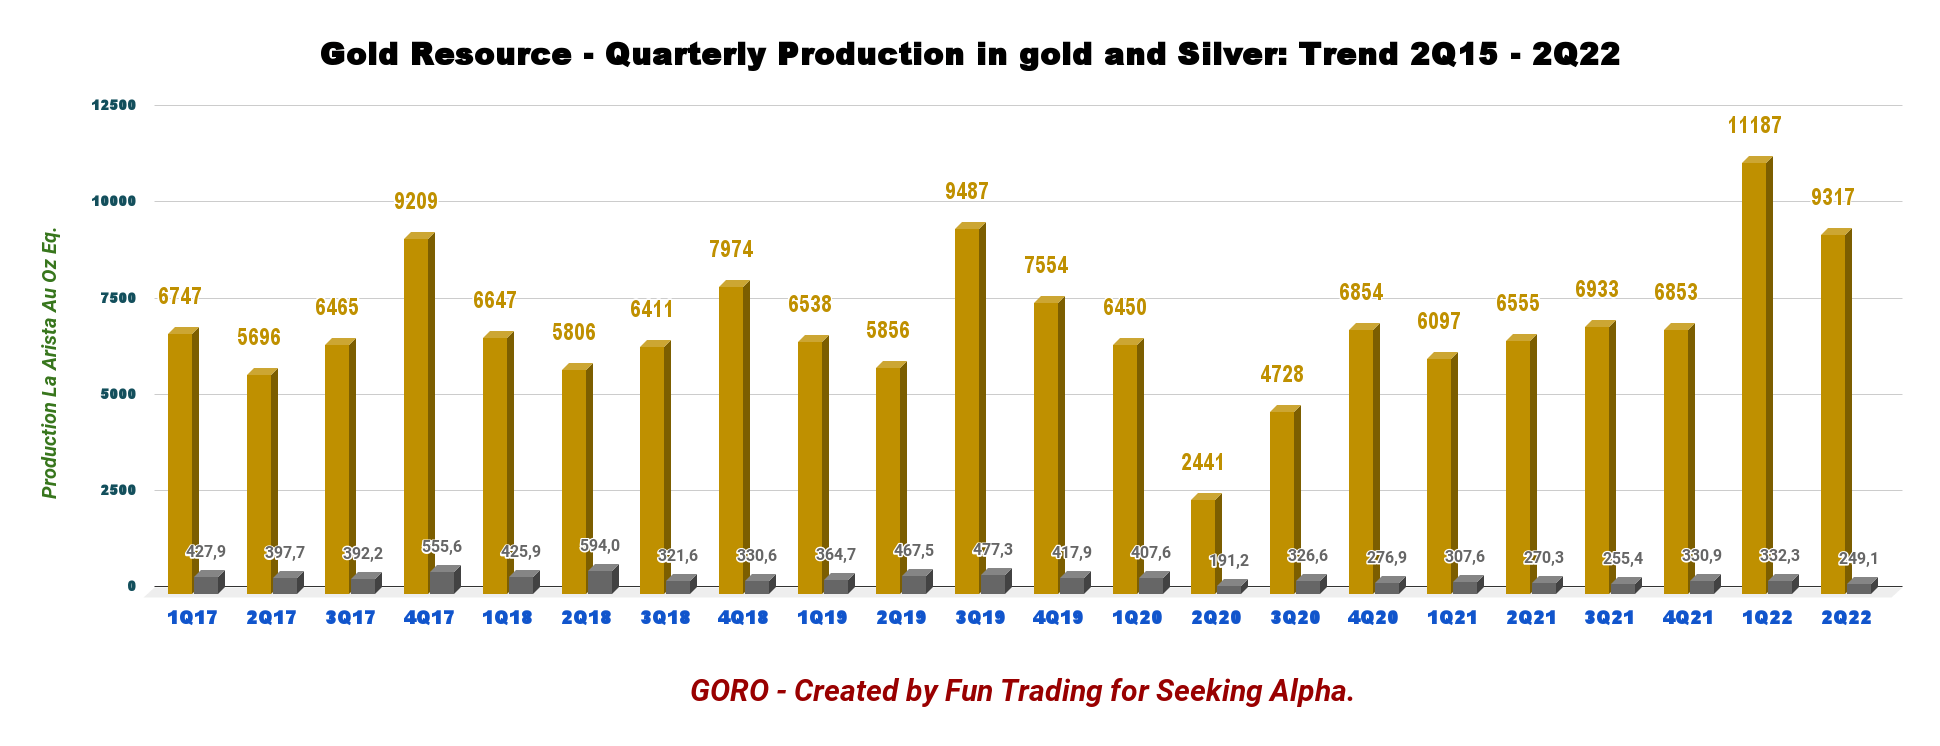
Warning: The 10Q is not clear about what has been produced and what has been sold. For instance, the 1Q22 production equivalent indicated is what has been sold but not produced. The charts below show the production of gold, silver, and base metals.
2 – Quarterly production in a few charts
GORO Quarterly gold equivalent production history (Fun Trading)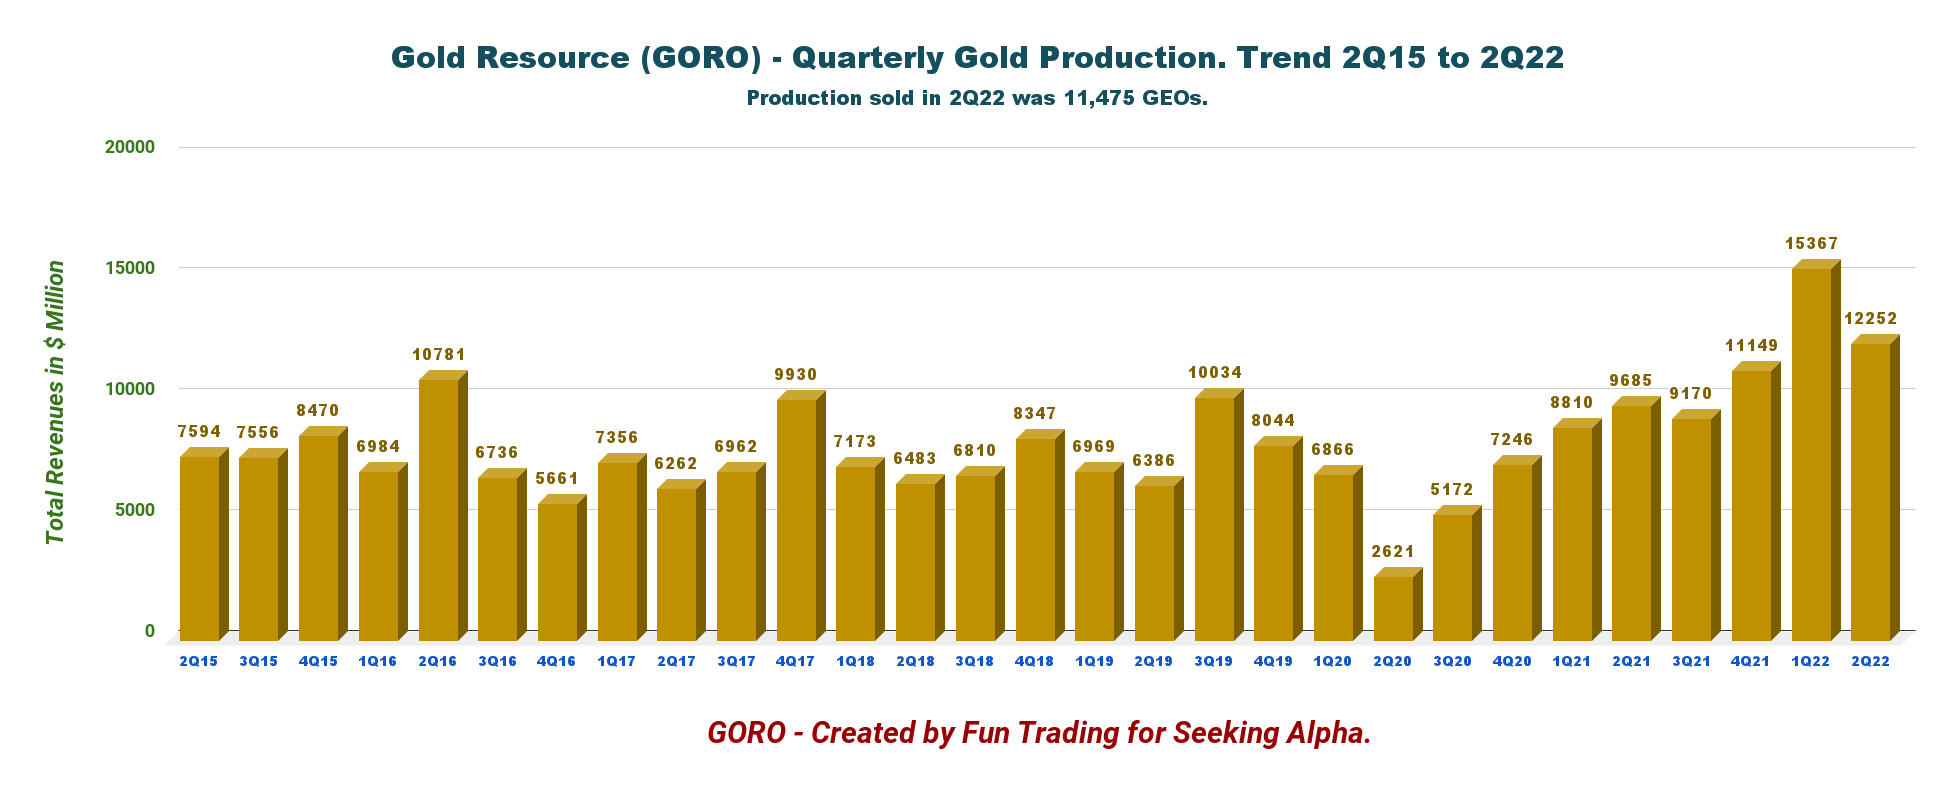
The Gold equivalent production has been estimated based on 9,317 Au ounces and 249,088 Ag ounces. The company has indicated it sold 11,475 GEOs in 2Q22, nearly the same as in 1Q22.
Detailed history, including Copper, Lead, and Zinc.
GORO Production per metals history (Fun Trading)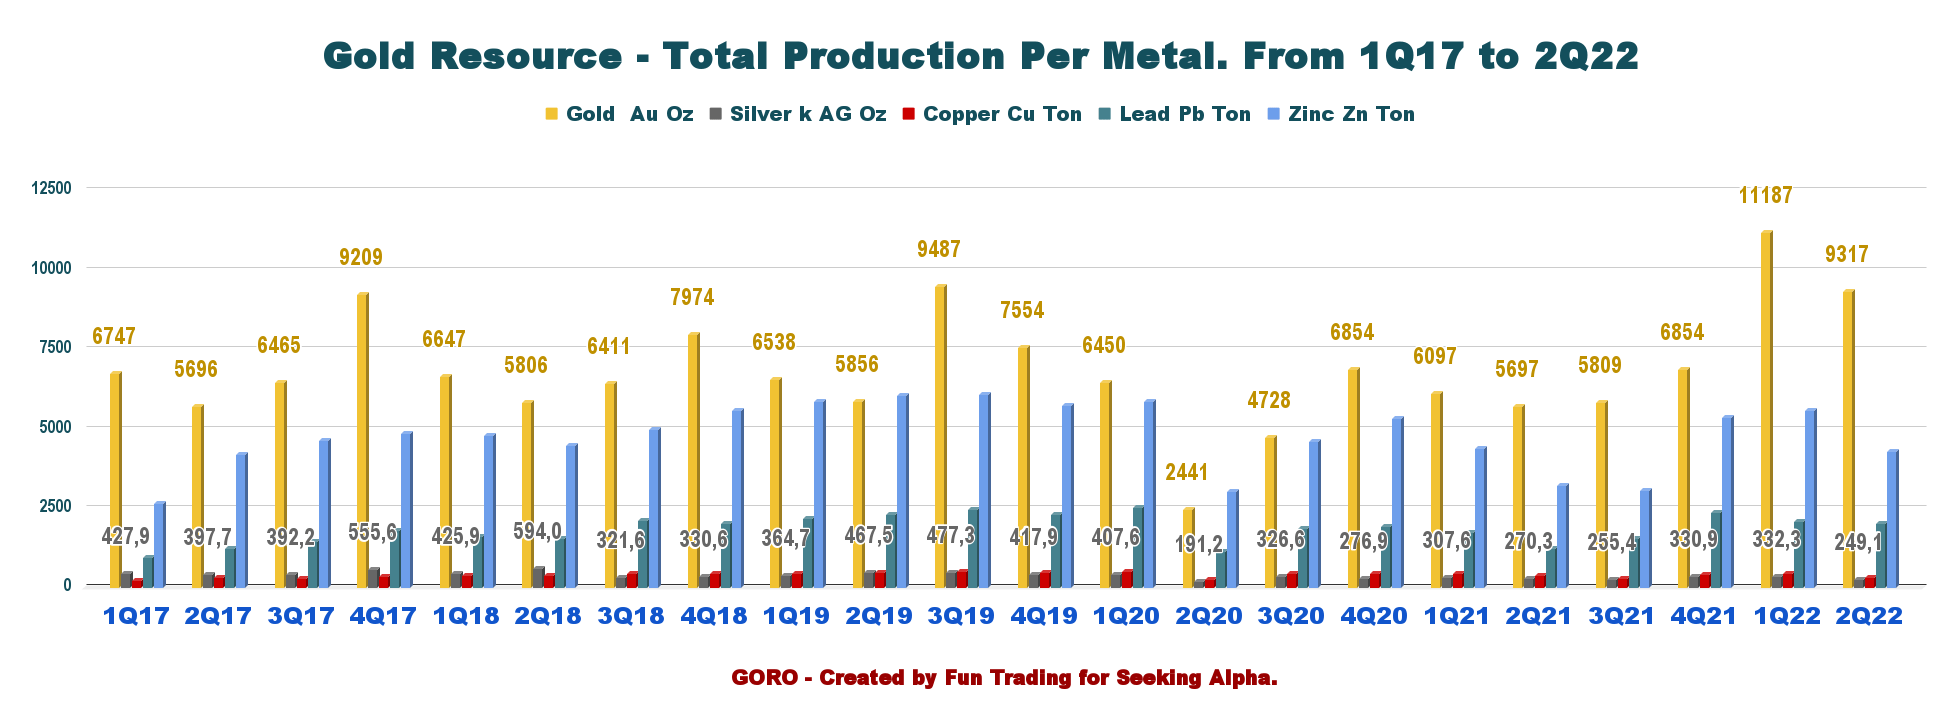
The company indicated a GEO production of an estimated 12,252 Au Eq. Oz. The gold price was $1,874 per ounce, and the silver price was $22.05 per ounce.
During the second quarter, GORO processed ore at an average rate of 1,516 TPD compared with 1,506 TPD in 2Q21. The average gold grade g/t was 2.63 in 2Q22 compared to 1.91 g/t in 2Q21.
Gold Resource sold (with gold and silver as co-products) 11,475 Au Eq, including 2,724 Au Eq. Oz (silver) and 8,746 Au Oz, in 2Q22. The company also produced copper (303 tonnes), lead (2,020 tonnes), and zinc (4,282 tonnes) at its Mexican mines.
Below are the historical details of the metals produced.
| Detailed Production | 2Q21 | 3Q21 | 4Q21 | 1Q22 | 2Q22 |
| Gold Au Oz | 5,697 | 5,809 | 6,854 | 11,187 | 9,317 |
| Silver K AG Oz | 270.3 | 255.4 | 330.9 | 332.3 | 249.09 |
| Copper Cu Ton | 365 | 268 | 413 | 431 | 303 |
| Lead Pb Ton | 1,214 | 1,550 | 2,345 | 2,073 | 2,020 |
| Zinc Zn Ton | 3,193 | 3,059 | 5,349 | 5,562 | 4,282 |
Source: Fun Trading
4 – All-in sustaining costs or AISC/GEO (co-product)
The AISC per GEO in the second quarter of 2022 was $799 per ounce, well below the 2Q21 of $1,254 per GEO.
GORO Quarterly AISC per GEO history (Fun Trading)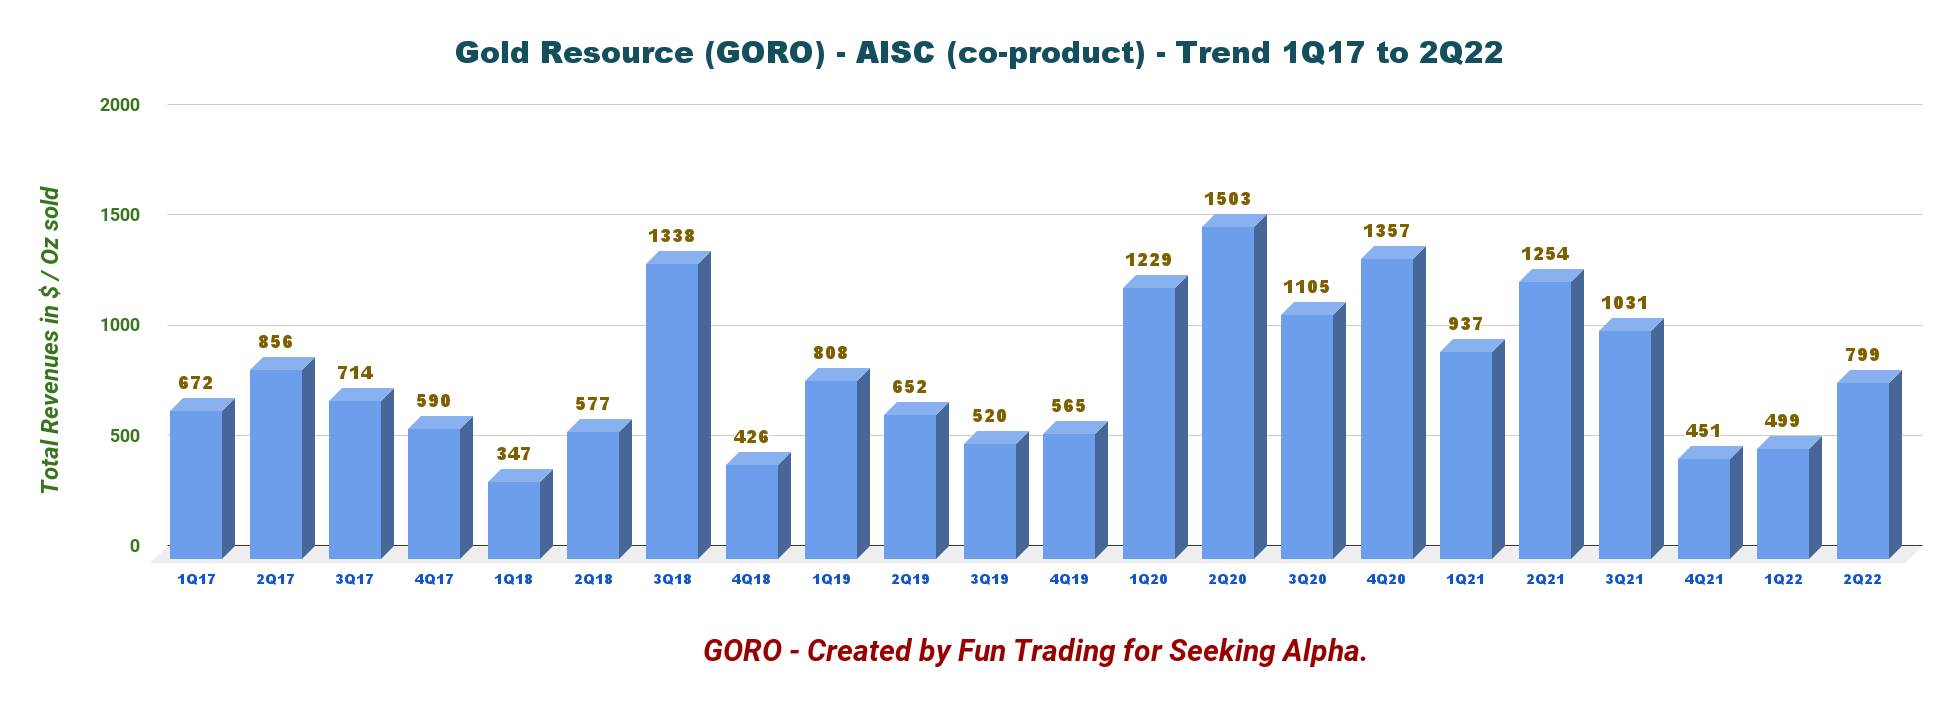
Balance Sheet And Production In 2Q22. The Raw Numbers
| Gold Resource | 2Q21 | 3Q21 | 4Q21 | 1Q22 | 2Q22 |
| Total Revenues in $ Million | 30.84 | 29.03 | 38.06 | 45.42 | 37.06 |
| Net Income in $ Million | 1.28 | 1.53 | 2.69 | 4.02 | 2.67 |
| EBITDA $ Million | 7.62 | 7.61 | 15.32 | 15.55 | 13.72* |
| EPS diluted in $/share | 0.02 | 0.02 | 0.04 | 0.05 | 0.03 |
| Cash from operating activities in $ Million | 9.30 | 5.74 | 12.91 | 4.23 | 7.98 |
| Capital Expenditure in $ Million | 5.01 | 5.88 | 5.39 | 5.95 | 4.57 |
| Free Cash Flow in $ Million | 4.29 | -0.14 | 7.52 | -1.72 | 3.41 |
| Cash and short-term investments (+Au/Ag bullion) $ Million | 31.16 | 30.10 | 34.3 | 31.18 | 33.34** |
| Long-term Debt in $ Million | 0 | 0 | 0 | 0 | 0 |
| Quarterly Dividend per share in $ | 0.01 | 0.01 | 0.01 | 0.01 | 0.01 |
| Shares outstanding (diluted) in Million |
74.8 |
74.90 |
77.91 |
88.62 |
88.79 |
Source: Company 10-Q and from personal files.
* EBITDA indicated by the company
** Cash and Cash on hand only. The company may also have gold bullion but could not find it in the 10Q.
Balance Sheet Discussion
1 – Revenues were $37.06 million in 2Q22
GORO Quarterly Revenues history (Fun Trading)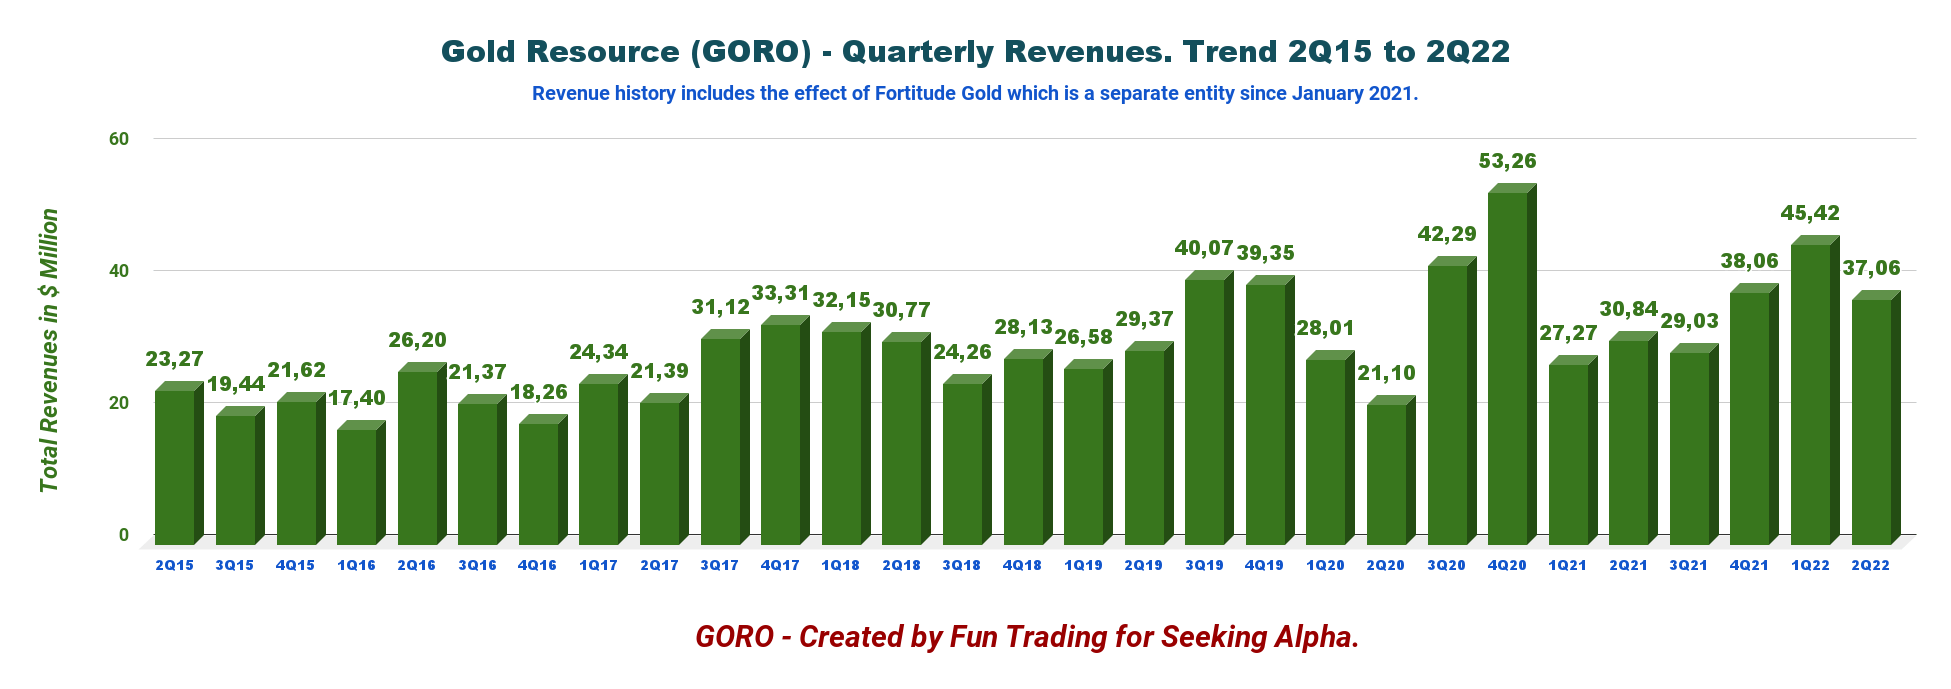
Note: Fortitude (FTPO) was spun-off in 4Q20.
The gold and silver producer reported an income per share of $0.03 on revenue of $37.064 million compared with a pay per share of $0.02 on revenue of $30.84 million in the last year’s second quarter (please look at the table above for more financial details).
Note: GORO’s Mexican assets are also called the Don David Gold Mine complex.
The company posted a net income of $2.673 million during the second quarter compared to $1.28 million a year ago.
After by-product credits, Don David Gold Mine’s total cash cost was $247 per gold equivalent ounce sold. All-in sustaining costs were $799 per gold equivalent ounce sold.
President and CEO Allen Palmiere said in the 10Q:
Production remains solid at the Don David Gold Mine in Mexico with significant improvements in financial measures over the same period last year. The volume of tonnes processed during the quarter declined slightly from Q1 as we continue to address ground support challenges common to our type of mineral deposit. Grades and improved recoveries helped ensure we delivered another quarter of over 10 thousand gold equivalent ounces. We continue to be committed to having a disciplined focus on costs in the current inflationary market and would like to reiterate our 2022 guidance.
2 – Gold Resource’s free cash flow is estimated at $3.41 million in 2Q22
GORO Quarterly free cash flow history (Fun Trading) The company estimated free cash flow for Q2 is $3.41 million, and the trailing 12-month free cash flow was $9.07 million.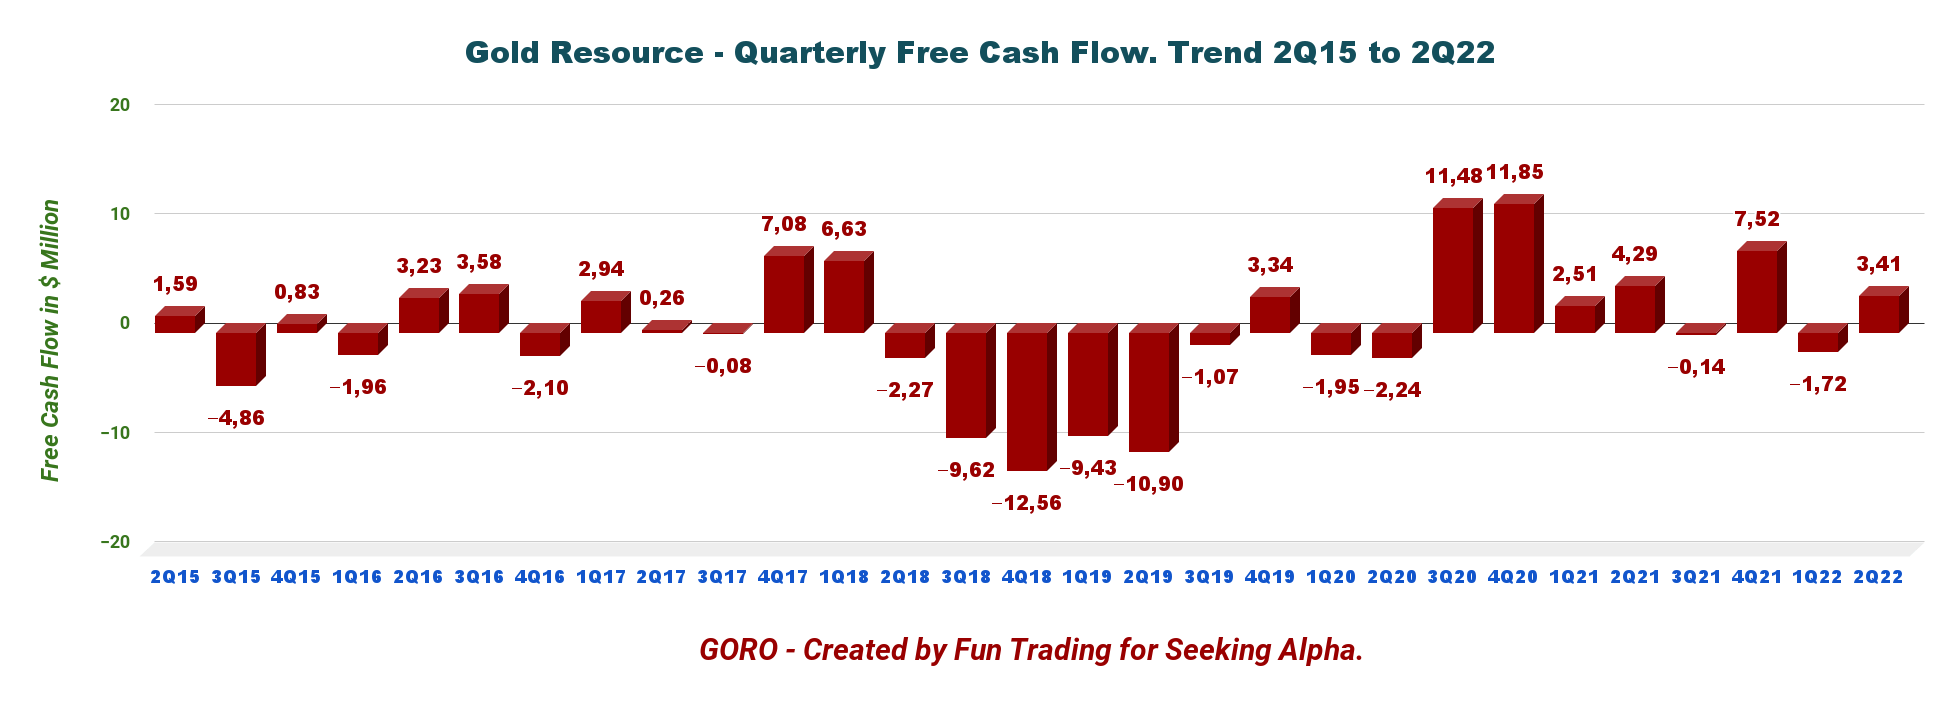
Gold Resource pays a yearly dividend of $0.04 per share or a dividend yield of 2.26%, covered by free cash flow.
3 – Cash is now $33.34 million, and the company has no debt
Gold Resource has an excellent cash position of $33.335 million in 2Q22 and no long-term debt. It is an excellent cash profile. However, assuming the company gets all permits for the Back Forty project, the company will have to secure financing.
GORO Quarterly Cash versus Debt history (Fun Trading)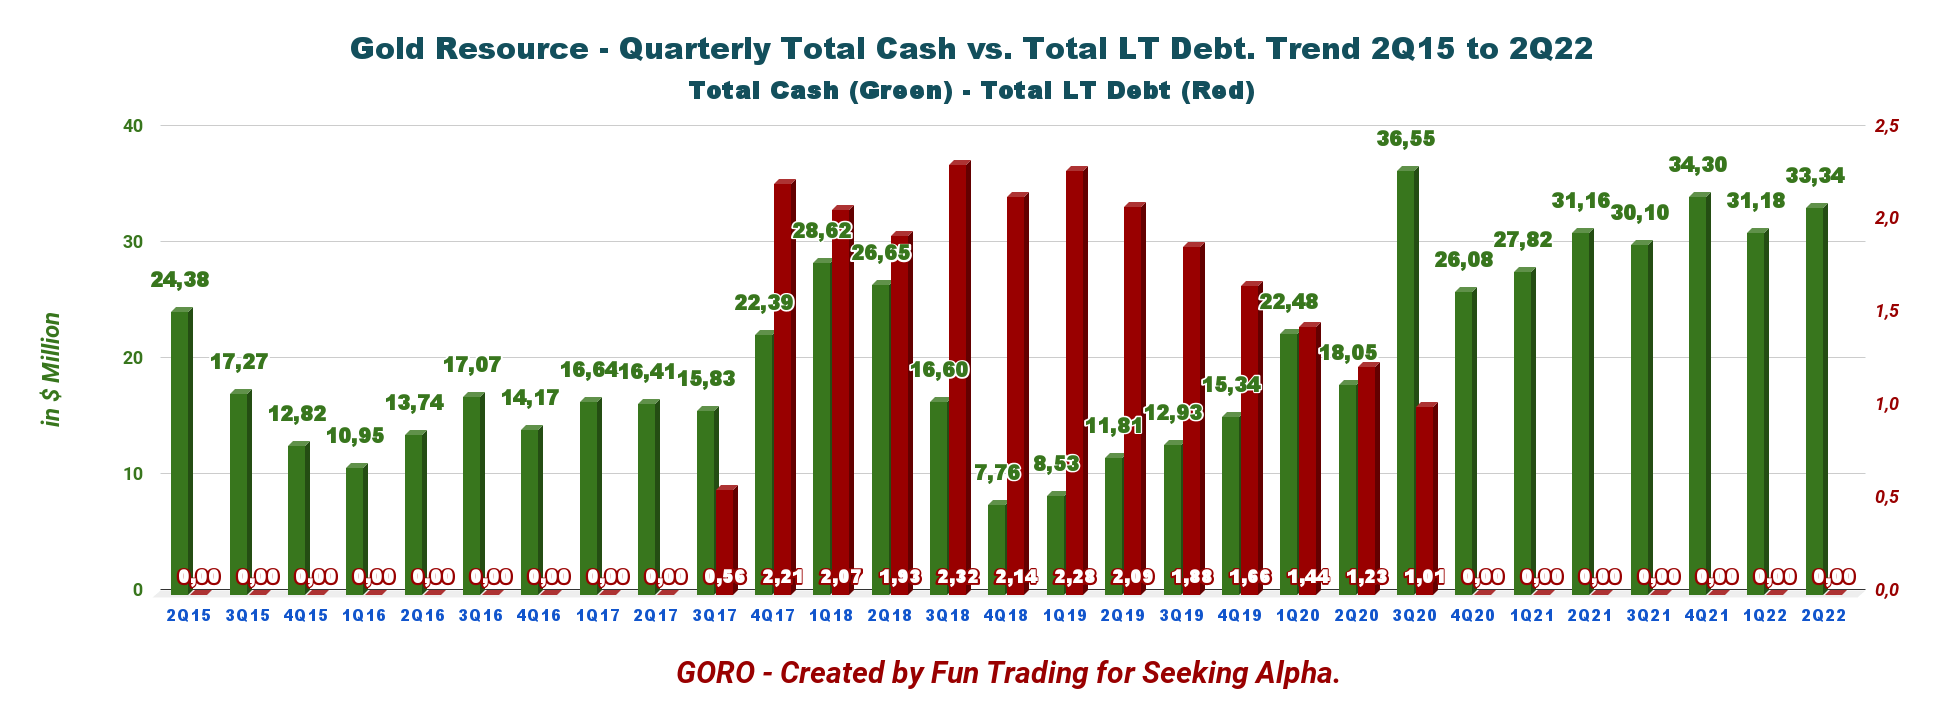
4 – Guidance 2022 – Payable production of 24K-26K Au Oz and 900K-1,000K Ag Oz. The company reiterated 2022 production and cash guidance
GORO 2022 Guidance (Gold Resource)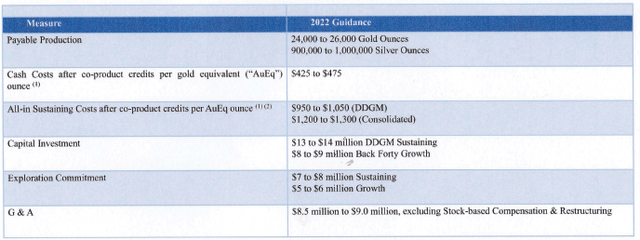
Technical Analysis (Short Term)And Commentary
GORO TA Chart short-term (Fun Trading)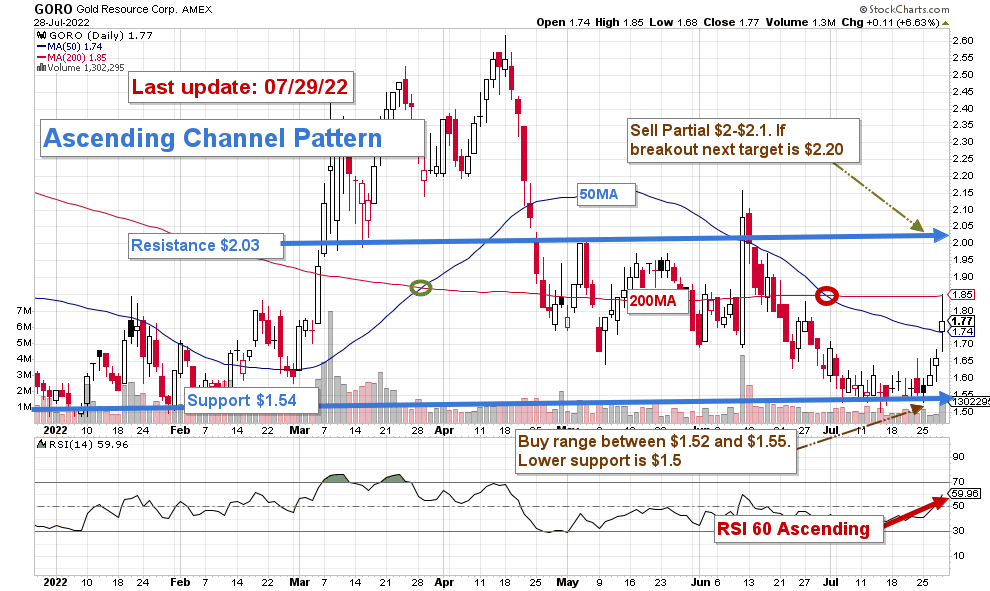
Note: The chart has been adjusted for the dividend.
GORO forms an ascending channel pattern with resistance at $2.03 and support at $1.54.
The short-term trading strategy is to sell between $2 and $2.10, about 40% of your position, and wait for a retracement between $1.60 and $1.50 to buy back gradually. However, mid-term resistance/support is between $1.74 (50MA) and $1.85 (200MA), where you could eventually sell a portion of your short-term position.
As I regularly recommend to my subscribers in my marketplace, “The Gold and Oil Corner,” I firmly suggest trading short-term LIFO about 40% of your long-term position to take advantage of the volatility and unforeseen events.
Watch the gold price and the Fed like a hawk.
Note: The LIFO method is prohibited under International Financial Reporting Standards (IFRS), though it is permitted in the United States by Generally Accepted Accounting Principles (GAAP). Therefore, only US traders can apply this method. Those who cannot trade LIFO can use an alternative by setting two different accounts for the same stock, one for the long term and one for short-term trading.
Warning: The TA chart must be updated frequently to be relevant. It is what I am doing in my stock tracker. The chart above has a possible validity of about a week. Remember, the TA chart is a tool only to help you adopt the right strategy. It is not a way to foresee the future. No one and nothing can.
Author’s note: If you find value in this article and would like to encourage such continued efforts, please click the “Like” button below as a vote of support. Thanks.
Be the first to comment