

Gold Talking Points:
- Gold prices have gained as much as 5% since hitting a fresh three-month-low in mid-May.
- That recovery has been uneven, however, with buyers showing considerably more motivation around support or at lows than what’s shown at resistance. This has allowed for the build of a rising wedge pattern, often approached with the aim of bearish reversals. This combines with a key area of resistance on the chart that’s looked at below.
- The analysis contained in article relies on price action and chart formations. To learn more about price action or chart patterns, check out our DailyFX Education section.
Gold bears came into the month of May with a full head of steam…
The setup had built through late-April trade. I had looked at a setup that showed Gold prices peering over the ledge ahead of the May open, and that hit in a big way as the month progressed. On May 9th I looked at another possible breakdown and that move hit aggressively in the week after, with Gold prices finally setting a fresh three-month-low at 1785 on May 16th.
But since that fresh low has printed Gold prices have been in recovery mode. This seems to go along with a number of other risk-sensitive themes, such as stocks clawing back prior losses. And, if you take all of this with context of the bigger-picture, it makes sense that what we’ve seen so far is corrective pullback and not necessarily trend-changing. Both stocks and Gold had become quite oversold last month and the pressure points that were driving the move saw some element of calm as there wasn’t major focus on Central Banks and a lessened level of focus on inflation.
But, those data points are coming back into the headlines this week as we have Central Bank rate decisions from Europe and Australia to go along with inflation data out of China and the United States. And then next week, of course, brings the FOMC into the mix for the June rate decision where they’re widely-expected to hike by 50 basis points. More pressing, however, will be the dot plot matrix where the Fed communicates their plans for the rest of the year. This is where some disagreement still exists, such as we saw last week with Lael Brainard talking about the September rate decision while markets have baked-in expectations for hikes in both June and July.
Where this is pertinent to Gold: That fundamental backdrop coincides with a possible reversal formation that’s built. That recovery in Gold has been uneven in the fact that buyers have been considerably more motivated at lows or near support than what’s shown at highs or near resistance. This shows the recovery in Gold taking on the form of a rising wedge, which is often approached with the aim of bearish reversals which, in this case, could keep the door open for a deeper bearish move.
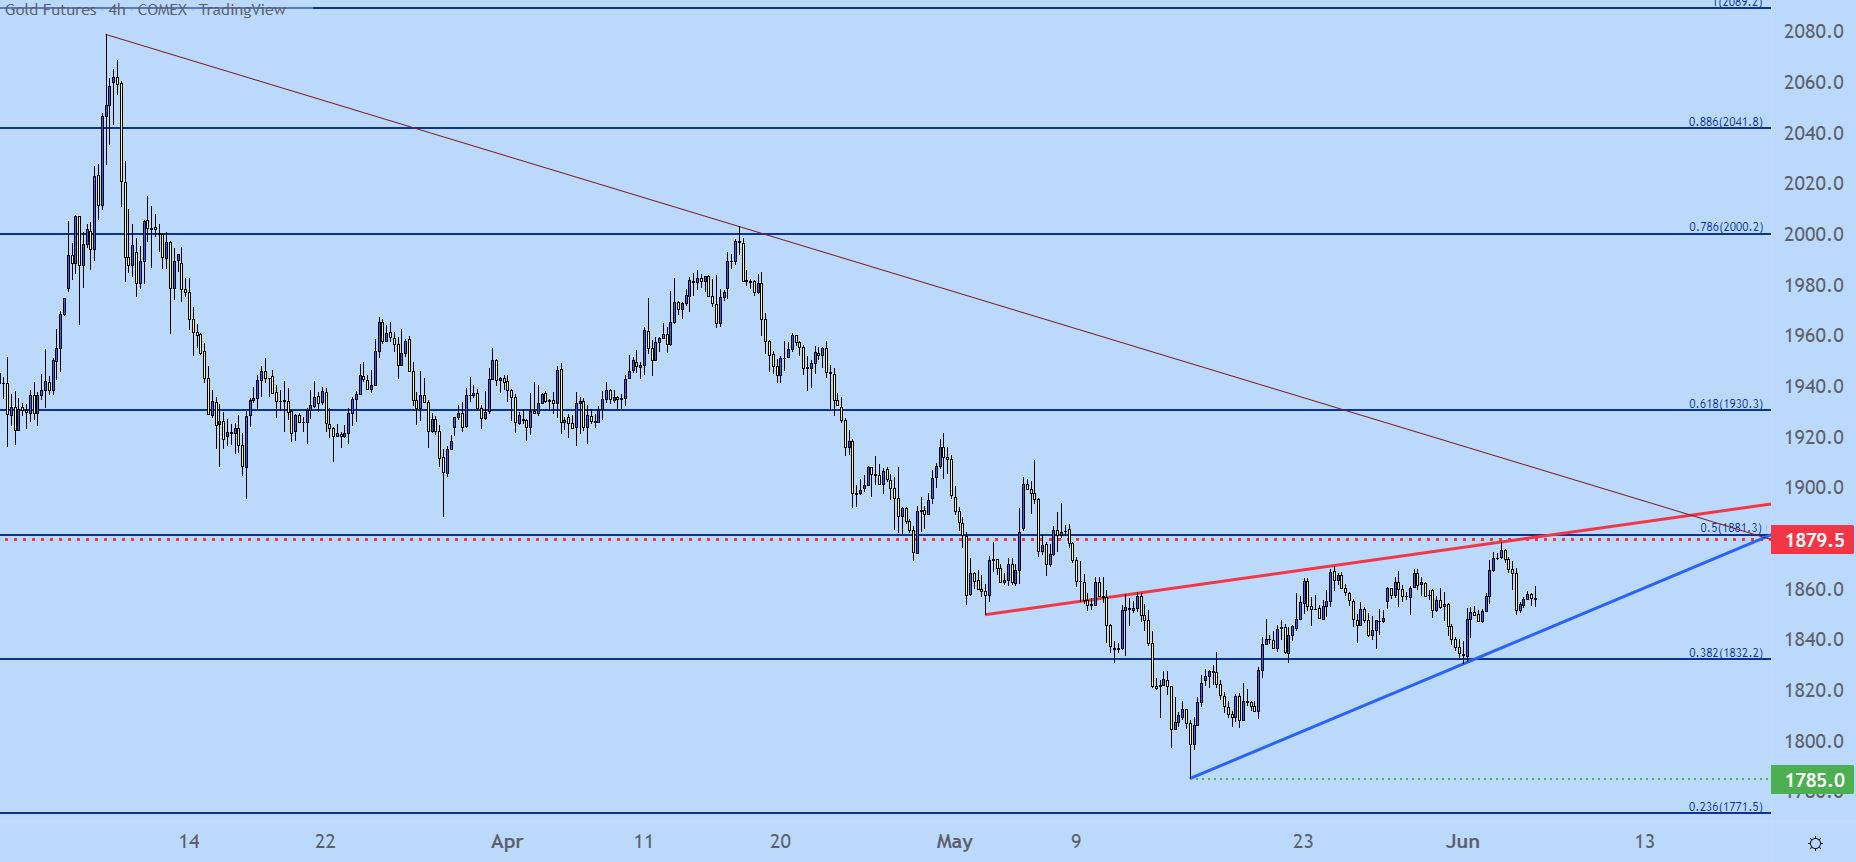
Gold Four-Hour Price Chart
Chart prepared by James Stanley; Gold on Tradingview
Gold Levels
The spot at which this formation is building is a key one. The level of 1881.30 is the 50% marker of the August 2020 – March 2021 major move. This was a pullback that’s defined the range that Gold prices have continued to hold in for more than a year since; and there’s been a number of inflections at these price levels as Gold has gyrated over the past year and change.
This level is also very nearby a prior swing-high from last November, which then became support in Q1 of this year. I’m tracking this zone from around 1879 up to that 1881 level, and this lower-high resistance keeps the door open for bears, particularly when taken with the shorter-term rising wedge formation looked at above.
Gold Weekly Price Chart
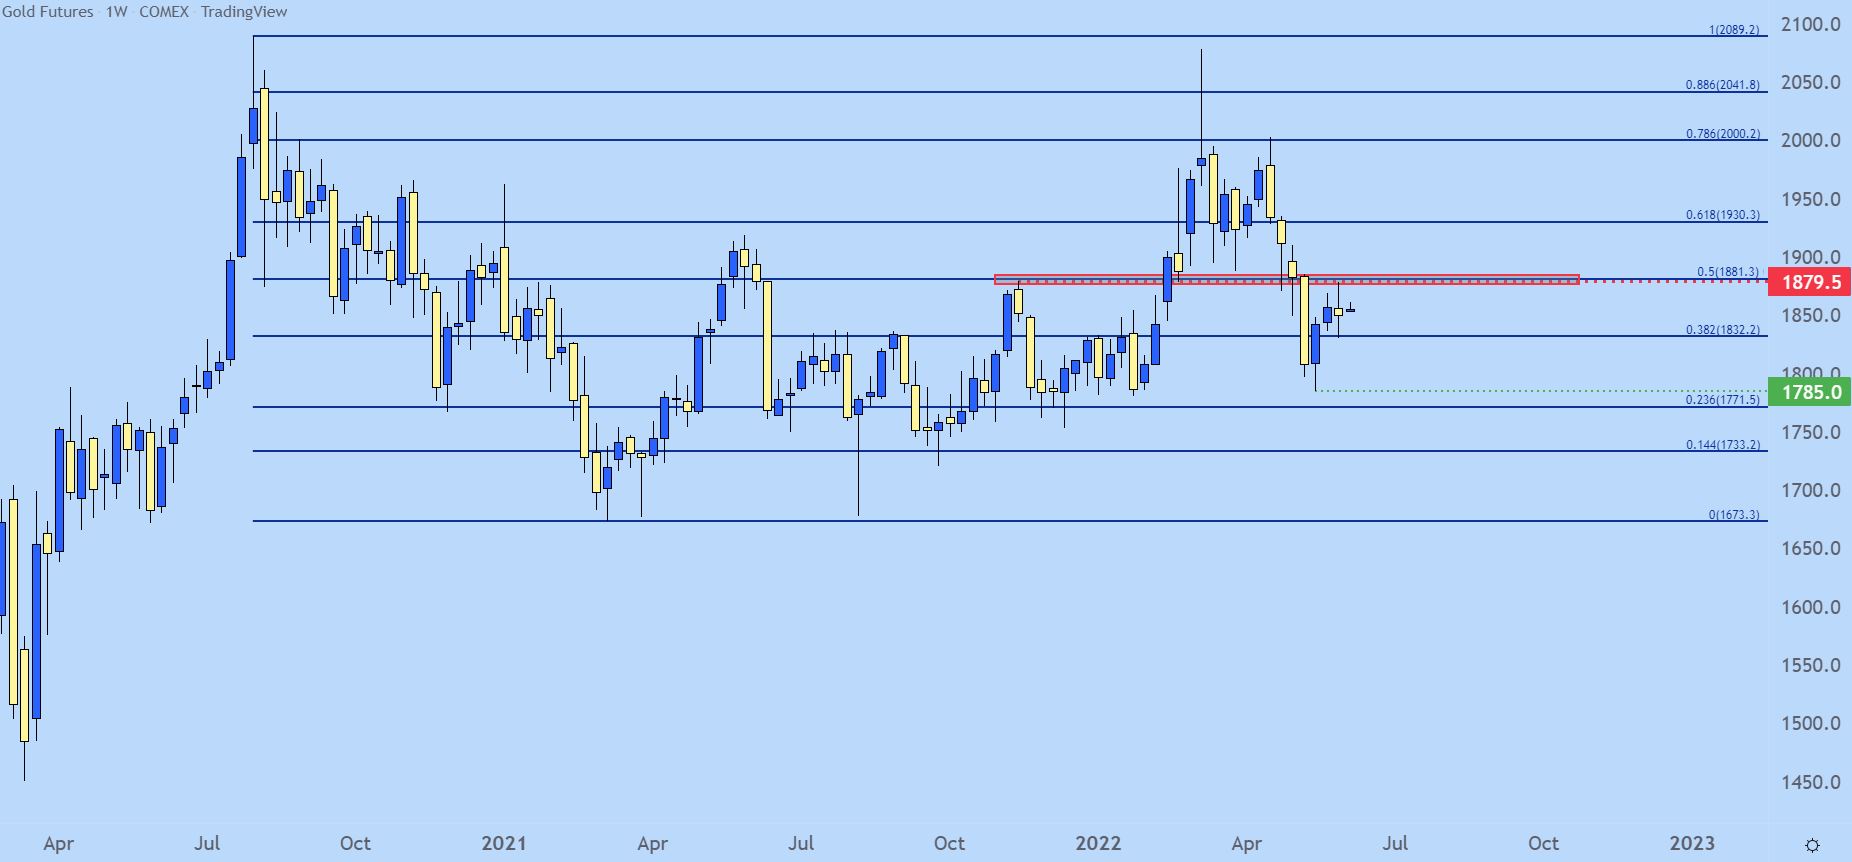
Chart prepared by James Stanley; Gold on Tradingview
Gold Shorter-Term
At this point we’ve already seen a reaction at resistance last week on Friday. After NFP, Gold prices put in a one-sided sell-off but didn’t quite print as a bearish engulf on the daily chart. And so far this week, bears haven’t yet been able to continue the move-lower, which does keep open the possibility of another probe at or around resistance before bears are able to take-control.
And I mention this due to timing… This week’s economic calendar is loaded with risk events pertinent to the inflation picture, with U.S. CPI set to be released on Friday ahead of next week’s FOMC rate decision. And also on this week’s calendar is an ECB rate decision on Thursday. Each of these high-impact events can bring volatility to Gold markets but they’re both more than a few days away.
For levels of note, there’s a batch of swing highs around the 1911 level and if bulls are able to pose a breach through that this week, the bearish theme won’t look so attractive any longer. This could be seen as an area of invalidation for bearish themes.
On a short-term basis, a breach of last Thursday’s support at 1846 opens the door for a move down to a bigger-picture support level at 1832. This is the same level that I was talking about last month which is the 38.2% Fibonacci retracement of the same major move looked at above. If sellers can test through 1831, the door opens for a larger downside move.
Gold Daily Price Chart
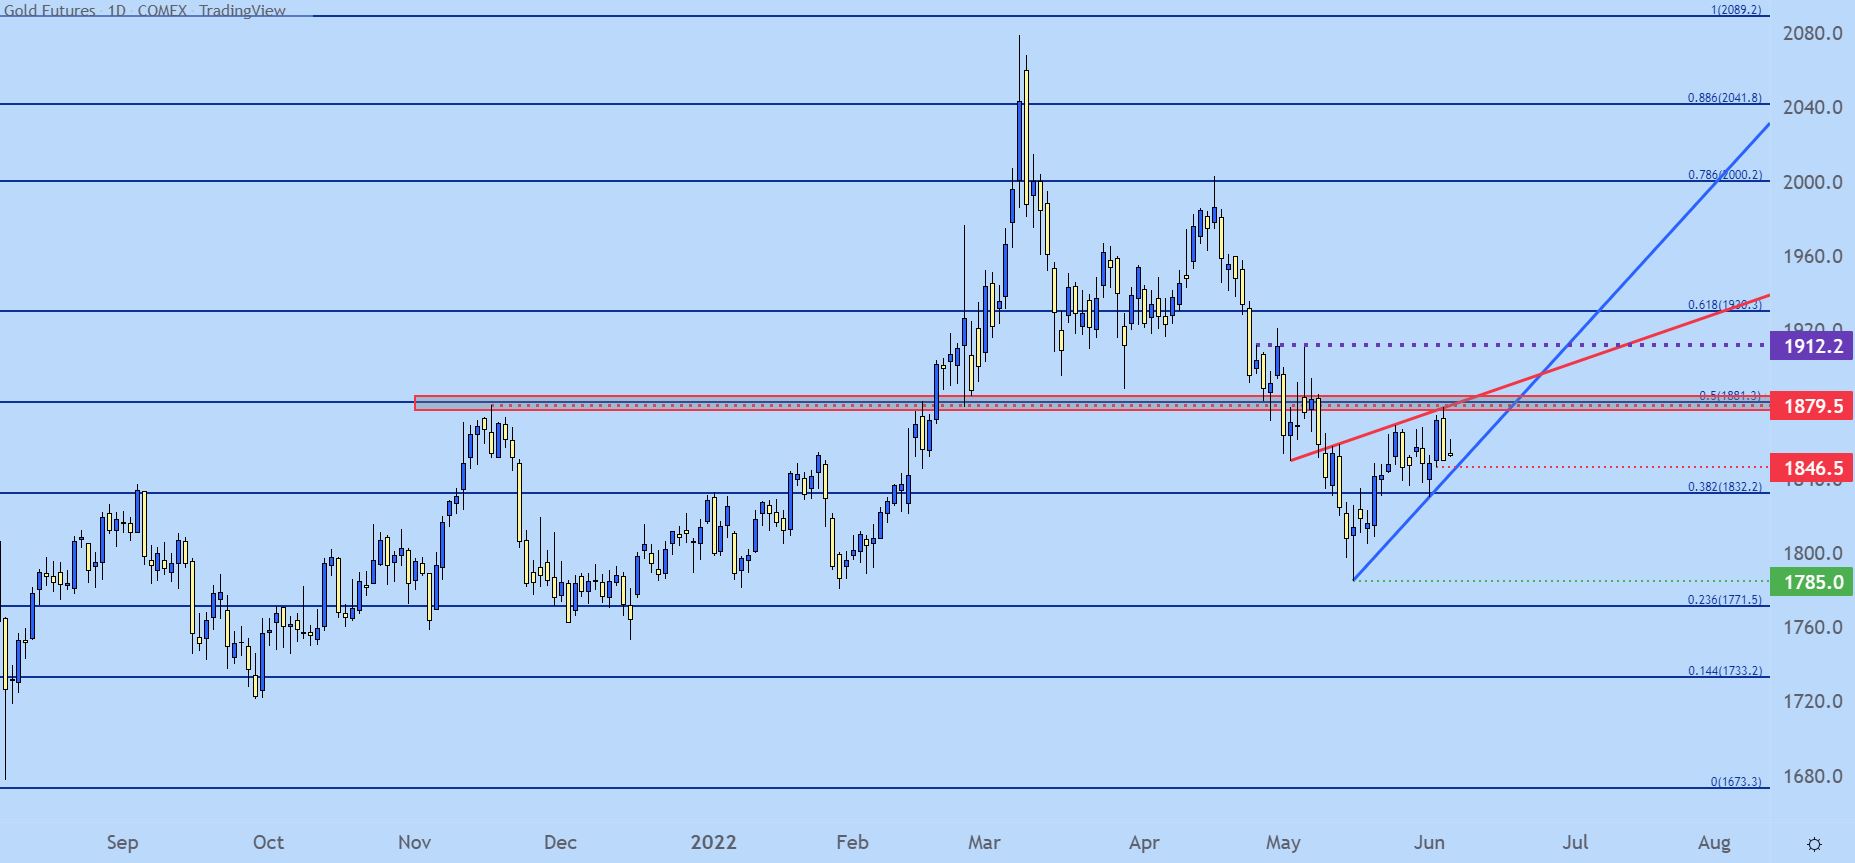
Chart prepared by James Stanley; Gold on Tradingview
— Written by James Stanley, Senior Strategist for DailyFX.com
Contact and follow James on Twitter: @JStanleyFX
Be the first to comment