

Gold Price (XAU/USD), Chart, and Analysis
- Wild swings in gold as risk turns off and on.
- US inflation data this afternoon may move the dial.
- Retail traders cut back their short positions.
The wild price action seen in the gold space on Thursday has calmed today with the precious metal sitting quietly in a very small range so far. Gold hit the mid-$1970s/oz yesterday on news that Russia had invaded Ukraine but then turned sharply lower and negative on the day in late-European trade as a wave of risk-on sentiment swept over the markets, led by sharp turnarounds in the Nasdaq and the cryptocurrency space. With no clear driver identified behind this move, gold will remain on edge over the coming days and weeks.
Later today we have the Fed’s favored inflation reading, Core PCE, released at 13.30 GMT and this is expected to show that inflation continues to move higher, ratcheting up the pressure on the Fed to hike rates hard and fast. The volatile situation in Eastern Europe however may stimy the Fed’s plans, in the short-term at least, leaving gold with the room to move higher. On the other hand, if energy prices continue to hit multi-year highs, then headline inflation will jump further, forcing the Fed to react quickly and decisively. Either way, expect more volatile market conditions ahead.
For all market-moving data releases and events, check out the DailyFX Calendar
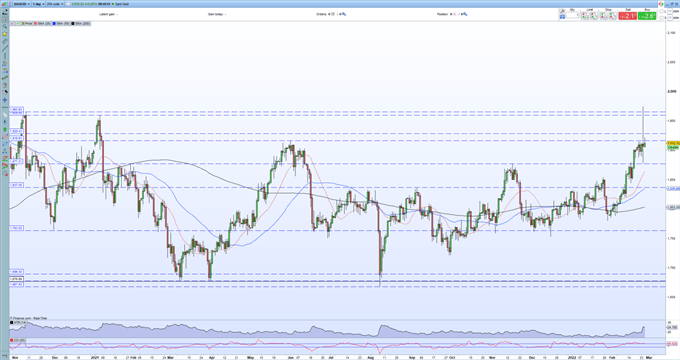
Thursday’s $100/oz. candle shocked many market participants, especially after the precious metal soared to over $1,970/oz. in early trade. The sell-off later in the day looked like a risk-on squeeze, with risk-on markets bid strongly and risk-off markets hit lower. This sent gold tumbling lower before the move came to a halt at $1,877/oz. the same level as a swing high made in mid-November. The indecision in the market yesterday is highlighted by the open and close being with a couple of dollars of each other. Gold is now trading on either side of $1,916/oz. another prior swing high that was made at the end of May last year. If this is confirmed as support, then there is very little in the way of resistance all the way back up to Thursday’s high.
Gold Daily Price Chart – February 25, 2022
Retail trader data 74.61% of traders are net-long with the ratio of traders long to short at 2.94 to 1. The number of traders net-long is 1.53% lower than yesterday and 8.23% higher from last week, while the number of traders net-short is 25.40% lower than yesterday and 41.64% lower from last week.
We typically take a contrarian view to crowd sentiment, and the fact traders are net-long suggests Gold prices may continue to fall. Traders are further net-long than yesterday and last week, and the combination of current sentiment and recent changes gives us a stronger Gold-bearish contrarian trading bias.
What is your view on Gold – bullish or bearish?? You can let us know via the form at the end of this piece or you can contact the author via Twitter @nickcawley1.
Be the first to comment