

Gold Price (XAU/USD), Chart, and Analysis
- The Fed dot plot now shows a terminal rate of 5.1% at the end of 2023.
- Gold may test short-term support around $1,766/oz.
Recommended by Nick Cawley
Traits of Successful Traders
The US Federal Reserve hiked rates by half-a-percentage point last night to 4.25% -4.50%, in line with market expectations, its highest level in 15 years. While the move was fully expected, Fed chair Powell added a pessimistic tone to proceedings at the press conference. While recognizing the recent downturn in inflation, Powell said that it will take ‘substantially more evidence to have confidence that inflation is on a downward path’. Added to this the earlier Fed dot plot – a chart of each Fed official’s short-term rate expectations – showed rates are projected to rise throughout 2023 to a terminal rate of 5.1% at the end of the year. This terminal rate is 0.5% higher than the Fed’s last projection back in September.
Dollar Surges and S&P 500 Drops After Fed Hikes Rates by 50bps, Raises 2023 Forecast
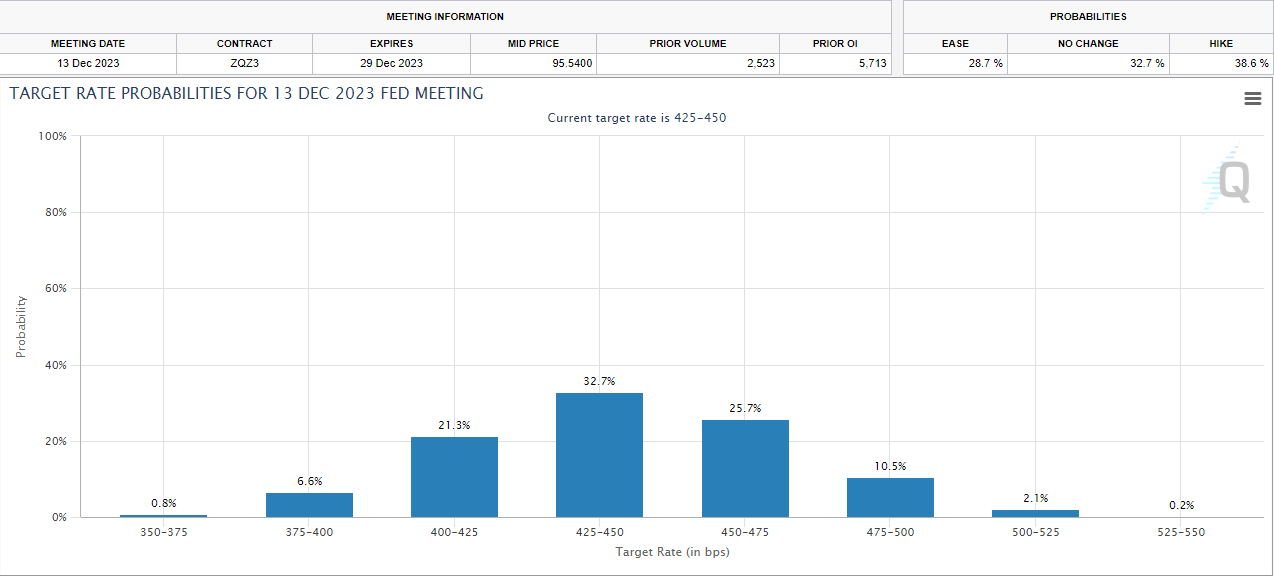
Post-FOMC the US dollar picked up, and US Treasury yields moved higher, although both moves were muted due to a different market view on the path of US rates. While the Fed is looking at a peak rate of 5.1% in December 2023 and the first rate cut in 2024 at the earliest, the market is suggesting otherwise. Using the CME FedWatch tool, financial markets expect a Fed Fund rate of 4.25%-4.50% at the end of 2023, down from a peak of 4.75%-5.0% in late-September.
Recommended by Nick Cawley
How to Trade Gold
The price of gold fell sharply post-FOMC, wiping out all of this week’s gains. The precious metal balked at an area of resistance between $1,807/oz. and $1,810/oz. and looks set to test short-term support around $1,766/oz. For gold to resume its move higher it needs to reclaim the 200-day moving average, currently at &1,787/oz. and to make a confirmed break back above overhead resistance.
Forex Trading Patterns – What Happens Next?
Gold Daily Price Chart – December 15, 2022
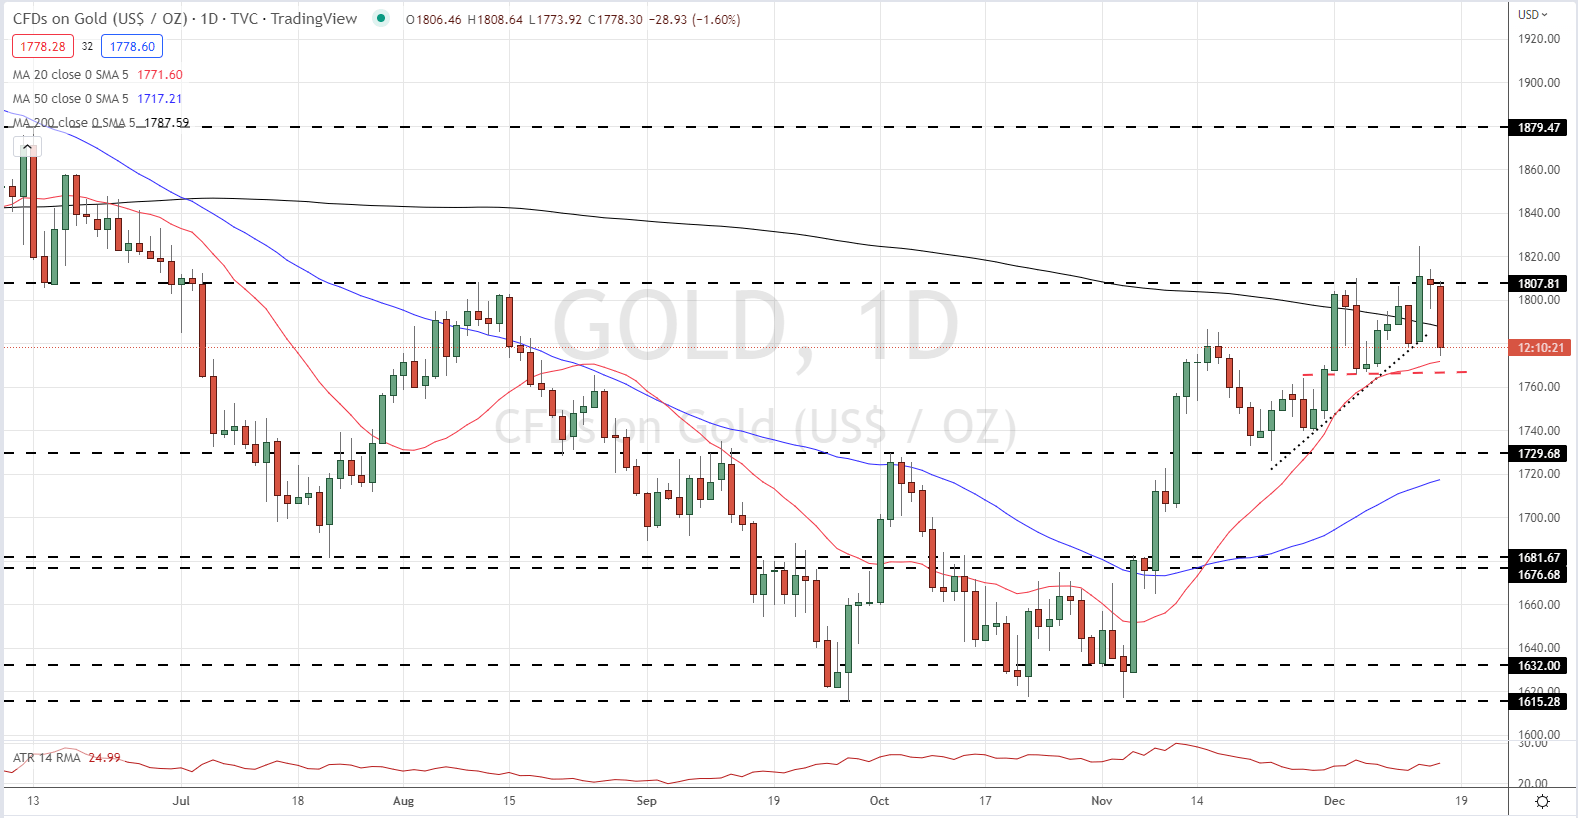
Chart via TradingView
| Change in | Longs | Shorts | OI |
| Daily | 2% | -16% | -3% |
| Weekly | -4% | -8% | -5% |
Retail Trade Positions Little Changed – Trading Bias Mixed
Retail trader data show 74.14% of traders are net-long with the ratio of traders long to short at 2.87 to 1.The number of traders net-long is 2.96% higher than yesterday and 4.77% lower from last week, while the number of traders net-short is 12.09% lower than yesterday and 2.02% lower from last week.
We typically take a contrarian view to crowd sentiment, and the fact traders are net-long suggests Gold prices may continue to fall. Positioning is more net-long than yesterday but less net-long from last week. The combination of current sentiment and recent changes gives us a further mixed Gold trading bias.
What is your view on Gold – bullish or bearish?? You can let us know via the form at the end of this piece or you can contact the author via Twitter @nickcawley1.
Be the first to comment