

Gold price is moving lower and trading below $1,880. Crude oil price is facing a strong resistance near the $79 zone and might correct lower.
Important Takeaways for Gold and Oil
· Gold price started a strong decline below the $1,900 level against the US Dollar.
· It traded below a key rising channel with support near $1,872 on the hourly chart of gold.
· Crude oil price started a fresh increase from the $72.50 support zone.
· There is a connecting trend line forming with resistance near $79.10 on the hourly chart of XTI/USD.
Gold Price Technical Analysis
Gold price struggled to stay above the $1,950 level against the US Dollar. The price started a strong decline and traded below the $1,920 support zone.
The bears even pushed the price below $1,900 and the 50 hourly simple moving average. Recently, there was a break below a key rising channel with support near $1,872 on the hourly chart of gold. The price traded below the $1,865 level.
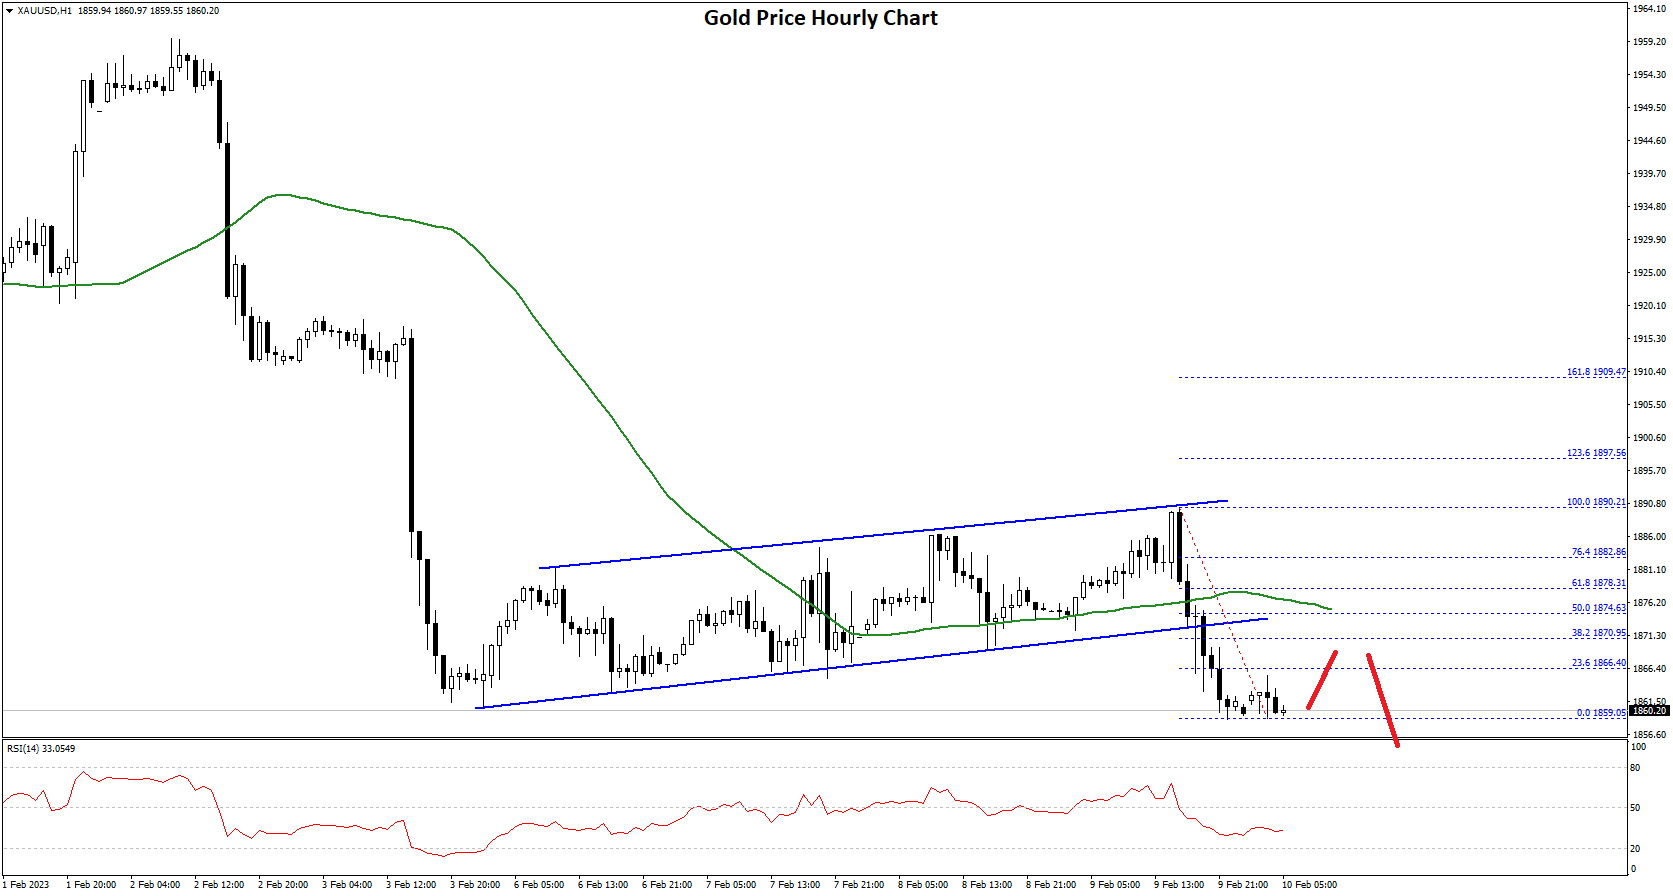
A low is formed near $1,859 on FXOpen and the price is now consolidating losses. On the upside, an immediate resistance is near the $1,870 level.
The stated level is near the 23.6% Fib retracement level of the downward move from the $1,890 swing high to $1,859 low. The next key hurdle is near the $1,875 level or the 50 hourly simple moving average.
The 50% Fib retracement level of the downward move from the $1,890 swing high to $1,859 low is also near the $1,875 level. A clear upside break above the $1,875 resistance could send the price towards $1,890.
An immediate support on the downside is near the $1,858 level. The next major support is near the $1,850 level, below which there is a risk of a larger decline. In the stated case, the price could decline sharply towards the $1,832 support zone.
Oil Price Technical Analysis
Crude oil price also started a fresh increase from the $72.50 support zone against the US Dollar. The price was able to clear the $74.00 and $75.00 resistance levels.
The price even gained pace above the $76.50 level and the 50 hourly simple moving average. Finally, the bears appeared near the $78.90 zone. A high is formed near $78.93 and the price is now correcting gains.
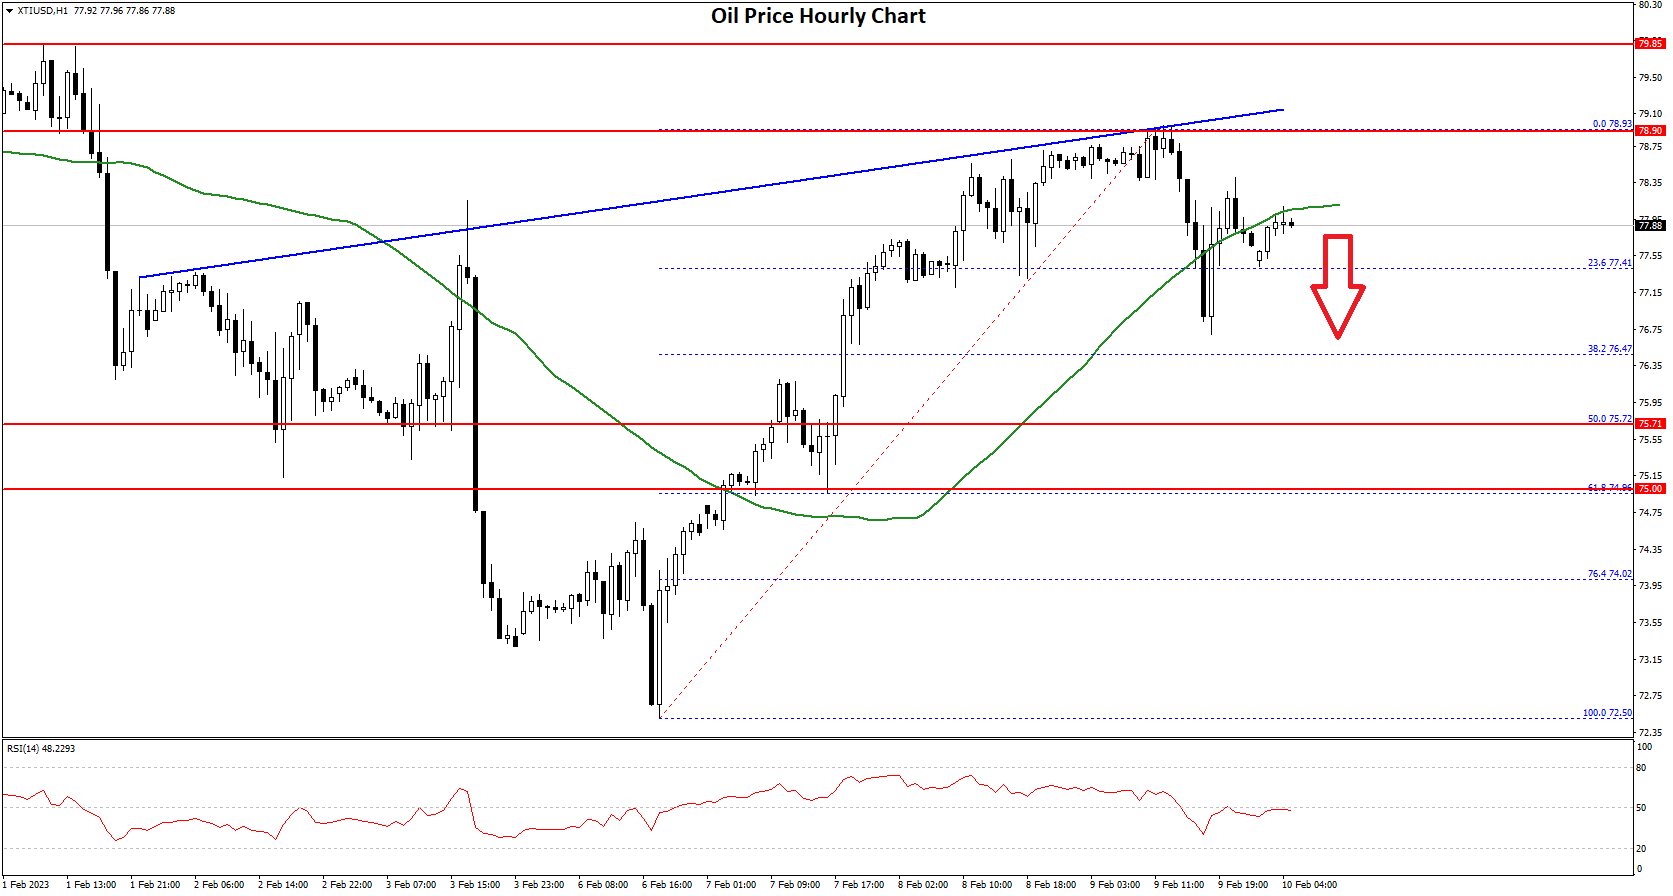
It traded below the 23.6% Fib retracement level of the upward move from the $72.50 swing low to $78.93 high. The price is now trading below $78 and the 50 hourly simple moving average.
On the upside, the price might face resistance near $78. The first major resistance is near the $78.80 level. The main resistance sits near the $79.00 level.
There is also a connecting trend line forming with resistance near $79.10 on the hourly chart of XTI/USD, above which the price might accelerate higher towards $82.00 or even $84.00.
On the downside, an immediate support is near the $76.50 level. The next major support is near the $75.75 level. It is near the 50% Fib retracement level of the upward move from the $72.50 swing low to $78.93 high.
If there is a downside break, the price might decline towards $73.50. Any more losses may perhaps open the doors for a move towards the $72.50 support zone.
This forecast represents FXOpen Companies opinion only, it should not be construed as an offer, invitation or recommendation in respect to FXOpen Companies products and services or as financial advice.
Be the first to comment