

Gold Price Talking Points
The price of gold consolidates after defending the November low ($1759), and fresh data prints coming out of the US may keep bullion afloat as evidence of faster price growth pushes market participants to hedge against inflation.
Gold Price Trades in December Opening Range Ahead of US Inflation Report
The price of gold is little changed from the start of the month as it gives back the advance following the weaker-than-expected US Non-Farm Payrolls (NFP) report, and the update to the Consumer Price Index (CPI) may generate a bullish reaction in the precious metal as the gauge for inflation is expected to widen for the third consecutive month.
The headline CPI reading is projected to increase to 6.8% from 6.2% per annum in October, which would mark the highest reading since December 1981, with the core rate of inflation anticipated to show a similar dynamic as the index is seen climbing to 4.9% from 4.6% during the same period.
Another uptick in US consumer prices may put pressure on the Federal Open Market Committee (FOMC) to normalize monetary policy sooner rather than later as St. Louis Fed President James Bullard, who votes on the committee in 2022, argues that the central bank “may want to consider removing accommodation at a faster pace.”
In turn, the price of gold may continue to defend the November low ($1759) ahead of the FOMC rate on December 15 as evidence of faster price growth pushes market participants to hedge against inflation, but it remains to be seen if the FOMC will adjust the forward guidance ahead of 2022 as Fed officials are slated to update the Summary of Economic Projections (SEP).
With that said, the price of gold may continue to consolidate ahead of the update to the US CPI report as it struggles to clear the opening range for December, but evidence of faster price growth may prop up the precious metal as market participants look to hedge against inflation.
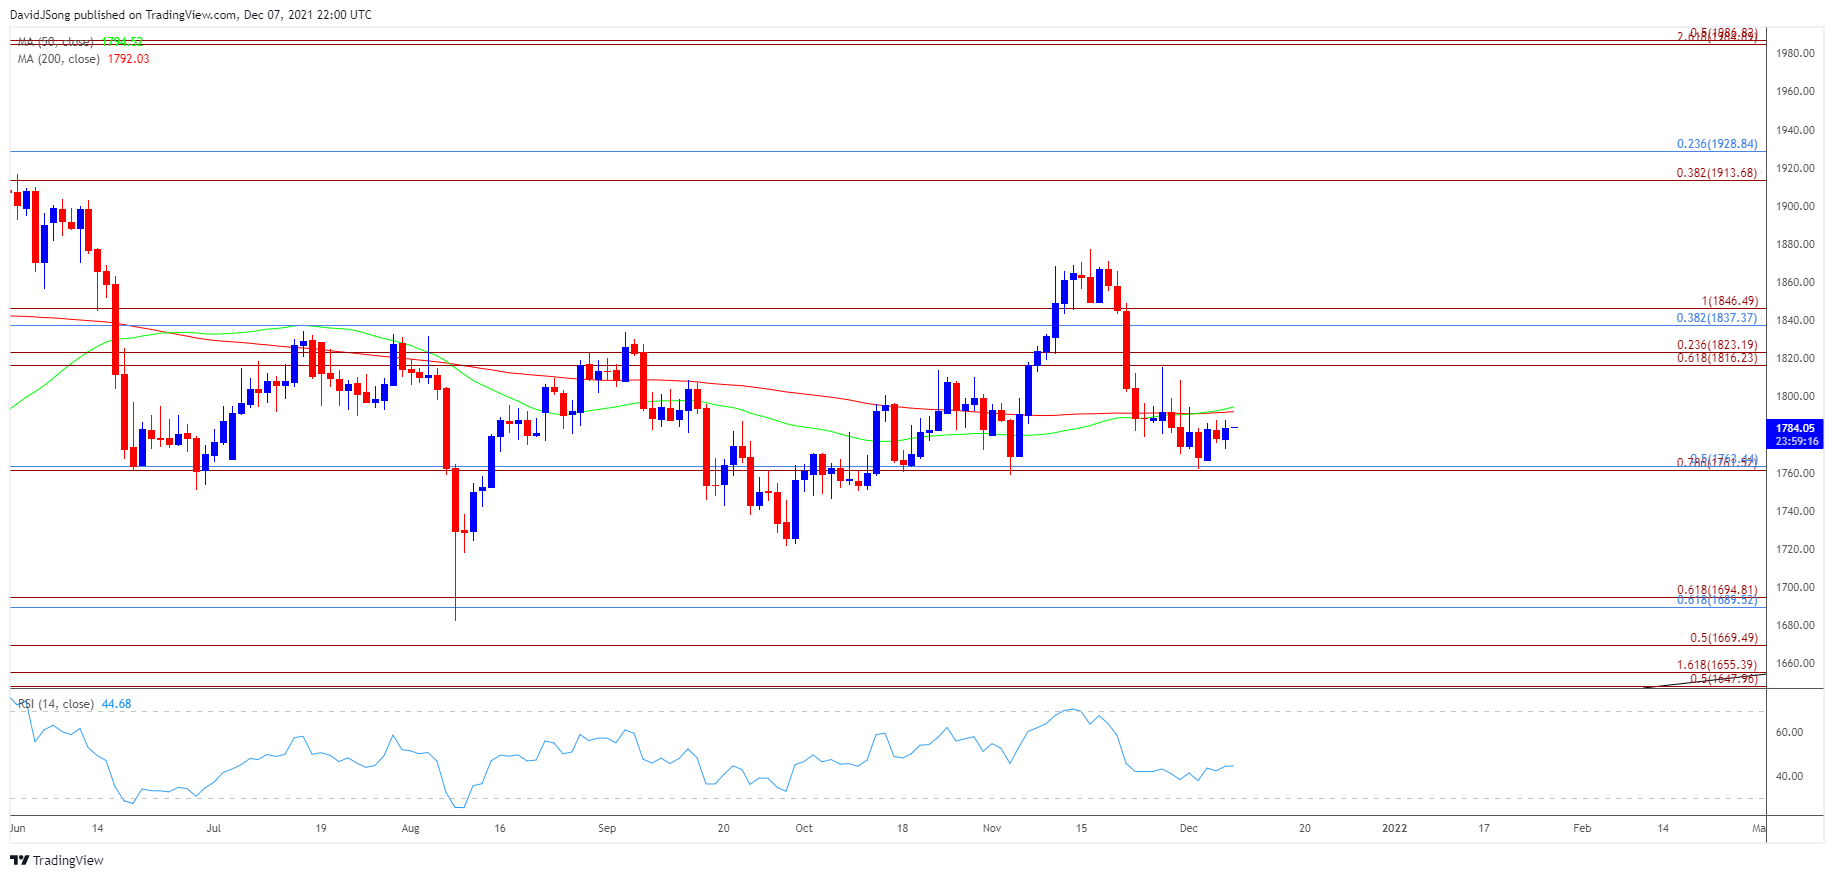
Gold Price Daily Chart
Source: Trading View
- Keep in mind, a ‘death cross’ formation took shape in August as the Relative Strength Index (RSI) pushed into oversold territory, but lack of momentum to test the March low ($1677) generated a textbook buy in the oscillator as it climbed back above 30.
- Since then, the price of gold largely tracked the August range, but the rally from the November low ($1759) pushed led to a break above the September high ($1834), which pushed the RSI into overbought territory for the first time since July 2020.
- The price of gold appears to be defending the November low ($1759) amid the failed attempts to close below the $1762 (78.6% expansion) to $1763 (50% retracement) region, with a break of the December opening range opening up the $1816 (61.8% expansion) to $1823 (23.6% expansion) area.
- Next area of interest comes in around $1837 (38.2% retracement) to $1847 (100% expansion), with a break above the November high ($1877) opening up the Fibonacci overlap around $1914 (38.2% expansion) to $1929 (23.6% retracement).
- However, failure to defend the November low ($1759) along with a close below the $1762 (78.6% expansion) to $1763 (50% retracement) region opens up the September low ($1722), with the net area of interest coming in around $1690 (61.8% retracement) to $1695 (61.8% expansion).
— Written by David Song, Currency Strategist
Follow me on Twitter at @DavidJSong
Be the first to comment