

Gold Price Talking Points
The price of gold appears to have reversed course following the failed attempt to test the July high ($1834), and the precious metal may continue to give back the rebound from the June low ($1751) as it initiates a fresh series of lower highs and lows.
Gold Price Technical Outlook Warns of Looming Death Cross Formation
The price of gold trades back below the 50-Day SMA ($1825) as it gives back the advance following the Federal Reserve interest rate decision, and the precious metal may face a further decline ahead of the US Non-Farm Payrolls (NFP) report as a ‘death cross’ looks poised to take shape over the coming days.
The negative slope in both the 50-Day ($1825) and 200-Day ($1819) SMAs warns of a looming crossover in the moving averages as bullion extends the decline from the start of the week, and it remains to be seen if fresh US data prints will influence the price of gold as the economy is now expected to add 880K jobs in July.
An upbeat NFP report may dampen the appeal of gold as it puts pressure on the Federal Open Market Committee (FOMC) to draw up an exit strategy, while a lackluster development may encourage the central bank to retain the current course for monetary policy as Governor Lael Brainard insists that “employment has some distance to go.”
As a result, the price of gold may move to the beat of its own drum ahead of the NFP report as the FOMC remains reluctant to switch gears, but the technical outlook casts a bearish forecast for bullion as a ‘death cross’ looks poised to take shape over the coming days.
With that said, the price of gold may continue to give back the rebound from the June low ($1751) as the double-bottom formation from earlier this year seems to have run its course, and lack of momentum to hold above the 50-Day SMA ($1825) may fuel the recent series of lower highs and lows as the moving average reflects a negative slope.
Gold Price Daily Chart
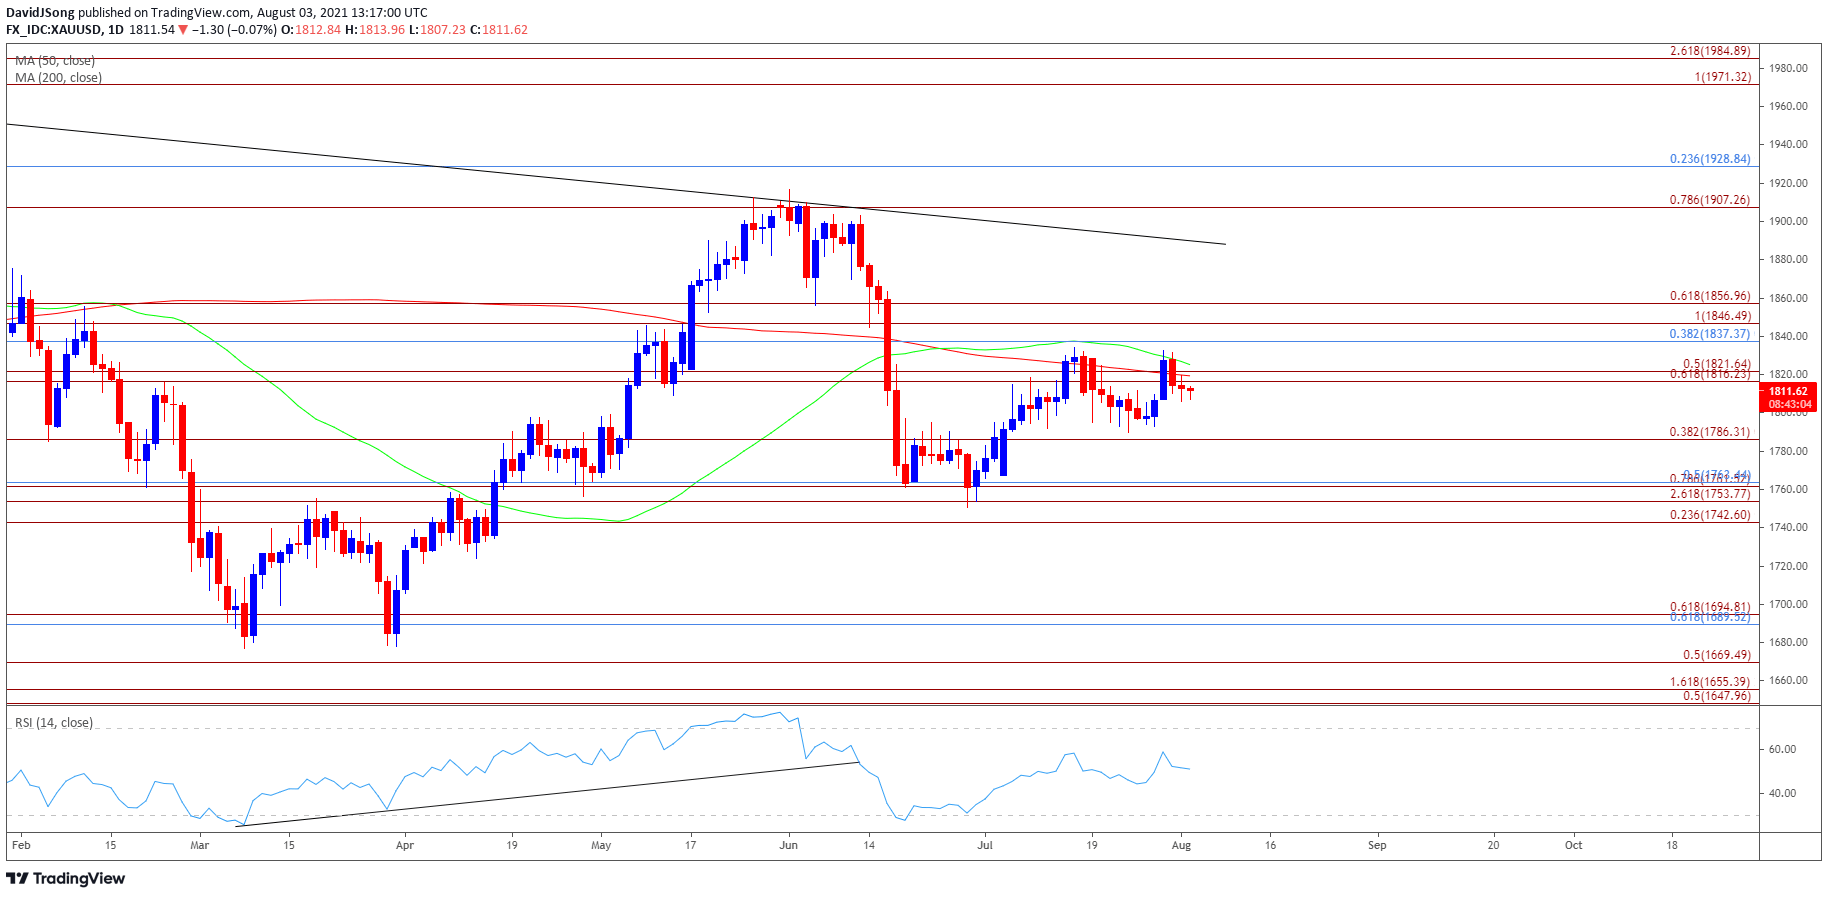
Source: Trading View
- Keep in mind, a double-bottom emerged in March as the price of gold failed to test the June 2020 low ($1671), with the key reversal pattern pushing the precious metal back above the 200-Day SMA ($1819) for the first time since February.
- At the same time, the Relative Strength Index (RSI) pushed into overbought territory for the first time since July 2020 as the price of gold appeared to be on track to test the January high ($1959), but the double-bottom formation seems to have run its course as the RSI no longer tracks the upward trend from earlier this year.
- In turn, the price of gold appears to have reversed course following the failed attempt to test the July high ($1834) as it trades back below the 50-Day SMA ($1825), and lack of momentum to hold above the $1816 (61.8% expansion) to $1822 (50% expansion) region may push the price of gold towards the $1786 (38.2% expansion) region, with the next area of interest coming in around $1743 (23.6% expansion) to $1763 (50% retracement), which lines up with the June low ($1751).
— Written by David Song, Currency Strategist
Follow me on Twitter at @DavidJSong
Be the first to comment