

GOLD, XAU/USD, US Dollar, Treasury Yields, Crude Oil, CAD, AUD – Talking Points
- Gold rose despite higher Treasury yields and a firming US Dollar
- APAC equities sunk as did crude oil with the Saudi’s seeking to add production
- Real yields are rising again. Will they boost USD to undermine XAU/USD?
Gold put in a gutsy move up in the North American session as stocks and bonds dropped in the aftermath of a resumption of the hawkish language from Fed speakers.
Federal open market committee (FOMC) members Mary Daly, James Bullard and Thomas Barkin all sung from the 50 basis-point hike in June song sheet. Bullard also urged his colleagues to consider a move to 3.5% this year for the Fed funds rate.
This lifted Treasury yields across the curve but especially in the belly, that is the 2-7 year part of the strip where 8-10 basis-points were added. The US Dollar also surged on these comments.
Of note was the lift in real yields, which can be detrimental to the gold price. The US 10-year real is around 16 basis points higher than last week.
GOLD AGAINST US 10-YEAR REAL YIELD, TREASURY AND INFLATION
The anticipated Bank of Canada’s 50 basis-point hike to 1.5% did little to move the Loonie, while the Aussie slipped today. This was despite Australian trade data revealing a AUD 10.5 billion surplus for April instead AUD 9.0 billion expected.
Bitcoin dipped back below the 30k mark after having a peek above 32k earlier in the week.
APAC equities followed Wall Street’s lead lower to varying degrees.
Crude oil is also lower after Saudi Arabia told their western allies that they would be prepared to add production to make up for Russia’s absence in global trade. This comes on the back of yesterday’s EU bans on seaborne Russian oil.
China’s Premier Li Keqiang reportedly ordered state owned banks to provide a USD 120 billion line of credit for infrastructure spending in an effort to lift employment and to get GDP back on track.
Later today there will be a series of US jobs data as well durable goods orders.
The full economic calendar can be viewed here.
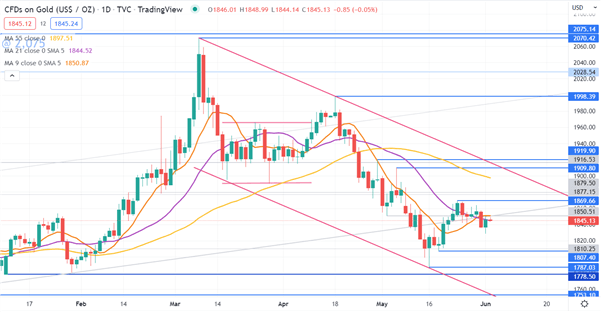
GOLD Technical Analysis
Gold remains ensconced in a descending trend channel and appears to have stalled.
The price is clustering around the 10- and 21-day simple moving average (SMA). This could indicate a hesitation in momentum for either direction.
Resistance might be offered the at recent peaks of 1,870, 1,910 and 1920. On the downside, support may lie at the prior lows of 1,807, 1,787 and 1,779.
— Written by Daniel McCarthy, Strategist for DailyFX.com
To contact Daniel, use the comments section below or @DanMcCathyFX on Twitter
Be the first to comment