

Gold Price Talking Points
The price of gold trades to a fresh weekly high ($1910) as the Federal Reserve lays out a preset course for monetary policy, and the precious metal may stage a larger advance over the coming days as it reverses course ahead of the 200-Day SMA ($1835).
Gold Price Recovery Materializes Ahead of US NFP Report
The price of gold extends the series of higher highs and lows from earlier this week as the Federal Open Market Committee (FOMC) plans to normalize monetary policy in a “predictable manner,” and it seems as though the central bank is in no rush to push its balance sheet towards pre-pandemic levels as the “Committee intends to slow and then stop the decline in the size of the balance sheet when reserve balances are somewhat above the level it judges to be consistent with ample reserves.”
As a result, the advance following the FOMC rate decision raises the scope for a larger recovery in the price of gold as Chairman Jerome Powell warns of the “imbalance between supply and demand in the labor market,” and the US Non-Farm Payrolls (NFP) report may keep the Fed on its current path as the update is anticipated to show a slowdown in job growth.
The NFP report is expected to show the economy adding 391K jobs in April following the 431K expansion the month prior, while the Unemployment Rate is seen narrowing to 3.5% from 3.6% during the same period. The update may do little to derail the recent advance in the price of gold as the Fed acknowledges that “labor supply remains subdued,” but evidence of a tightening labor market may keep Chairman Powell and Co. on track to deliver another 50bp rate hike at the next interest rate decision on June 15 as the FOMC steps up its efforts to tame inflation.
Until then, the price of gold may stage a larger recovery as it appears to be reversing course ahead of the 200-Day SMA ($1835), but the precious metal may face headwinds throughout 2022 as the shift in Fed policy is likely to prop up US yields over the coming months.
With that said, the price of gold may establish a bearish trend as the FOMC normalizes monetary policy at a faster pace, and the advance from the monthly low ($1938) may turn out to be a correction as bullion trades below the 50-Day SMA ($1937) for the first time since February.
Gold Price Daily Chart
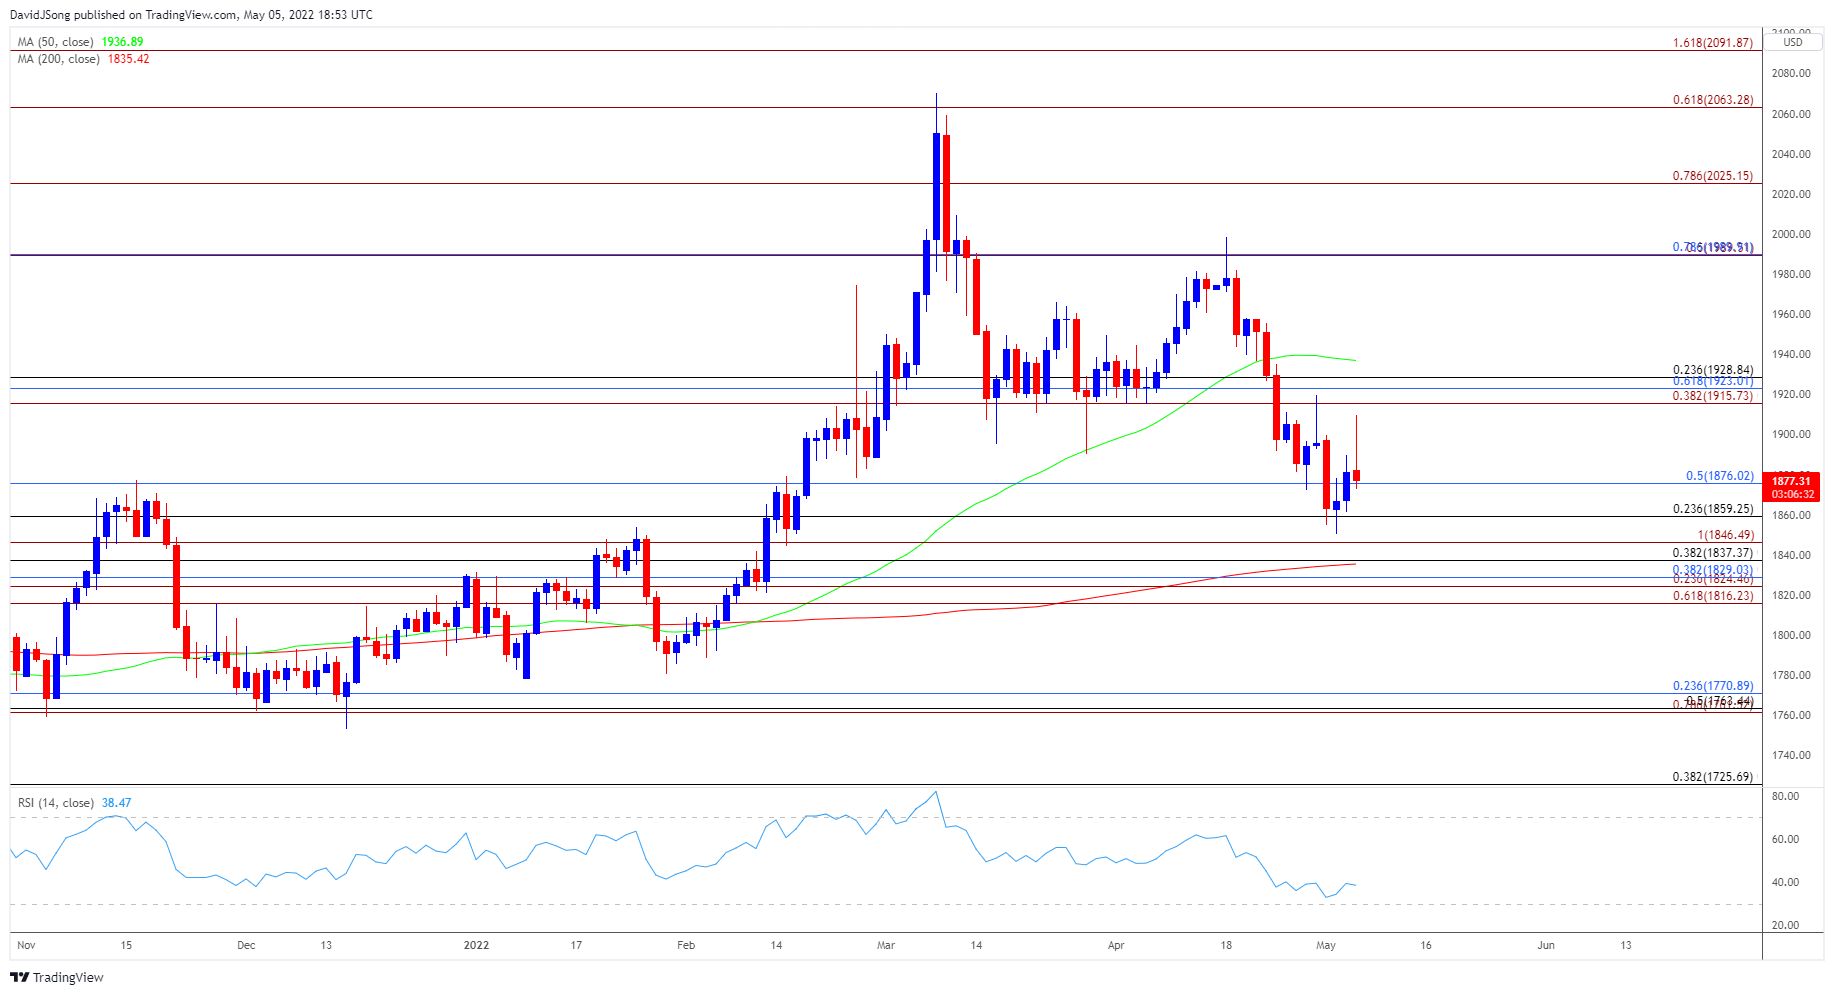
Source: Trading View
- Keep in mind, the price of gold cleared the March low ($1890) as it pushed below the 50-Day SMA ($1937) for the first time since February, but the precious metal appears to be reversing course ahead of the 200-Day SMA ($1835) as it carves a series of higher highs and lows.
- The failed attempts to close below the $1859 (23.6% retracement) area has pushed the price of gold back above the $1876 (50% retracement) region, but need a break/close above the Fibonacci overlap around $1916 (38.2% expansion) to $1929 (23.6% retracement) to bring the 50-Day SMA ($1937) back on the radar.
- However, lack of momentum to push above the Fibonacci overlap around $1916 (38.2% expansion) to $1929 (23.6% retracement) may curb the recent rebound in the price of gold, with a close below the $1859 (23.6% retracement) area opening up the $1837 (38.2% retracement) to $1847 (100% expansion) region.
— Written by David Song, Currency Strategist
Follow me on Twitter at @DavidJSong
Be the first to comment