

Gold Price Talking Points
The price of gold attempts to retrace the decline from earlier this month as the Federal Reserve takes additional steps to combat COVID-19, and the precious metal may continue to consolidate as the global community of central banks stand ready to deploy unconventional tools in order to curb the weakening outlook for growth.
Gold Price Rebounds from Key Price Zone as Fed Deploys Credit Facility
The price of gold may extend the rebound from the monthly low ($1451) as the Federal Reserve establishes a Primary Dealer Credit Facility (PDCF), with the operations to “offer overnight and term funding with maturities up to 90 days.”
The announcement comes as the 3-month US Dollar LIBOR rate jumped 16.25bp to mark the biggest rise since 2008, and the Federal Open Market Committee (FOMC) may continue to respond to the coronavirus as the PDCF will be “in place for at least six months and may be extended as conditions warrant.”
The efforts by the FOMC and its counterparts should help to cushion the world economy from the shock to the global supply chain, and it seems as though major central banks will deploy unconventional tools to fight the outbreak as the Reserve Bank of Australia (RBA) “stands ready to purchase Australian government bonds in the secondary market to support the smooth functioning of that market.”
It remains to be seen if the rate easing cycle will produce unintended consequences as the RBA warns that “a further reduction in interest rates could encourage additional borrowing at a time when there was already a strong upswing in the housing market,” but the price of gold may continue to benefit from the low interest environment as market participants look for an alternative to fiat-currencies.
With that said, the broader outlook for bullion remains constructive as the reaction to the former-resistance zone around $1450 (38.2% retracement) to $1452 (100% expansion) helped to rule out the threat of a Head-and-Shoulders formation, and the recent reaction to the key price zone may generate a lager rebound in the price of gold as the Relative Strength Index (RSI) appears to be reversing course ahead of oversold territory.
Recommended by David Song
Download the 1Q 2020 Forecast for Gold
Sign up and join DailyFX Currency Strategist David Song LIVE for an opportunity to discuss potential trade setups.
Gold Price Daily Chart
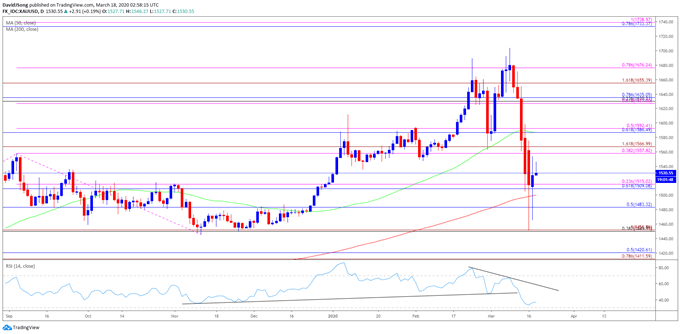
Source: Trading View
- The opening range for 2020 instilled a constructive outlook for the price of gold as the precious metal cleared the 2019 high ($1557), with the Relative Strength Index (RSI) pushing into overbought territory during the same period.
- A similar scenario materialized in February, with the price of gold marking the monthly low ($1548) during the first full week, while the RSI broke out of the bearish formation from earlier this year to push back into overbought territory.
- However, the price of gold has failed to maintain the monthly opening range for March after trading to a fresh yearly high ($1704), with the Relative Strength Index (RSI) signaling a potential change in gold price behavior as the oscillator deviates with price and snaps the upward trend carried over from last year.
- However, the reaction to the former-resistance zone around $1450 (38.2% retracement) to $1452 (100% expansion) may produce range bound conditions as the RSI reverses course ahead of oversold territory, with a break/close above the $1558 (38.2% expansion) to $1567 (161.8% expansion) regionopening up the Fibonacci overlap around $1587 (61.8% retracement) to $1592 (50% expansion).

Recommended by David Song
Traits of Successful Traders
— Written by David Song, Currency Strategist
Follow me on Twitter at @DavidJSong
Be the first to comment