

Gold Price Talking Points
The price of gold gives back the advance from last week as the update to the US Consumer Price Index (CPI) fuels speculation for another 75bp Federal Reserve rate hike, and the precious metal may continue to track the negative slope in the 50-Day SMA ($1740) as it reverses ahead of the moving average.
Gold Price Rebound Fizzles Ahead of 50-Day SMA
The price of gold trades to a fresh weekly low ($1694) as US Treasury yields push to fresh monthly highs, and the precious metal may face a further decline ahead of the Federal Open Market Committee (FOMC) interest rate decision on September 21 if it fails to defend the monthly low ($1689).
Looking ahead, the stickiness in the US CPI may encourage the FOMC to retain its current approach in combating inflation as Vice-Chair Lael Brainard insists that “it will be necessary to see several months of low monthly inflation readings to be confident that inflation is moving back down to 2 percent,” and it remains to be seen if the committee will adjust the forward guidance for monetary policy as the central bank prepares US households and businesses for a restrictive policy.
Until then, the advance from the yearly low ($1681) may continue to unravel as the CME FedWatch Tool reflects a 100% probability for a 75bp rate hike, and the update to the Summary of Economic Projections (SEP) may influence the outlook for gold prices should Chairman Jerome Powell and Co. project a steeper path for US interest rates.
With that said, the price of gold may largely reflect an inverse relationship with Treasury yields as the Fed continues to carry out its hiking-cycle, and bullion may continue to track the negative slope in the 50-Day SMA ($1740) as it reverses ahead of the moving average.
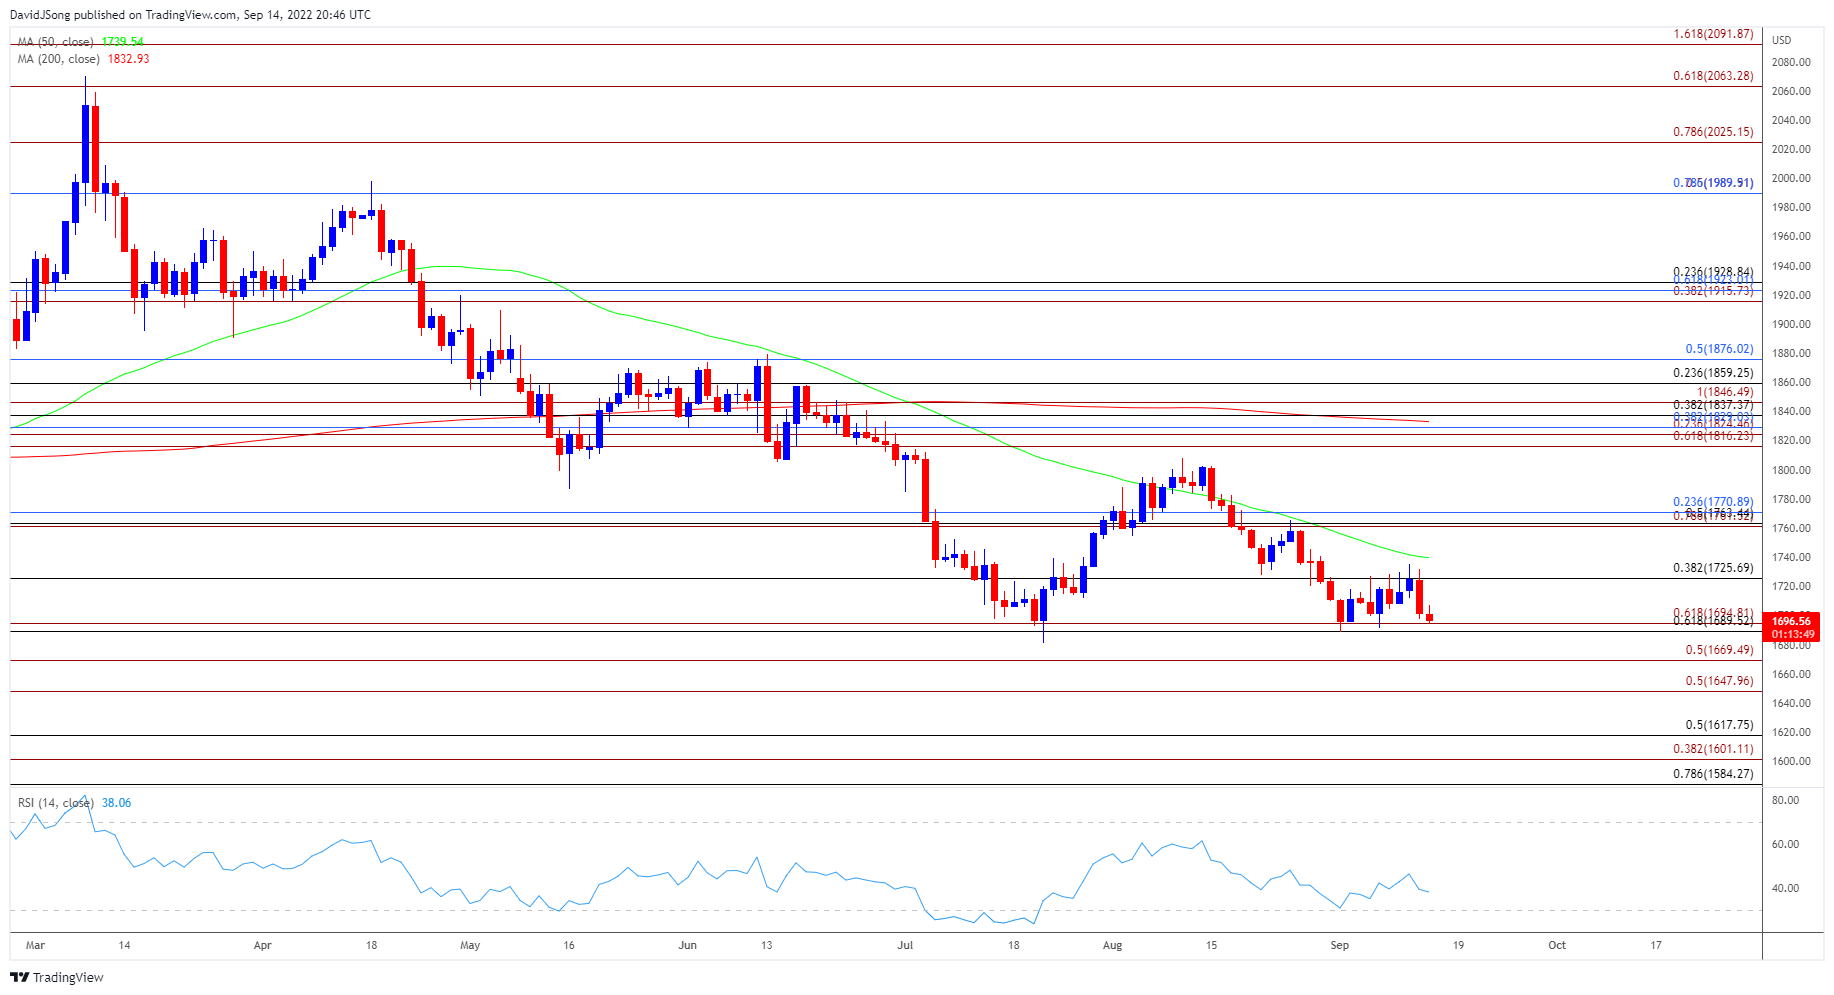
Gold Price Daily Chart
Source: Trading View
- The recent rebound in the price of gold has kept the Relative Strength Index (RSI) out of oversold territory, but the advance from the monthly low ($1689) appears to have stalled ahead of the 50-Day SMA ($1740) amid the failed attempt to close above the $1726 (38.2% retracement) region.
- A break/close below the $1690 (61.8% retracement) to $1695 (61.8% expansion) region brings the yearly low ($1681) on the radar, with a move below the March 2021 low ($1677) opening up the $1670 (50% expansion) area, which largely lines up with the June 2020 low ($1671).
- However, the price of gold may face range bound conditions if it continues to defend the monthly low ($1689), with a move above $1726 (38.2% retracement) raising the scope for another run at the moving average.
Recommended by David Song
Traits of Successful Traders
— Written by David Song, Currency Strategist
Follow me on Twitter at @DavidJSong
Be the first to comment