

Gold Price, Chart, and Analysis
- A series of recent higher lows is building confidence in the precious metal.
- Fibonacci retracement at $1,837/oz. remains a stern test.
Gold is currently ignoring higher US Treasury yields – a negative for the precious metal – and instead seems to be moving in line with calls for slowing global economic growth and increased market expectations for inflation to remain at its current highs for longer than previously expected. China’s GDP slowed to 4.9% in Q3, compared to market forecasts of 5.2% and a prior quarter’s 7.9%, while growth in the US is now seen below 6% in 2021, with the economy held back by supply chain problems and a slowdown in consumer spending. On Thursday the first look at US Q3 GDP is expected to show the QoQ rate slow to 2.8% compared to a prior 6.7%.
Keep up to date with all market-moving data releases and events by using the DailyFX Calendar
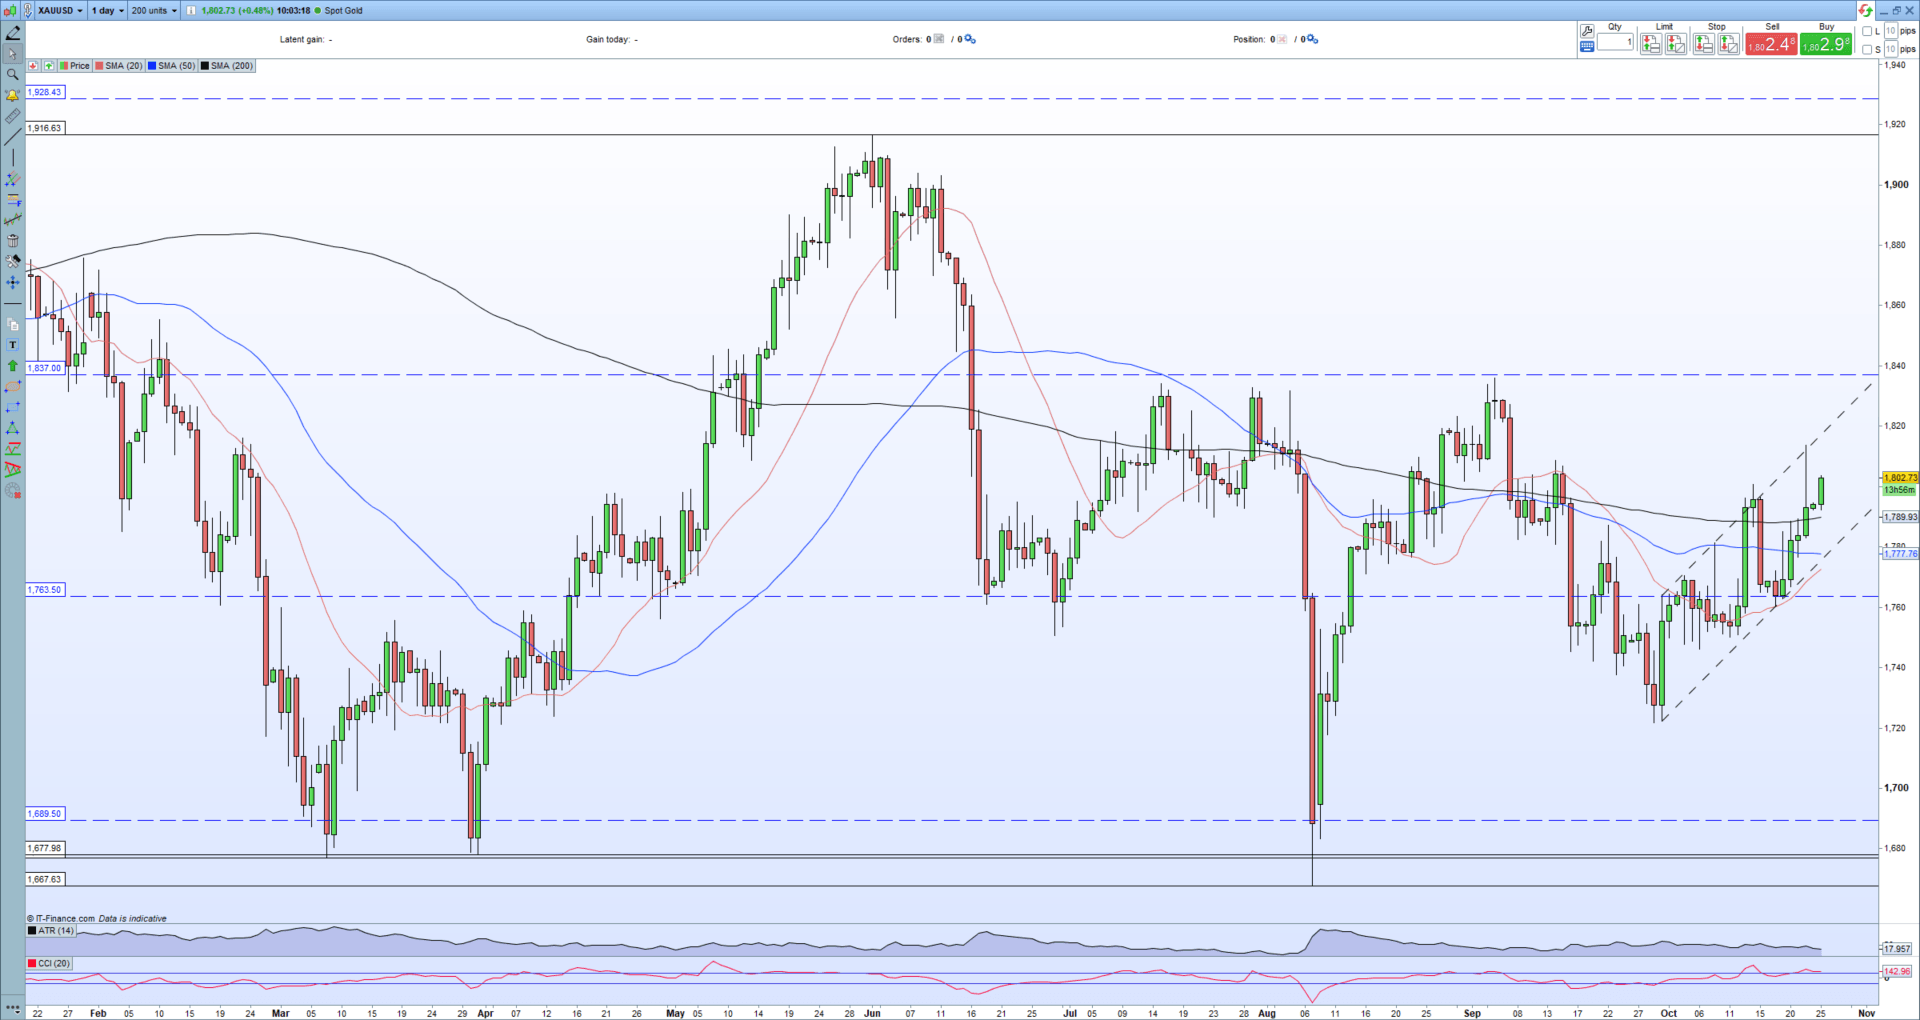
Last week’s rally in the precious metal has given the daily chart a near-term positive outlook with an unbroken set of higher lows off last Monday’s $1,760/oz. low print. If we go back to the start of October, gold has been moving higher within a bullish channel and a break above $1,814/oz. would confirm that this move higher has potentially further to go.
If gold makes a sustained break above last Friday’s high, then the 38.2% Fibonacci retracement level at $1,837/oz. once again comes into play. There have been a handful of attempts to break above the $1,830/$1,837/oz. zone over the last few months with none being successful. If gold continues moving higher within the recent uptrend, this Fibonacci level is likely to come under pressure in the next couple of weeks. Near-term support is seen off the 50-dsma and channel support around $1,778/oz.
Gold (XAU/USD) Daily Price October 25, 2021
Retail trader data 76.79% of traders are net-long with the ratio of traders long to short at 3.31 to 1.The number of traders net-long is 4.26% higher than yesterday and 10.88% lower from last week, while the number of traders net-short is 3.00% higher than yesterday and 9.40% higher from last week.
We typically take a contrarian view to crowd sentiment, and the fact traders are net-long suggests Gold prices may continue to fall. Positioning is more net-long than yesterday but less net-long from last week. The combination of current sentiment and recent changes gives us a further mixed Gold trading bias.
What is your view on Gold – bullish or bearish?? You can let us know via the form at the end of this piece or you can contact the author via Twitter @nickcawley1.
Be the first to comment