

Gold Price (XAU/USD), Chart, and Analysis
- Gold is listless ahead of the latest US inflation report.
- Support remains under threat.
- Retail traders remain heavily long of the precious metal.
Financial markets are treading water Friday morning ahead of the latest look at US inflation at 13:30 GMT. The current market expectation of a headline reading of 6.8% in November – from a 30-year high of 6.2% in October – is now being questioned with some market analysts suggesting a 7% print or higher. Yesterday the Biden administration indicated that while they see price increases slowing down, this would not be reflected in today’s release which was expected to be high. This commentary gave the US dollar a small bid.
A glance at the US Treasury market shows that the rate-sensitive 2-year UST is now trading with a yield of 0.725%, the highest level since March 2020. Traders have recently moved forward the timing for interest rate hikes in the US to the end of Q1, while the market is also now pricing in three 0.25% rate hikes.
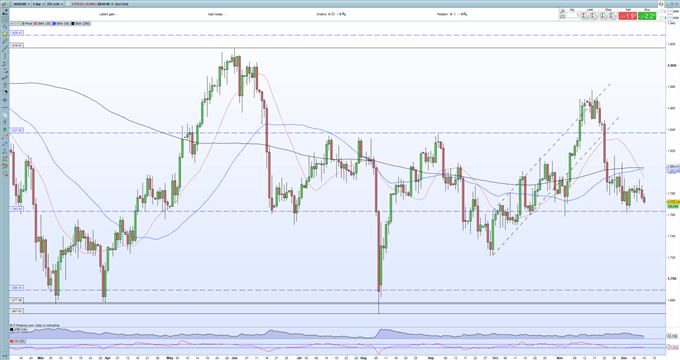
Gold has been quiet of late, despite the flashes of volatility seen in other markets. Price action has been stuck in a limited $30 range of late, while this week sellers have had the upper hand and have nudged gold lower. The precious metal is now just $9 above an important support level – 50% Fibonacci Retracement of the March-August 2020 rally – at $1,763/oz. A confirmed break of this support leaves the recent double low made at the end of September at $1,722/oz. as the next downside target. A weaker-than-expected US CPI release could see gold back to $1,795/oz, breaking the recent pattern of lower highs.
Gold (XAU/USD) Daily Price December 10, 2021
Retail trader data show82.71% of traders are net-long with the ratio of traders long to short at 4.78 to 1. The number of traders net-long is 2.49% higher than yesterday and 1.73% higher from last week, while the number of traders net-short is 5.24% lower than yesterday and 3.17% lower from last week.
We typically take a contrarian view to crowd sentiment, and the fact traders are net-long suggests Gold prices may continue to fall.Traders are further net-long than yesterday and last week, and the combination of current sentiment and recent changes gives us a stronger Gold-bearish contrarian trading bias.
What is your view on Gold – bullish or bearish?? You can let us know via the form at the end of this piece or you can contact the author via Twitter @nickcawley1.
Be the first to comment