

Gold Price (XAU/USD), Chart, and Analysis
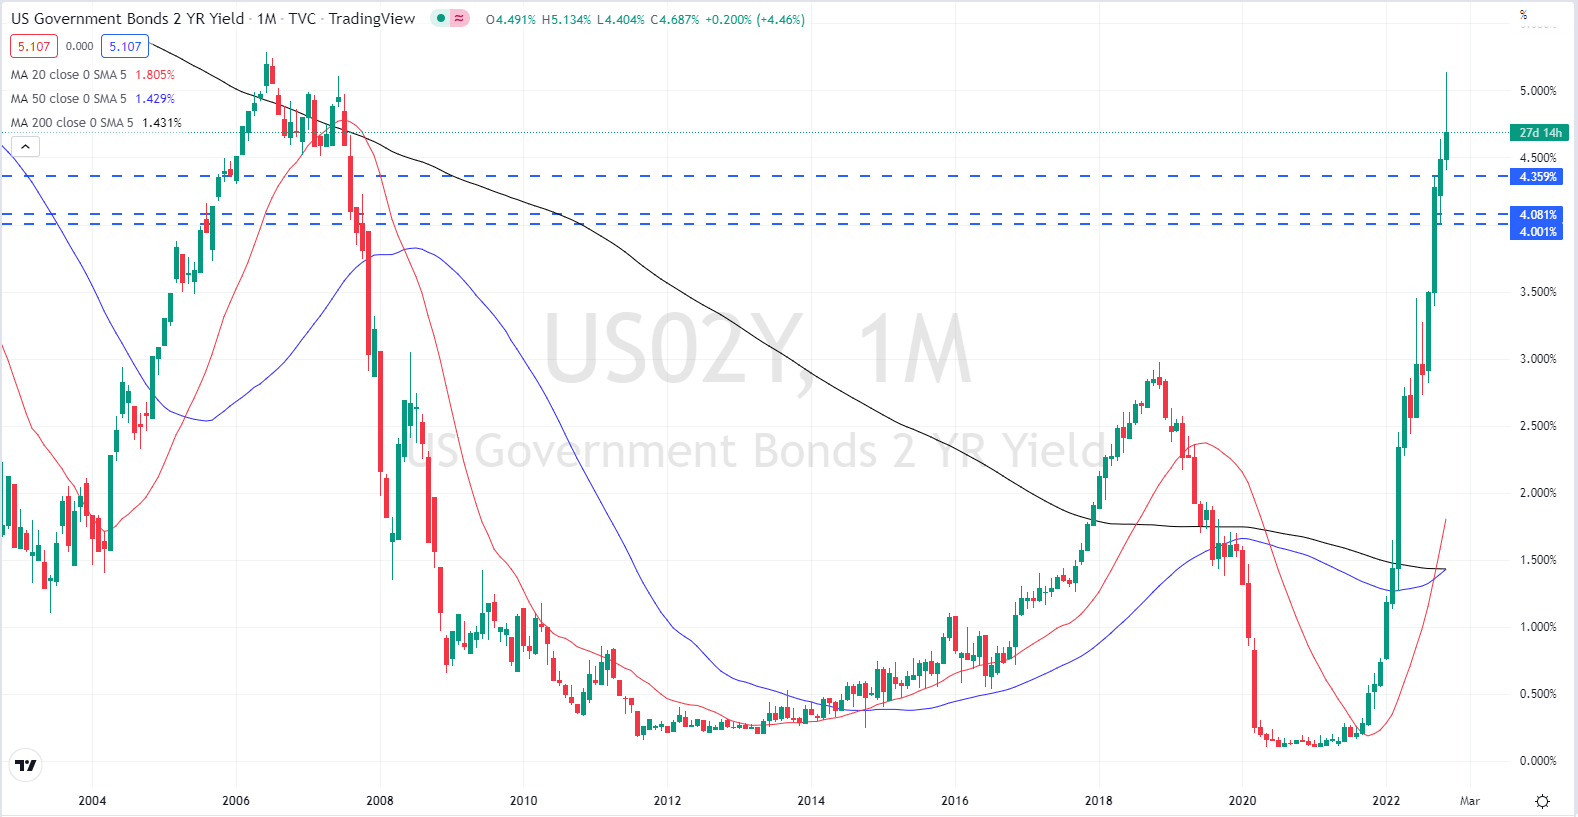
- The yield on the UST 2-year spiked to over 5.13% before falling back.
- Gold will continue to test prior support.
Recommended by Nick Cawley
Download our Brand New Q4 Guide
The Federal Reserve: A Forex Trader’s Guide
The latest FOMC meeting added a dose of volatility into a range of risk markets yesterday after Fed chair Powell gave both hawks and doves something to chew on. The Federal Reserve (Fed) hiked rates by 75 basis points as expected and in the accompanying statement, chair Powell said.
‘In determining the pace of future increases in the target range, the Committee will take into account the cumulative tightening of monetary policy, the lags with which monetary policy affects economic activity and inflation, and economic and financial developments.’
This mildly dovish statement sent risk markets higher and US bond yields lower and on the front foot ahead of the press conference. The mood changed here when chair Powell said that the central bank had ‘some way to go’ in tightening policy and that interest rates may be higher than previously expected. This about-turn sent bond yields sharply higher with the UST 2-year printing a spike high of 5.14%, before settling back down. The 2-year UST opened the European session around 4.50% on Wednesday and currently changes hands around 4.68%.
Fed Hikes Rates by 75bp and Alters Guidance: US Dollar Outlook Post-FOMC
US Treasury Monthly 2-Year Yield – November 3, 2022
Chart via TradingView
For all market-moving data releases and events, see the DailyFX Economic Calendar.
Trade Smarter – Sign up for the DailyFX Newsletter
Receive timely and compelling market commentary from the DailyFX team
Subscribe to Newsletter
The jump higher in US bond yields hit gold hard and has sent the precious metal tumbling back toward levels last seen in April 2020. Gold has been stuck in a notable downtrend since early March, printing a regular series of lower highs and lower lows. The precious metal is now below all three simple moving averages, a negative set-up, and is looking to break resistance set between $1,614/oz. and $1,617/oz. Resistance at $1,660/oz. is unlikely to be troubled in the near term. If gold makes a confirmed break of support, a prior swing low at $1,568/oz. comes into play.
Comprehensive Guide to Moving Averages
Gold Daily Price Chart – November 3, 2022
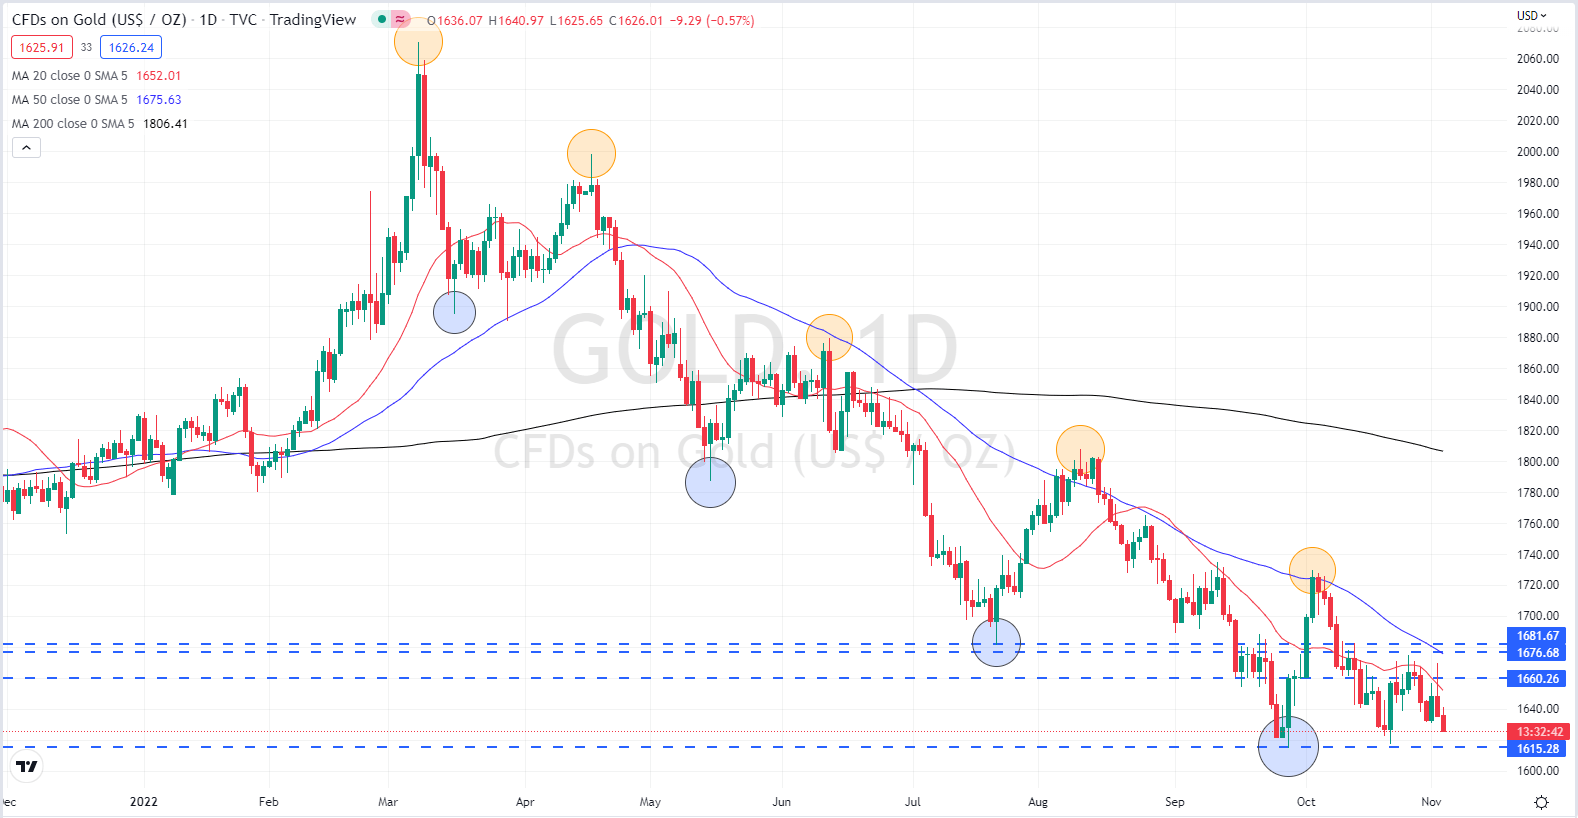
Chart via TradingView
Retail trader data show that 84.50% of traders are net-long with the ratio of traders long to short at 5.45 to 1.The number of traders net-long is 0.82% higher than yesterday and 0.29% lower from last week, while the number of traders net-short is 8.46% lower than yesterday and 8.06% lower from last week.
We typically take a contrarian view to crowd sentiment, and the fact traders are net-long suggests Gold prices may continue to fall. Traders are further net-long than yesterday and last week, and the combination of current sentiment and recent changes gives us a stronger Gold-bearish contrarian trading bias.
| Change in | Longs | Shorts | OI |
| Daily | 2% | -9% | 0% |
| Weekly | 1% | -8% | -1% |
What is your view on Gold – bullish or bearish?? You can let us know via the form at the end of this piece or you can contact the author via Twitter @nickcawley1.
Be the first to comment