

Gold Price Talking Points
The price of gold trades near the monthly high ($1818) after showing a kneejerk reaction to the larger-than-expected rise in the US Consumer Price Index (CPI), but the failed attempts to push back above the 200-Day SMA ($1826) may keep the precious metal within the monthly range as a growing number of Federal Reserve officials show a greater willingness to switch gears.
Gold Price Fails to Test 200-Day SMA amid Talks of Fed Exit Strategy
The price of gold appears to be moving to the beat of its own drum as the Federal Open Market Committee (FOMC) prepares to discuss an exit strategy, and the updated US CPI figures may put pressure on the central bank to normalize monetary policy sooner rather than later as the headline reading unexpectedly widens to 5.4% in June from 5.0% per annum the month prior.
At the same time, the core rate of inflation climbed to 4.5% from 3.8% during the same period to mark the highest reading since November 1991, but the FOMC may retain a wait-and-see approach at its next interest rate decision on July 28 as Chairman Jerome Powell and Co. brace for a transitory rise in inflation.
However, St. Louis Fed President James Bullard, who votes on the FOMC in 2022, insists that “with the economy growing at 7% and the pandemic coming under better and better control, I think the time is right to pull back emergency measures,” with the official going onto say that he’s “comfortable with the idea that the economy will continue to grow very robustly through the second half of this year” during a recent interview with the Wall Street Journal.
The comments suggest the FOMC will adjust the forward guidance in the second half of the year as “various participants mentioned that they expected the conditions for beginning to reduce the pace of asset purchases to be met somewhat earlier than they had anticipated at previous meetings,” but the central bank may wait for the quarterly meeting in August to lay out a tentative exit strategy as Fed officials are slated to update the Summary of Economic Projections (SEP).
With that said, the price of gold may move to the beat of its own drum as the double-bottom formation from earlier this year seems to have run its course, and the precious metal may track the monthly range over the remainder of the week amid the failed attempts to push back above the 200-Day SMA ($1826).
Gold Price Daily Chart
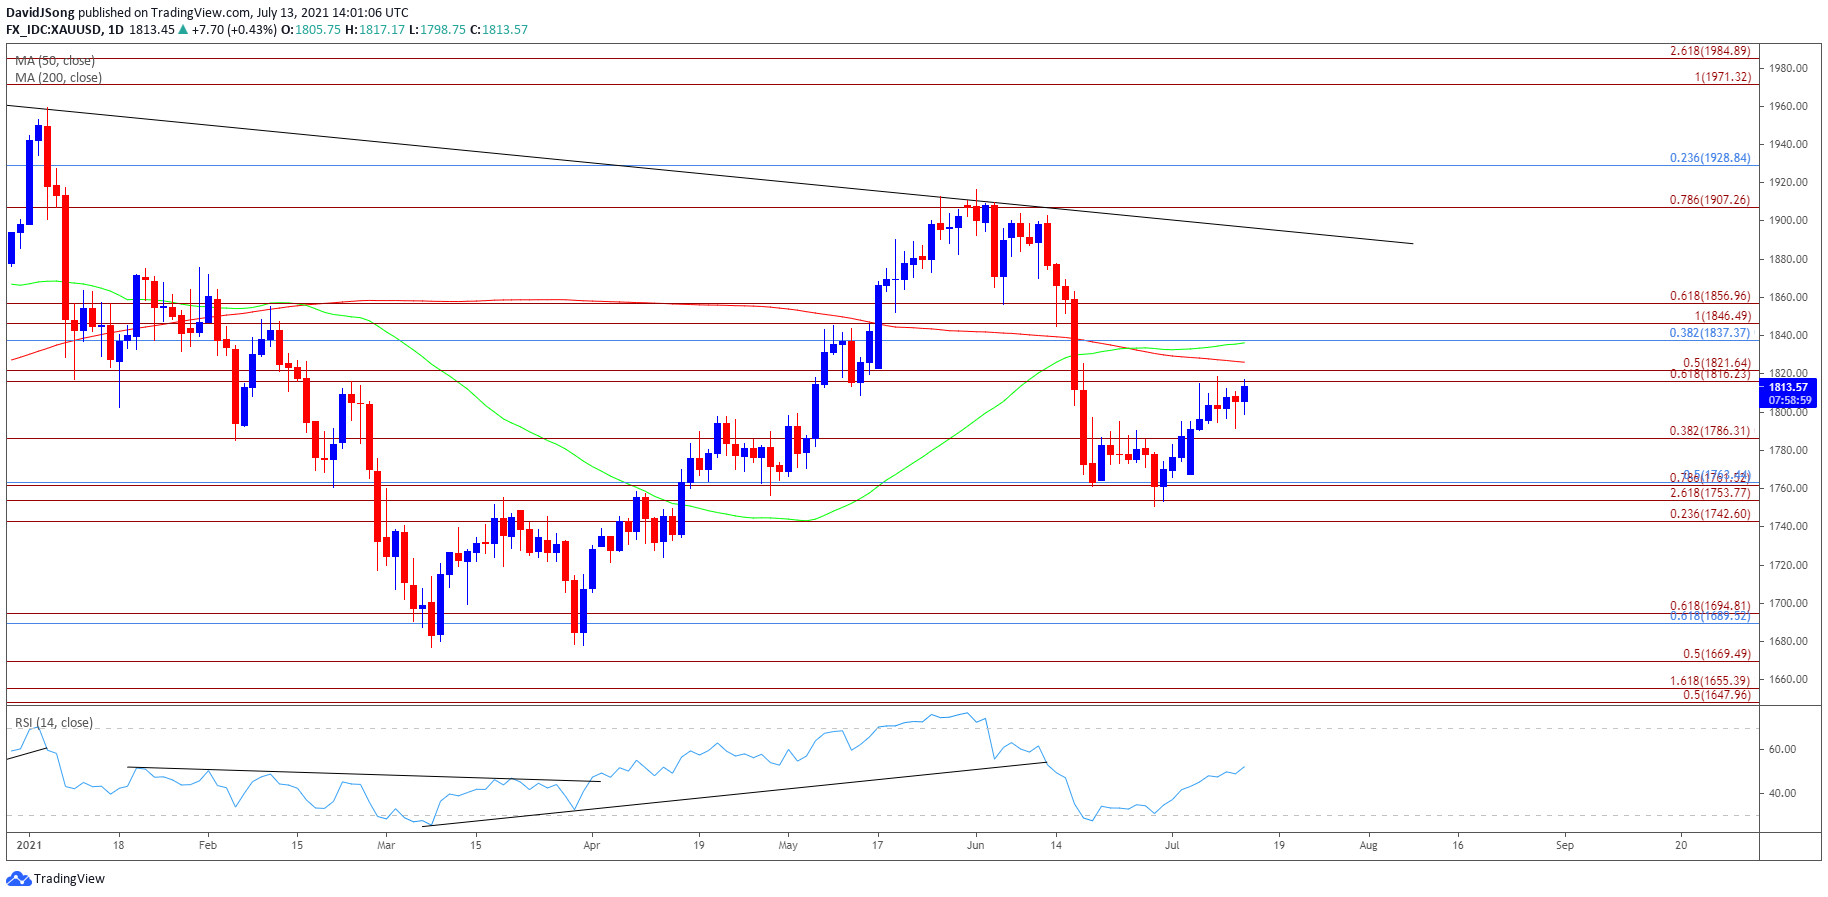
Source: Trading View
- Keep in mind, a double-bottom emerged in March as the price of gold failed to test the June 2020 low ($1671), with the key reversal pattern pushing the precious metal back above the 200-Day SMA ($1826) for the first time since February.
- At the same time, the Relative Strength Index (RSI) pushed into overbought territory for the first time since July 2020 as the price of gold appeared to be on track to test the January high ($1959), but the double-bottom formation seems to have run its course as the RSI snaps the upward trend from earlier this year.
- As a result, bullion trades below the 50-Day SMA ($1836) for the first time since April, and the recent rebound in the price of gold appears to be stalling ahead of the 200-Day SMA ($1826) amid the failed attempts to break/close above the $1816 (61.8% expansion) to $1822 (50% expansion) region.
- In turn, the price of gold may continue to track the monthly range, with a move below the $1786 (38.2% expansion) region bringing the Fibonacci overlap around $1743 (23.6% expansion) to $1763 (50% retracement) back on the radar.
— Written by David Song, Currency Strategist
Follow me on Twitter at @DavidJSong
Be the first to comment