

Gold price gained bullish momentum above $1,950 before correcting lower. Crude oil price is holding the $92.00 support and might start a fresh increase.
Important Takeaways for Gold and Oil
· Gold price started a major increase above the $1,900 and $1,920 levels against the US Dollar.
· There was a break below a key bullish trend line with support near $1,920 on the hourly chart of gold.
· Crude oil price corrected lower, but it found support near $91.00.
· There is a major bullish trend line forming with support near $92.10 on the hourly chart of XTI/USD.
Gold Price Technical Analysis
Gold price formed a support base near $1,850 and started a fresh increase against the US Dollar. The price gained pace for a move above the $1,900 level to move into a positive zone.
There was a clear move above the $1,920 level and the 50 hourly simple moving average. The price even climbed above the $1,950 resistance level. A high was formed near $1,974 on FXOpen before the price started a downside correction.
There was a break below the $1,950 level. Besides, there was a break below a key bullish trend line with support near $1,920 on the hourly chart of gold.
The price even spiked below the $1,900 level, but it found support near $1,880. A low is formed near $1,878 and the price is rising again. There was a move above the 23.6% Fib retracement level of the recent decline from the $1,974 swing high to $1,878 low.
On the upside, the price is facing resistance near the $1,915 level and the 50 hourly simple moving average. The main resistance is now forming near the $1,935 level.
The 50% Fib retracement level of the recent decline from the $1,974 swing high to $1,878 low is also near $1,935. A close above the $1,935 level could open the doors for a steady increase towards $1,950. The next major resistance sits near the $1,975 level.
On the downside, an initial support is near the $1,900 level. The first major support is near the $1,880 level. If there is a downside break below the $1,880 level, the price could decline to $1,850.
Oil Price Technical Analysis
Crude oil price started a steady increase from the $90.00 support zone against the US Dollar. The price broke the $92.00 resistance zone to move into a positive zone.
The price even cleared the $98.00 level and settled above the 50 hourly simple moving average. A high was formed near $99.96 and the price started a downside correction. It traded below $95.00, but the bulls are active near $91.00.
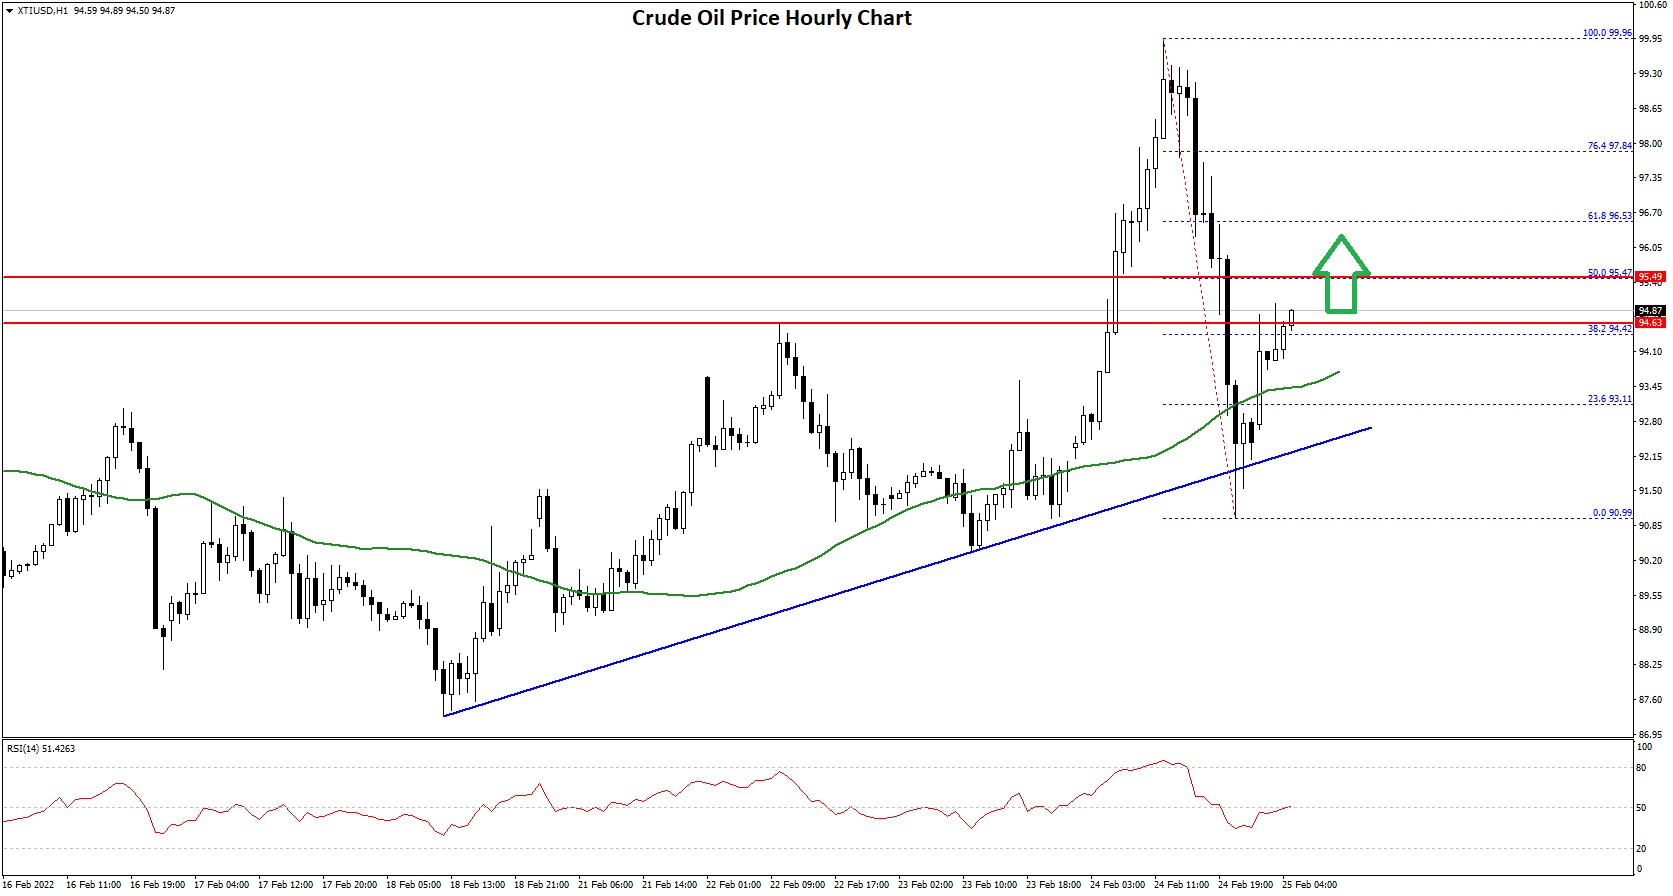
It is now rising and trading above $92.20. There was a break above the 38.2% Fib retracement level of the recent decline from the $99.96 swing high to $90.99 low.
On the upside, the price is facing resistance near the $95.00 level. The next key resistance is near the $95.50 level or the 50% Fib retracement level of the recent decline from the $99.96 swing high to $90.99 low, above which the price might accelerate higher towards $98.00.
On the downside, the price might remain supported near the $94.00 level and the 50 hourly simple moving average. There is also a major bullish trend line forming with support near $92.10 on the hourly chart of XTI/USD.
The next major support is near the $91.00 level, below which there is a risk of a larger decline. In the stated case, the price might slide towards the $86.50 support zone.
This forecast represents FXOpen Markets Limited opinion only, it should not be construed as an offer, invitation or recommendation in respect to FXOpen Markets Limited products and services or as financial advice.

Be the first to comment