

aprott/iStock via Getty Images
By Samara Cohen
Three Things To Know From Q4 2022
- Exchange traded funds (ETFs) remain a fraction of the total global financial market in both equities and fixed income, ranging from 3.9%-12.6% of equities and 0.3%-2.5% of fixed income assets by region.1
- ETF trading as a percentage of total equity volumes was up slightly in Q4. ETF trading volumes in 2022 were the highest on record, with over $53 trillion traded (compared with $41 trillion in 2021).2
- While the CBOE Volatility Index (VIX), a proxy for U.S. equity market volatility, remained high throughout 2022, bid-ask spreads across global ETFs were close to their 2021 levels.3 Bid-ask spreads for global iShares ETFs were tight relative to industry averages at 16.2 basis points (bps) and 29.1 bps, respectively.4
ETF Market Size
Globally, assets under management in ETFs are only a fraction of the total financial market.
ETFs represent 12.6% of equity assets in the U.S., 7.5% in Europe, and 3.9% in Asia-Pacific. Market share is smaller in fixed income, where ETFs account for 2.5% of fixed income assets in the U.S., 1.6% in Europe, and 0.3% in Asia-Pacific (Figures 1, 2, and 3).
Chart Description: Column charts showing the size of equity and fixed incomes ETF assets under management in comparison to the total equity market capitalization and total debt outstanding in the U.S., Europe, and Asia-Pacific. This chart shows that while ETFs represent a large dollar amount of assets, that amount is still small in comparison to both the equity and fixed income markets.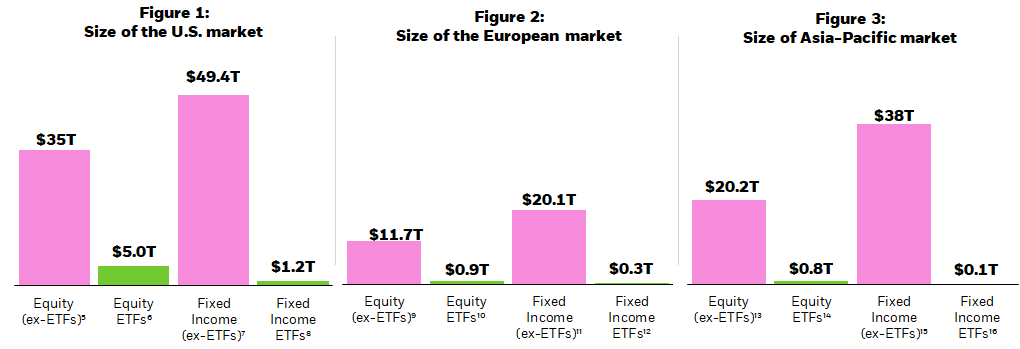
ETF Trading Volumes
In the fourth quarter of 2022, average daily trading volumes for U.S. equities and U.S. ETFs were $502.2 billion and $157.7 billion, respectively. This means that U.S. ETFs accounted for 31.4% of the total U.S. composite volume in the secondary market over the quarter.
The average daily trading volume in European equities was $81.5 billion, while the average daily trading volume in European ETFs was $10.1 billion. This means that secondary market trading in European-domiciled ETFs accounted for 12.4% of total European cash equities over the quarter.
In Asia-Pacific, ETFs accounted for 13.8% of the total composite volume in the secondary market in the quarter, with Asia-Pacific equities and ETFs trading $140 billion and $19.3 billion, respectively (Figures 4, 5, and 6).
Figures 4-6: ETFs as % of total equity trading volume (% average)17
Chart description: Column charts showing ETF trading as a percentage of overall equity market trading volumes in the U.S., Europe, and Asia-Pacific. This chart shows that ETF trading volume as a percentage of the equity trading volume was significantly higher than in previous years as investors continue to trade ETFs at an increasing rate.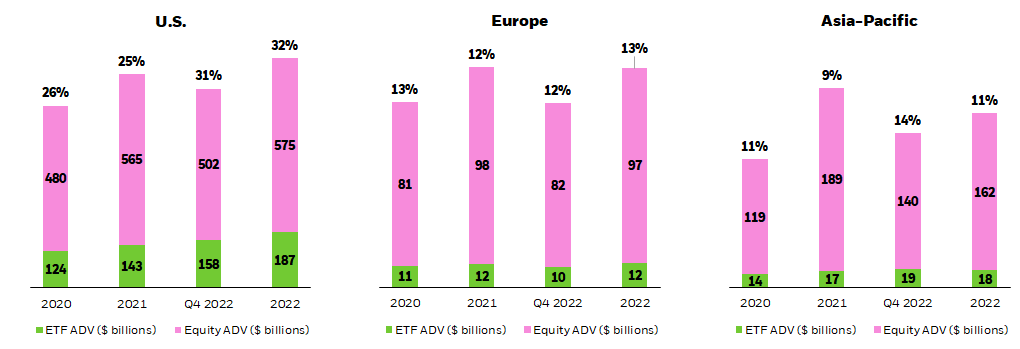
Most Trading Activity Occurs In The Secondary Market
Most ETF trading activity occurs in the secondary market, where ETF shares change hands between buyers and sellers. When demand cannot be met in the secondary market, large institutions (referred to as “authorized participants”) can transact with ETF issuers to create or redeem ETF shares in a separate, “primary” market.
In the fourth quarter of 2022, the ratio of secondary market activity to primary market activity in the U.S. was 9:1. This means that for every $9 of ETFs traded, only $1 resulted in trading activity in the underlying securities. In Europe, this ratio was 2:1 and in Asia-Pacific it was 5:1 (Figures 7, 8, and 9).
Chart description: Column chart showing the amount of ETF trading in the secondary market compared to the amount of primary market activity in the U.S., Europe, and Asia-Pacific. The amount of secondary market activity is far greater than primary activity, which means that most ETF trading takes place on an exchange between buyers and sellers and does not impact the underlying securities of the ETF.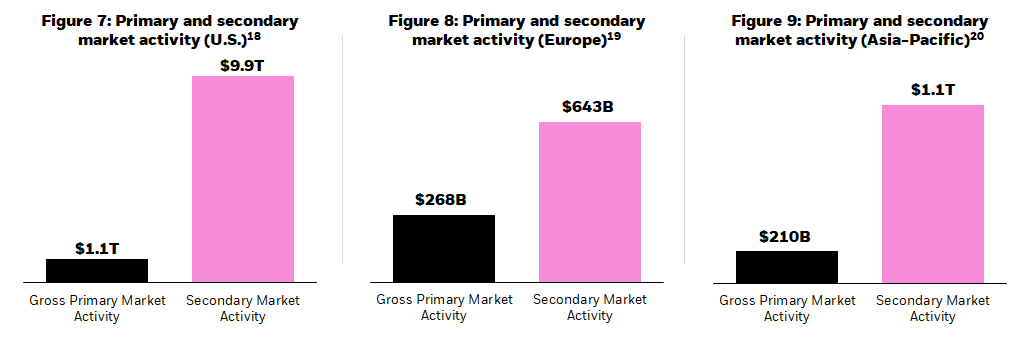
iShares Secondary Market Trading Stats
In the fourth quarter of 2022, the average daily trading volume in U.S. iShares ETFs was $38.7 billion, higher than the Q3 2022 average of $36.2 billion.
In Europe, the average daily trading volume in iShares ETFs was $4.8 billion, higher than the Q3 2022 average daily volume of $4.6 billion.
In Asia-Pacific, the average daily trading volume in iShares ETFs was $0.13 billion, slightly lower than the Q3 2022 average daily volume of $0.14 billion (Figure 10).
Figure 10: Average daily volumes for iShares ETFs21
Chart description: Column chart showing the average daily volume of ETF trading in the U.S., Europe, and Asia-Pacific. While volumes have generally increased in comparison to Q3 2022, the ADVs for global ETFs remain elevated from historical averages.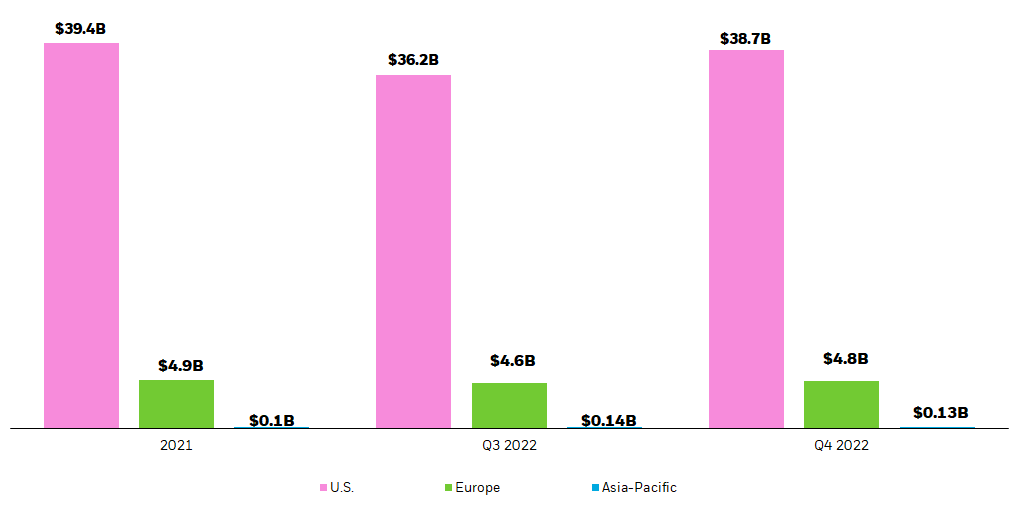
Bid-ask spreads (a component of trading costs for investors), are impacted by factors such as liquidity, volatility, and the efficiency of the ETF ecosystem.
In the U.S., bid-ask spreads in iShares ETFs widened to 12.4 basis points (bps) in Q4, on average. In European-listed iShares ETFs, spreads slightly widened in Q4 to 18.4 bps on average. In Asia-Pacific-listed iShares ETFs, spreads tightened to 23.1 bps on average (Figure 11).
Figure 11: Average iShares ETF bid-ask spreads (bps)22
Chart description: Column chart showing the average bid-ask spread (a component of an ETF’s trading cost) for iShares ETFs in the U.S., Europe, and Asia-Pacific. Bid-ask spreads slightly widened for U.S.-listed iShares ETFs in Q4 2022.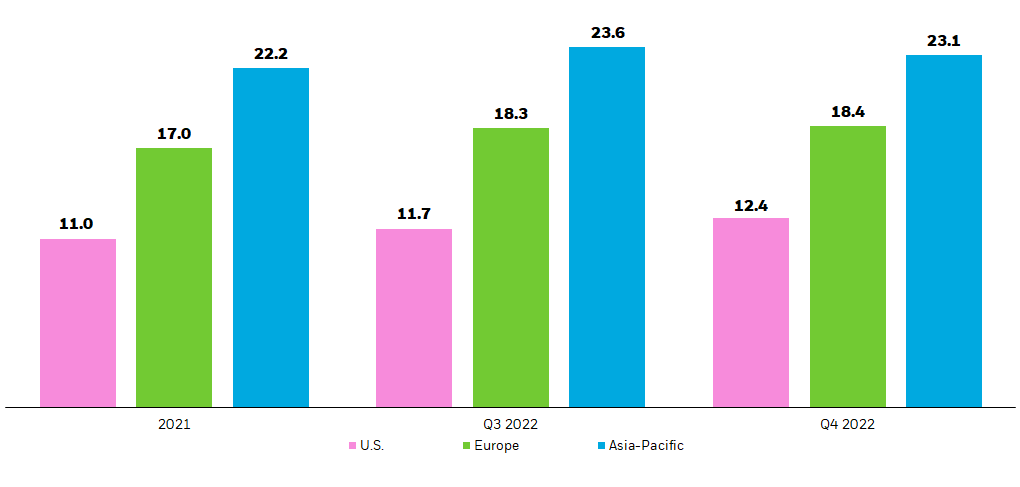
ETF Flows Typically Have Minimal Impact On Stocks
Investors can assess the impact of primary market activity on the prices of underlying stocks through a metric called “imputed flow.” This metric estimates the proportion of all stock trading that results from ETF creations or redemptions; meaning, imputed flow is an approximation for how much stock trading is generated by ETF inflows and outflows.
The impact is typically modest. From the period December 2020 through December 2022, approximately 5.6% of trading volume in U.S. equities has been attributable to ETF activity, while in Europe, just 1.9% of trading in individual European stocks has been attributable to ETF flows. In Asia-Pacific, this figure is 1.4% (Figures 12, 13, and 14).
Figures 12-14: Percentage of stock trading as a result of ETF flows23
Chart description: Line charts showing both the total and average imputed flow in the U.S., Europe, and Asia-Pacific. Imputed flow is an estimation of how stock trading is generated by ETF inflows and outflows. The charts show that imputed flow is below 6%, on average, in all regions.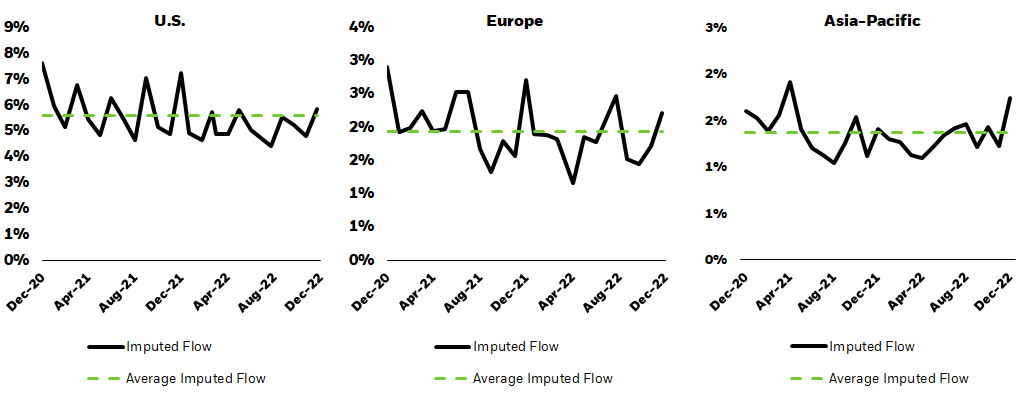
2022 In Review
- In a turbulent year for global markets, investors continued to use ETFs at an increasing rate, with global ETF trading volumes reaching record levels. For example, in the U.S, ETFs represented over 32% of total equity volume traded on average, up from 25% in 2021.24
- Despite market choppiness, global ETF trading in 2022 was generally orderly, with bid-ask spreads across global ETFs staying close to their 2021 levels. Bid-ask spreads in global iShares ETFs were nearly 40% tighter than industry averages.25
Record ETF Trading Activity Around The Globe
While ETF flows declined year-over-year, ETF trading activity in 2022 was the largest on record, surpassing full-year 2021 levels by the end of Q3.
Global investors traded $53.8 trillion in ETFs this year, an ADV of $216.9 billion, versus $171 billion in 2021.26 This was consistent across regions, with records set in the U.S., Europe, and Asia-Pacific. In particular, ADV for global fixed income ETFs was the largest percentage change by asset class, with a 36% increase year-over-year (Figure 15).
Figure 15: Average daily volumes of global ETFs ($billions)27
Chart description: Column chart showing average daily volumes of global ETFs by asset class. This chart showcases the growth in average daily volumes, particularly in 2022.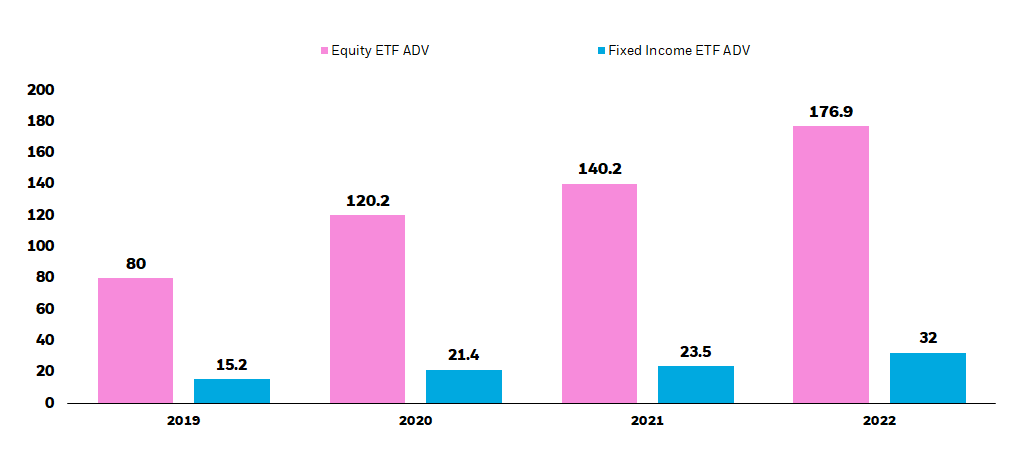
ETF trading volume as a percentage of total equity trading volume was elevated across regions in 2022 as investors increasingly turned to ETFs to express market views. This was particularly apparent on trading days that coincided with large macroeconomic events. For example, on the days of Consumer Price Index (CPI) releases and Federal Reserve Open Market Committee (FOMC) meeting minutes, which tend to have important implications for U.S. monetary policy, U.S. ETF volumes as a percentage of total equity volumes spiked (Figure 16).
Figure 16: U.S. ETFs as % of total equity trading volume during notable macroeconomic events28
Chart Description: Line chart showing average daily volumes of U.S. listed ETFs. This chart showcases the growth in average daily volumes, particularly in 2022. The chart also shows U.S. ETF trading as a percentage of overall equity market trading volumes This chart shows that ETF trading volume as a percentage of total equity trading volume was significantly higher in days with either FOMC meeting minutes releases or Consumer Price Index [CPI] releases.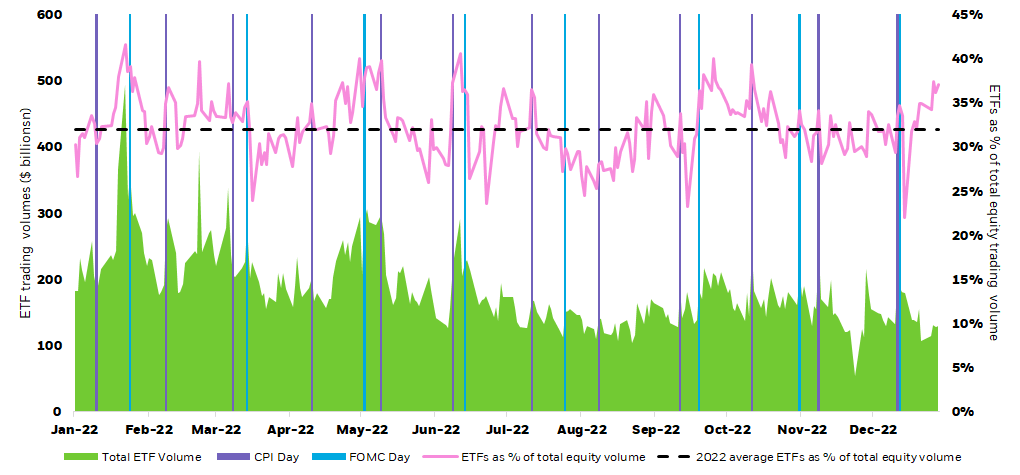
ETF Trading Costs Were Resilient
Despite numerous headwinds and persistent volatility across multiple asset classes, global ETF bid-ask spreads stayed tight.
When volatility is high, ETF market quality can be challenged; for example, trading costs (bid-ask spreads) may increase. However, in 2022, global ETF markets were resilient with average bid-ask spreads of 29.1 bps. This is above average bid-ask spreads in 2021 (23.8 bps)–a much less volatile year for markets–but below 2020 averages (32.1bps).
Average bid-ask spreads for global iShares ETFs were also slightly above their 2021 figures, but well under 2020 averages (Figure 17).
Figure 17: Average iShares and industry global ETF bid-ask spreads (bps)29
Chart Description: Column chart showing the average bid-ask spread (a component of an ETF’s trading cost) for global iShares ETFs compared with the ETF industry. Bid-ask spreads slightly widened for iShares and industry ETFs in 2022.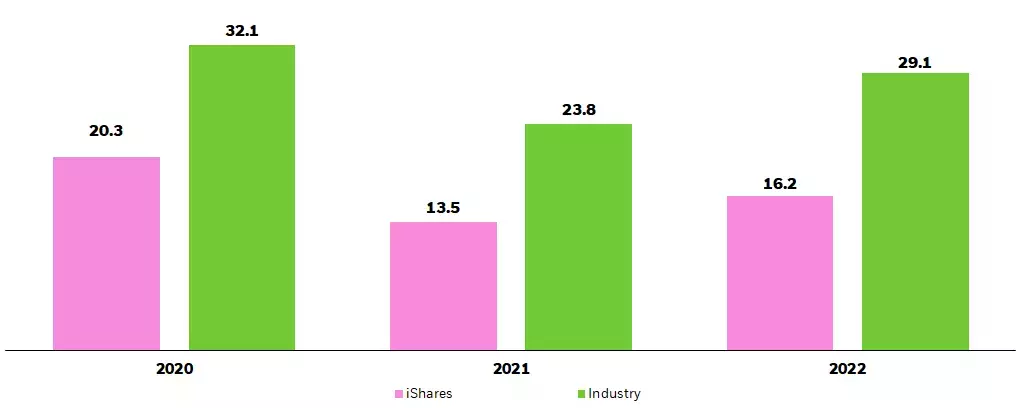
Global iShares ETF bid-ask spreads were consistently tighter than the industry average across both equities and fixed income over the last three years. In 2022, average global equity iShares ETF bid-ask spreads were 15.7bps compared with the industry average of 30bps.
In fixed income, average global iShares ETF bid-ask spreads were 16.3bps in 2022, compared with an industry average of 22.3bps (Figure 18).
Figure 18: Average iShares and industry global ETF bid-ask spreads by asset class (bps)30
Chart Description: Column chart showing the average bid-ask spread (a component of an ETF’s trading cost) for global iShares ETFs compared with the ETF industry for both equity and fixed income ETFs. Bid-ask spreads slightly widened for iShares and industry ETFs in 2022.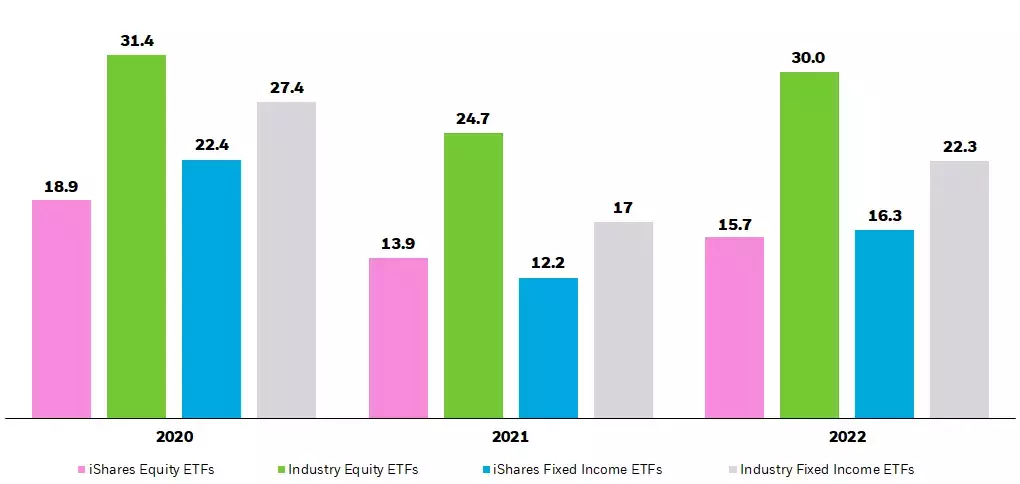
A Look At Retail Participation In ETFs
- ETF trading volumes driven by retail investors in 2022 were the most on record. As of Q3, retail investors had already traded over $6.6 trillion in ETFs, over 30% more than what they traded in all of 2021.31
- Retail investors accounted for 15% of all ETF trading volumes in 2022, but remained a higher percentage in certain segments, like levered and inverse exchange traded products (ETPs), where they represented nearly 34% of all ETP volume.32
© 2023 BlackRock, Inc. All rights reserved.
1 See footnotes 5-16 for reference.
2 As of December 31, 2022. Source: Bloomberg, BlackRock.
3 The Cboe Volatility Index (VIX) is a real-time index that represents the market’s expectations for the relative strength of near-term price changes of the S&P 500® Index (SPX). Because it is derived from the prices of SPX index options with near-term expiration dates, it generates a 30-day forward projection of volatility. Volatility, or how fast prices change, is often seen as a way to gauge market sentiment, and in particular the degree of fear among market participants.
4 A basis point (bp) is one hundredth of one percent. As of December 31, 2022. Source: TAQ Refinitiv.
5 As of December 31, 2022. Equity (ex-ETFs) represented by the market capitalization of the Russell 3000 index. Source: Bloomberg.
6 As of December 31, 2022. Source: BlackRock, Markit.
7 As of June 30, 2022. Source: Bank for International Settlements (BIS).
8 As of December 31, 2022. Source: BlackRock, Markit.
9 As of December 31, 2022. Equity (ex-ETFs) represented by the market capitalization of STOXX Europe 600 index. Source: Bloomberg. Cboe Global Markets.
10 As of December 31, 2022. Source: BlackRock, Markit
11 As of April 30, 2022. Outstanding debt issued by the residents of Euro area. Source: European Central Bank.
12 As of December 31, 2022. Source: BlackRock, Markit.
13 As of December 31, 2022. Equity (ex-ETFs) represented by the market capitalization of the MSCI Asia Pacific All Country index. Source: Bloomberg.
14 As of December 31, 2022. Source: BlackRock, Markit.
15 As of June 30, 2022. Source: Bank for International Settlements (BIS).
16 As of December 31, 2022. Source: BlackRock, Markit.
17 As of December 31, 2022. Source: Bloomberg, BlackRock.
18 As of December 31, 2022. Source: Bloomberg, BlackRock, Markit.
19 As of December 31, 2022. Source: Bloomberg, BlackRock, Markit.
20 As of December 31, 2022. Source: Bloomberg, BlackRock, Markit.
21 As of December 31, 2022. Source: Bloomberg, BlackRock.
22 A basis point (bp) is one hundredth of one percent. As of December 31, 2022. Source: TAQ Refinitiv.
23 As of December 31, 2022. Source: Bloomberg, BlackRock.
24 As of December 31, 2022. Source: Bloomberg, BlackRock.
25 A basis point (bp) is one hundredth of one percent. As of December 31, 2022. Source: TAQ Refinitiv.
26 As of December 31, 2022. Source: Bloomberg, BlackRock.
27 As of December 31, 2022. Source: Bloomberg, BlackRock.
28 As of December 31, 2022. Source: Bloomberg, BlackRock.
29 A basis point (bp) is one hundredth of one percent. As of December 31, 2022. Source: TAQ Refinitiv.
30 A basis point (bp) is one hundredth of one percent. As of December 31, 2022. Source: TAQ Refinitiv.
31 As of November 30, 2022. Source: SEC Rule 605 Data, Bloomberg. Rule 605 data requires wholesale market makers to provide transparency into their orders and executions.
32 As of November 30, 2022. Source: SEC Rule 605 Data, Bloomberg. Rule 605 data requires wholesale market makers to provide transparency into their orders and executions.
Carefully consider the Funds’ investment objectives, risk factors, and charges and expenses before investing. This and other information can be found in the Funds’ prospectuses or, if available, the summary prospectuses, which may be obtained by visiting the iShares Fund and BlackRock Fund prospectus pages. Read the prospectus carefully before investing.
Investing involves risk, including possible loss of principal.
A fund’s use of derivatives may reduce a fund’s returns and/or increase volatility and subject the fund to counterparty risk, which is the risk that the other party in the transaction will not fulfill its contractual obligation. A fund could suffer losses related to its derivative positions because of a possible lack of liquidity in the secondary market and as a result of unanticipated market movements, which losses are potentially unlimited. There can be no assurance that any fund’s hedging transactions will be effective.
This material represents an assessment of the market environment as of the date indicated; is subject to change; and is not intended to be a forecast of future events or a guarantee of future results. This information should not be relied upon by the reader as research or investment advice regarding the funds or any issuer or security in particular.
This material is provided for educational purposes only and is not intended to constitute investment advice or an investment recommendation within the meaning of federal, state or local law. You are solely responsible for evaluating and acting upon the education and information contained in this material. BlackRock will not be liable for direct or incidental loss resulting from applying any of the information obtained from these materials or from any other source mentioned. BlackRock does not render any legal, tax or accounting advice and the education and information contained in this material should not be construed as such. Please consult with a qualified professional for these types of advice.
Shares of ETFs may be bought and sold throughout the day on the exchange through any brokerage account. Shares are not individually redeemable from an ETF, however, shares may be redeemed directly from an ETF by Authorized Participants, in very large creation/redemption units.
The Funds are distributed by BlackRock Investments, LLC (together with its affiliates, “BlackRock”).
© 2023 BlackRock, Inc. All rights reserved. BLACKROCK, BLACKROCK SOLUTIONS, BUILD ON BLACKROCK, ALADDIN, iSHARES, iBONDS, FACTORSELECT, iTHINKING, iSHARES CONNECT, FUND FRENZY, LIFEPATH, SO WHAT DO I DO WITH MY MONEY, INVESTING FOR A NEW WORLD, BUILT FOR THESE TIMES, the iShares Core Graphic, CoRI and the CoRI logo are trademarks of BlackRock, Inc., or its subsidiaries in the United States and elsewhere. All other marks are the property of their respective owners.
iCRMH1022U/S-2466779
This post originally appeared on the iShares Market Insights.
Editor’s Note: The summary bullets for this article were chosen by Seeking Alpha editors.
Be the first to comment