

Khaosai Wongnatthakan
By Samara Cohen
Three Things to Know From Q3 2022
- Exchange traded funds (ETFs) remain a fraction of the total global financial market in both equities and fixed income.
- ETF trading as a percentage of equity volumes slightly declined in Q3, but remains elevated from prior years; 2022 year-to-date ETF trading volumes have already surpassed FY 2021 volumes.
- Appetite for more complex exchange traded products (ETPs) is growing as a plethora of new product launches, especially options-based products, see strong initial investor adoption.
ETF Market Size
Globally, assets under management in ETFs are only a fraction of the total financial market.
ETFs represent 12% of equity assets in the U.S., 6.8% in Europe, and 3.8% in Asia-Pacific. Market share is smaller in fixed income, where ETFs account for 2.3% of fixed income assets in the U.S., 1.5% in Europe, and 0.2% in Asia-Pacific (Figures 1, 2, and 3).
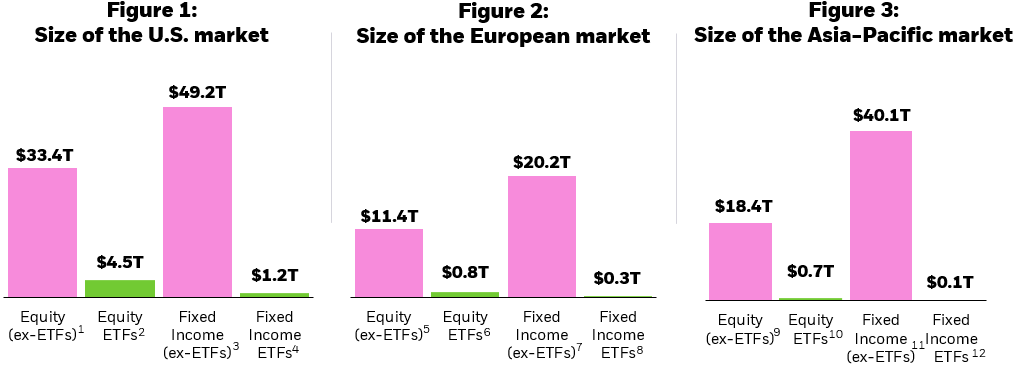
Chart description: Column charts showing the size of equity and fixed incomes ETF assets under management in comparison to the total equity market capitalization and total debt outstanding in the U.S., Europe, and Asia-Pacific. This chart shows that while ETFs represent a large dollar amount of assets, that amount is still small in comparison to both the equity and fixed income markets.
ETF Trading Volumes
In the third quarter of 2022, average daily trading volumes for U.S. equities and U.S. ETFs were $484 billion and $148.9 billion, respectively. This means that U.S. ETFs accounted for nearly 31% of the total U.S. composite volume in the secondary market over the quarter.
The average daily trading volume in European equities was $70.2 billion, while the average daily trading volume in European ETFs was $10.0 billion. This means that secondary market trading in European-domiciled ETFs accounted for roughly 14% of total European cash equities over the quarter.
In Asia-Pacific, ETFs accounted for 10.4% of the total composite volume in the secondary market in the quarter, with Asia-Pacific equities and ETFs trading $152.7 billion and $16 billion, respectively (Figure 4).
Figure 4: ETFs as % of equity trading volume
(average)13
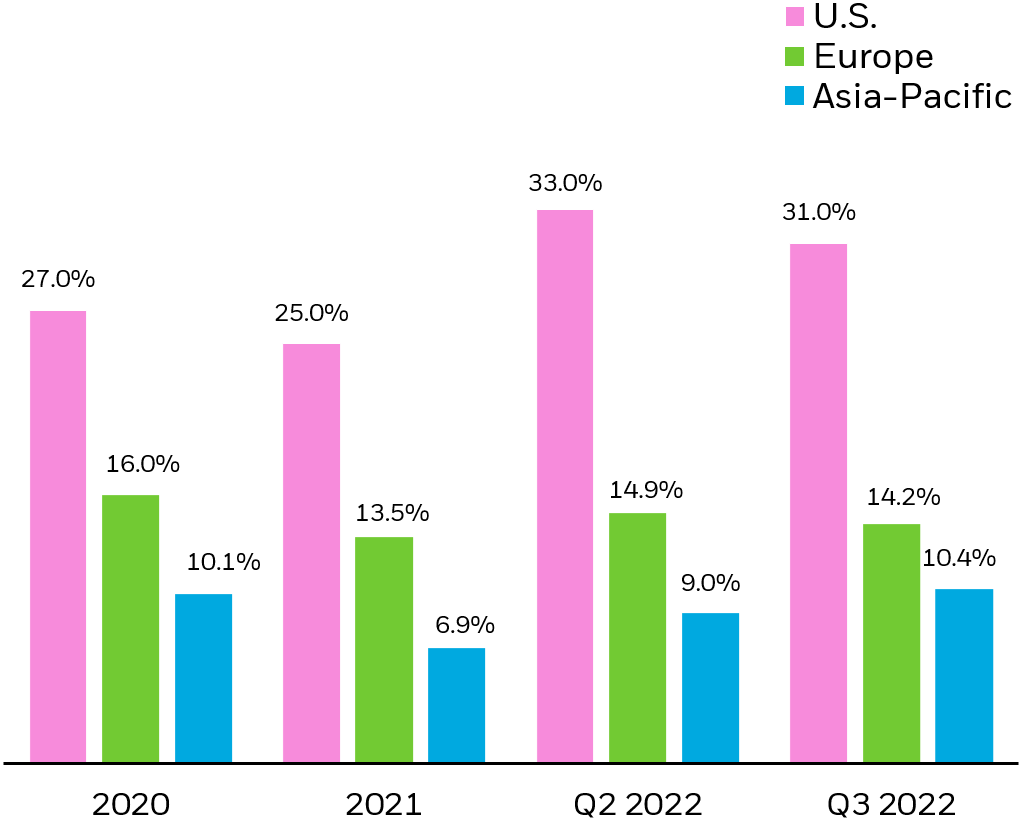
Chart description: Column chart showing ETF trading as a percentage of overall equity market trading volumes in the U.S., Europe, and Asia-Pacific. This chart shows that ETF trading volume as a percentage of the equity trading volume slightly declined in Q3 2022, but was significantly higher than in previous years as investors continue to trade ETFs at an increasing rate.
Most Trading Activity Occurs in the Secondary Market
Most ETF trading activity occurs in the secondary market, where ETF shares change hands between buyers and sellers. When demand cannot be met in the secondary market, large institutions (referred to as “authorized participants”) can transact with ETF issuers to create or redeem ETF shares in a separate, “primary” market.
In the third quarter of 2022, the ratio of secondary market activity to primary market activity in the U.S. was 10:1. This means that for every $10 of ETFs traded, only $1 resulted in trading activity in the underlying securities. In Europe, this ratio was 2:1 and in Asia-Pacific it was 5:1 (Figures 5, 6, and 7).
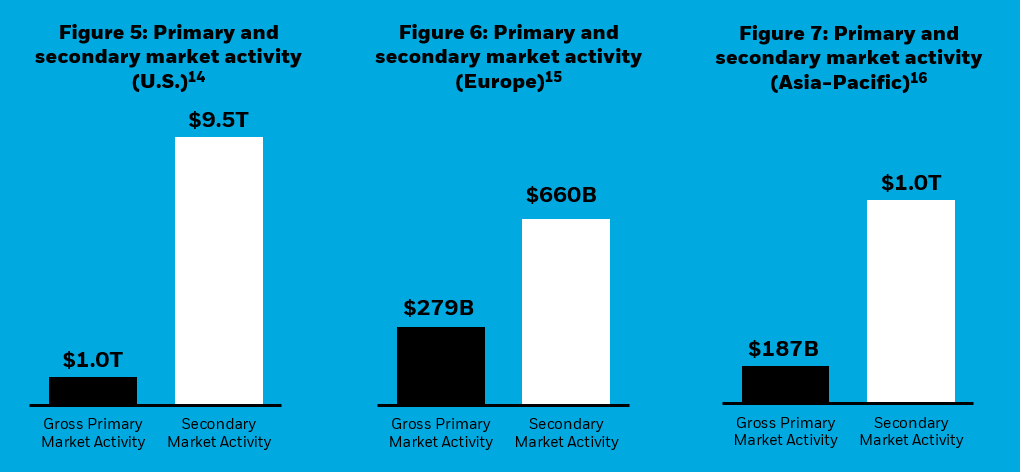
Chart description: Column chart showing the amount of ETF trading in the secondary market compared to the amount of primary market activity in the U.S., Europe, and Asia-Pacific. The amount of secondary market activity is far greater than primary activity, which means that most ETF trading takes place on an exchange between buyers and sellers and does not impact the underlying securities of the ETF.
iShares Secondary Market Trading Stats
In the third quarter of 2022, the average daily trading volume in U.S. iShares ETFs was $36.2 billion, lower than the Q2 2022 average ($48.8 billion).
In Europe, the average daily trading volume in iShares ETFs was $4.6 billion, lower than the Q2 2022 average daily volume of $5.4 billion.
In Asia-Pacific, the average daily trading volume in iShares ETFs was $0.14 billion, slightly higher than the Q2 2022 average daily volume of $0.13 billion (Figure 8).
Figure 8: Average daily volumes for iShares ETFs17
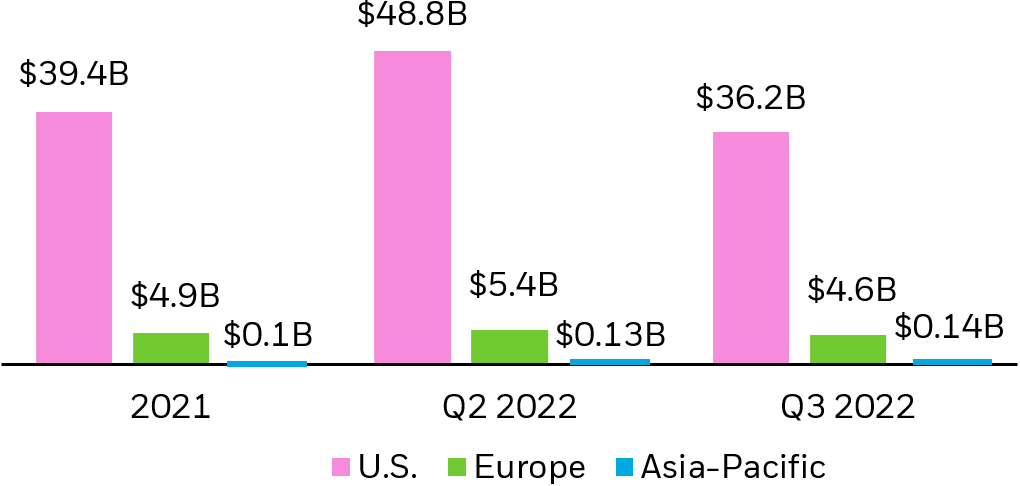
Chart description: Column chart showing the average daily volume (ADV) of ETF trading in the U.S., Europe, and Asia-Pacific. While volumes have declined in comparison to Q2 2022, the ADVs for global ETFs remain elevated from historical averages.
Bid-ask spreads (a component of trading costs for investors), are impacted by factors such as liquidity, volatility, and the efficiency of the ETF ecosystem.
In the U.S., bid-ask spreads in iShares ETFs tightened to 11.7 basis points (bps) in Q3, on average, despite experiencing large drawdowns in major financial markets. In European-listed iShares ETFs, spreads widened in Q3 to 18.3 bps on average. In Asia-Pacific-listed iShares ETFs, spreads slightly tightened to 23.6 bps on average (Figure 9).
Figure 9: Average iShares ETF bid-ask spreads
(bps)18
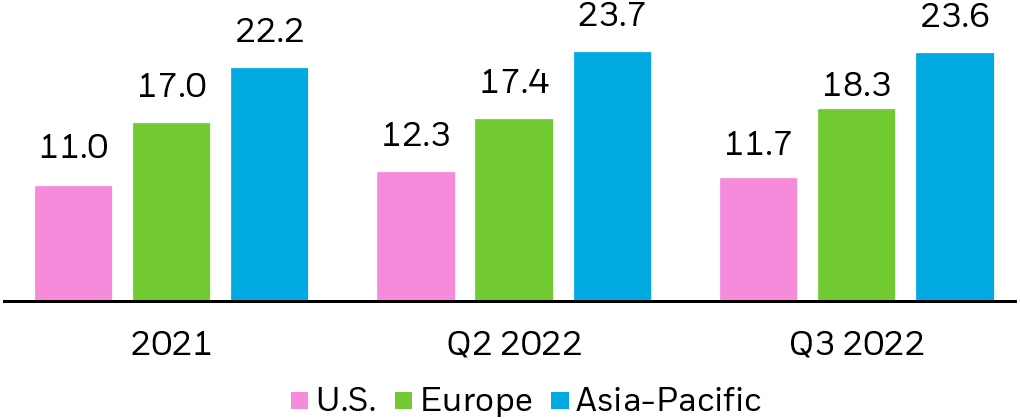
Chart description: Column chart showing the average bid-ask spread (a component of an ETF’s trading cost) for iShares ETFs in the U.S., Europe, and Asia-Pacific. Bid-ask spreads tightened for U.S.-listed iShares ETFs in Q3 2022, despite challenging market conditions.
ETF Flows Typically Have Minimal Impact on Stocks
Investors can assess the impact of primary market activity on the prices of underlying stocks through a metric called “imputed flow.” This metric estimates the proportion of all stock trading that results from ETF creations or redemptions; meaning, imputed flow is an approximation for how much stock trading is generated by ETF inflows and outflows.
The impact is typically modest. From the period January 2021 through September 2022, approximately 5.4% of trading volume in U.S. equities has been attributable to ETF activity, while in Europe, just 1.9% of trading in individual European stocks has been attributable to ETF flows. In Asia-Pacific, this figure is 1.3% (Figures 10, 11, and 12).
Figures 10-12: Percentage of stock trading as a result of ETF flows19
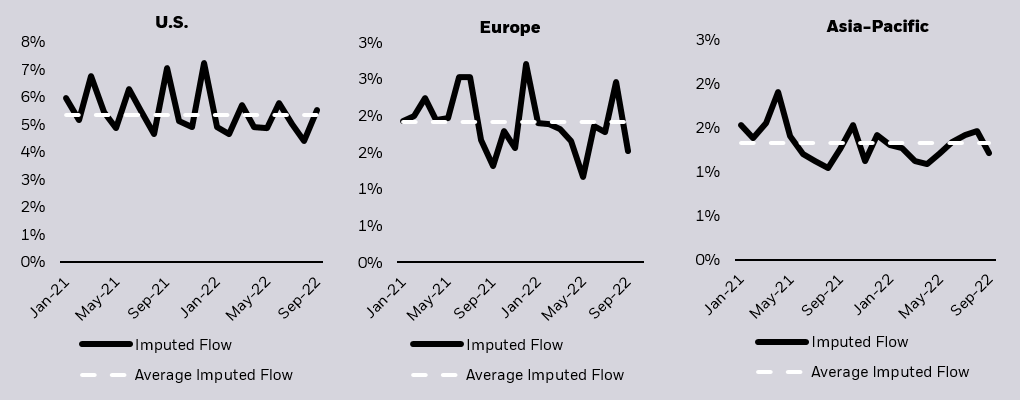
Chart description: Line charts showing both the total and average imputed flow in the U.S., Europe, and Asia-Pacific. Imputed flow is an estimation of how stock trading is generated by ETF inflows and outflows. The charts show that imputed flow is below 5%, on average, in all regions.
Q3 2022 Deep Dive: Options-based ETPs
- Q3 2022 saw an increase of new U.S. listed options-based ETP launches with 9 and 26 new ETPs launched this quarter and year-to-date, respectively.20
- With over 200 of these products available as of Q3 2022, they account for roughly 7% of the total number of U.S. ETPs on offer. 21 In other words, the options-based ETP market is still nascent and evolving.
- Investor appetite for these products has been strong, with over $23 billion in year-to-date flows into U.S. listed options-based ETPs, the largest on record for this product segment (Figure 13).
Figure 13: Flows into U.S.-listed options-based ETPs
($ billions)22
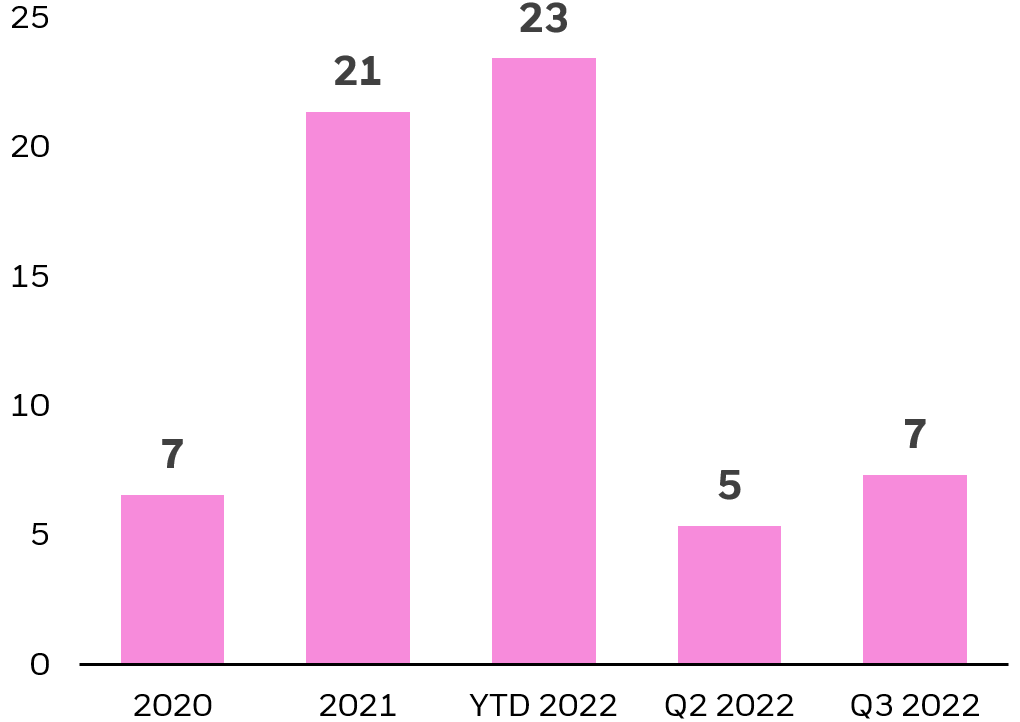
Chart description: Column chart showing asset flows into U.S.-listed options-based ETPs. This chart showcases the growth in flows within the category, particularly in 2022.
Sophisticated Strategies in an ETP Wrapper
As U.S. ETP industry assets and the breadth of use cases for ETPs in portfolios continue to grow, so too does the number of new product launches, particularly in specialized investment strategies, such as options–based ETPs.
Using derivatives in ETPs to efficiently gain exposure to certain asset classes (e.g., commodities) is not a new phenomenon.23 However, new products are now using options as a core tool to deliver more sophisticated investment strategies, like those that seek to manage downside risk or provide structured payouts, in ETP wrappers. Historically, these strategies were only available to a subset of investors due to their complexity and cost; today, ETPs are democratizing access to these exposures (Figure 14).
Figure 14: Sample options-based ETP category definitions24
| Investment strategy | Description | Sample of options used | AUM ($ billions) |
|---|---|---|---|
| BuyWrite |
|
|
$25.6 |
| Underwrite |
|
$0.46 | |
| Principal Protection |
|
|
$4.4 |
| Buffer |
|
|
$16.1 |
Evaluating Options-based ETP Market Quality
As most options-based ETPs launched within the last four years, their market quality is still developing;26 however, over the past few quarters, these products have seen market quality improvements in a few key areas.27
For example, in Q3 2022, the average daily trading volume for U.S.-listed options-based ETPs was $154 million — still small compared to the overall U.S. ETP market but a noticeable uptick from 2020 and 2021 (Figure 15).
Figure 15: Average daily volumes for U.S.-listed options-based ETPs
($ millions)28
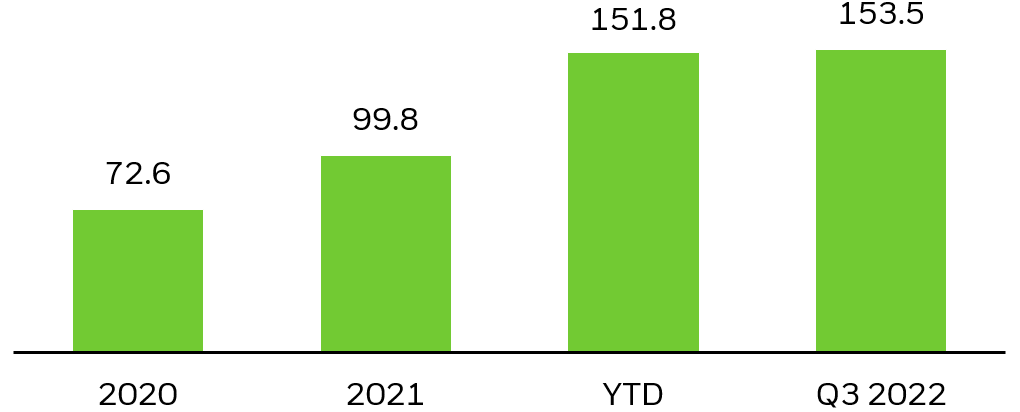
Chart description: Column chart showing the ADV of U.S.-listed options-based ETPs. The increasing ADV in this category suggests that options-based ETPs are becoming more popular with investors as the category matures.
Bid-ask spreads in U.S.-listed options-based ETPs were 33.4 bps in Q3 2022. This is higher than the industry average (25 bps), but significantly tighter than in prior years. For example, in 2020 and 2021 bid-ask spreads were 50.2 bps and 36.9 bps, respectively (Figure 16).
Another determinant of market quality is how much investors are actively trading ETP shares in the secondary market. In Q3 2022, the ratio of secondary market activity to primary market activity for U.S. listed options-based ETPs was 5:1 compared with 10:1 for the U.S. ETF industry. This means that for every $5 of options-based ETPs traded, only $1 resulted in trading activity in the underlying securities.29
Figure 16: Average U.S.-listed options-based ETP bid-ask spreads
(bps)30
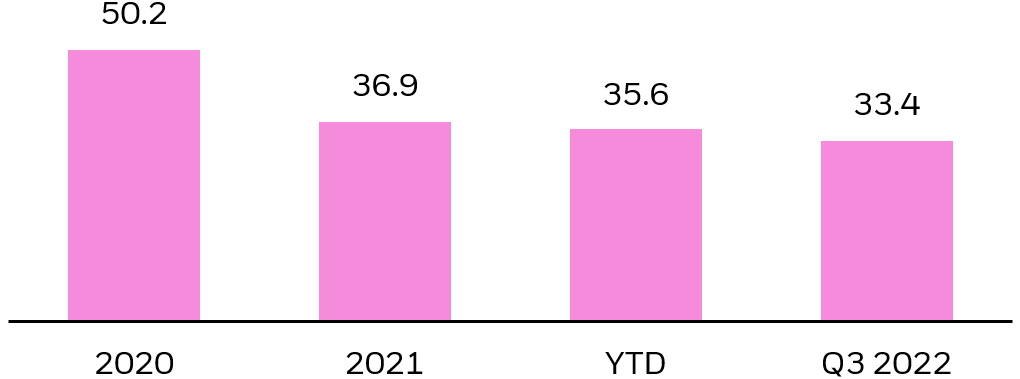
Chart description: Column chart showing the average bid-ask spread for U.S. listed options-based ETPs. This chart indicates that bid-ask spreads have declined in the past few years and making it cheaper to trade in these products today than in 2020.
Retail Participation in Options-based ETPs
- U.S. retail investors traded 35% of the total weighted average volumes for options-based ETPs in Q2 2022, compared with 16% of all ETP trading volumes during the same time.31
- Currently, most options-based ETPs are utilized by a small segment of the retail market, such as self-directed investors and Registered Investment Advisors (RIAs). However, some of the more mature products, like some BuyWrite ETPs, are now available in other venues, like wirehouse platforms for financial advisors. As the amount of assets in this category continues to grow, options-based ETPs could see increased use across different channels.32
© 2022 BlackRock, Inc. All rights reserved.
1 As of September 30, 2022. Equity (ex-ETFs) represented by the market capitalization of the Russell 3000 index. Source: Bloomberg.
2 As of September 30, 2022. Source: BlackRock, Markit.
3 As of March 31, 2022. Source: Bank for International Settlements (BIS).
4 As of September 30, 2022. Source: BlackRock, Markit.
5 As of September 30, 2022. Equity (ex-ETFs) represented by the market capitalization of STOXX Europe 600 index. Source: Bloomberg. Cboe Global Markets.
6 As of September 30, 2022. Source: BlackRock, Markit.
7 As of April 30, 2022. Outstanding debt issued by the residents of Euro area. Source: European Central Bank.
8 As of September 30, 2022. Source: BlackRock, Markit.
9 As of September 30, 2022. Equity (ex-ETFs) represented by the market capitalization of the MSCI Asia Pacific All Country index. Source: Bloomberg.
10 As of September 30, 2022. Source: BlackRock, Markit.
11 As of March 31 2022. Source: Bank for International Settlements (BIS).
12 As of September 30, 2022. Source: BlackRock, Markit.
13 As of September 30, 2022. Source: Bloomberg, BlackRock.
14 As of September 30, 2022. Source: Bloomberg, BlackRock, Markit.
15 As of September 30, 2022. Source: Bloomberg, BlackRock, Markit.
16 As of September 30, 2022. Source: Bloomberg, BlackRock, Markit.
17 As of September 30, 2022. Source: Bloomberg, BlackRock.
18 A basis point (BP) is one hundredth of one percent. As of September 30, 2022. Source: TAQ Refinitiv.
19 As of September 30, 2022. Source: Bloomberg, BlackRock.
20 As of September 30, 2022. Source: Bloomberg, BlackRock.
21 As of September 30, 2022. Source: Bloomberg, BlackRock.
22 As of September 30, 2022. Source: Bloomberg, BlackRock.
23 Certain kinds of ETPs, including some commodity ETPs, leveraged ETPs, and inverse ETPs, use derivatives instead of other types of securities to seek to meet their investment objective. The most common derivatives found in ETPs are futures, which are used particularly often in commodity ETPs so that physical commodities don’t have to be taken possession of and stored.
24 These categorizations are based upon BlackRock’s internal designations. Source: Bloomberg, BlackRock.
25 Tail risk is the chance of a loss occurring due to a rare event, as predicted by a probability distribution. A short-term move of more than three standard deviations is considered to instantiate tail risk. While tail risk technically refers to both the left and right tails, investors are typically most concerned with losses (the left tail). Standard deviation measures how dispersed returns are around the average. A higher standard deviation indicates that returns are spread out over a larger range of values and thus, more volatile.
26 Source: Bloomberg, BlackRock.
27 For more information on how BlackRock measures market quality for our index and ETF products, see “Take a closer look: ETF and index fund investment performance”.
28 As of September 30, 2022. Source: Bloomberg, BlackRock, Markit.
29 As of September 30, 2022. Source: TAQ Refinitiv.
30 As of September 30, 2022. Source: Bloomberg, BlackRock, Markit.
31 As of June 30, 2022. Source: SEC Rule 605 Data, Bloomberg. Rule 605 data requires wholesale market makers to provide transparency into their orders and executions.
32 As of September 30, 2022. Source: Bloomberg (13-F data).
Carefully consider the Funds’ investment objectives, risk factors, and charges and expenses before investing. This and other information can be found in the Funds’ prospectuses or, if available, the summary prospectuses, which may be obtained by visiting the iShares Fund and BlackRock Fund prospectus pages. Read the prospectus carefully before investing.
Investing involves risk, including possible loss of principal.
A fund’s use of derivatives may reduce a fund’s returns and/or increase volatility and subject the fund to counterparty risk, which is the risk that the other party in the transaction will not fulfill its contractual obligation. A fund could suffer losses related to its derivative positions because of a possible lack of liquidity in the secondary market and as a result of unanticipated market movements, which losses are potentially unlimited. There can be no assurance that any fund’s hedging transactions will be effective.
This material represents an assessment of the market environment as of the date indicated; is subject to change; and is not intended to be a forecast of future events or a guarantee of future results. This information should not be relied upon by the reader as research or investment advice regarding the funds or any issuer or security in particular.
This material is provided for educational purposes only and is not intended to constitute investment advice or an investment recommendation within the meaning of federal, state or local law. You are solely responsible for evaluating and acting upon the education and information contained in this material. BlackRock will not be liable for direct or incidental loss resulting from applying any of the information obtained from these materials or from any other source mentioned. BlackRock does not render any legal, tax or accounting advice and the education and information contained in this material should not be construed as such. Please consult with a qualified professional for these types of advice.
Shares of ETFs may be bought and sold throughout the day on the exchange through any brokerage account. Shares are not individually redeemable from an ETF, however, shares may be redeemed directly from an ETF by Authorized Participants, in very large creation/redemption units.
The Funds are distributed by BlackRock Investments, LLC (together with its affiliates, “BlackRock”).
© 2022 BlackRock, Inc. All rights reserved. BLACKROCK, BLACKROCK SOLUTIONS, BUILD ON BLACKROCK, ALADDIN, iSHARES, iBONDS, FACTORSELECT, iTHINKING, iSHARES CONNECT, FUND FRENZY, LIFEPATH, SO WHAT DO I DO WITH MY MONEY, INVESTING FOR A NEW WORLD, BUILT FOR THESE TIMES, the iShares Core Graphic, CoRI and the CoRI logo are trademarks of BlackRock, Inc., or its subsidiaries in the United States and elsewhere. All other marks are the property of their respective owners.
This post originally appeared on the iShares Market Insights.
Editor’s Note: The summary bullets for this article were chosen by Seeking Alpha editors.
Be the first to comment