

Gold Price Forecast Talking Points:
- Gold prices set a fresh seven-month-low last Thursday.
- This low printed around a big zone of confluent support that’s since helped to bring a bullish response into the matter.
- The analysis contained in article relies on price action and chart formations. To learn more about price action or chart patterns, check out our DailyFX Education section.
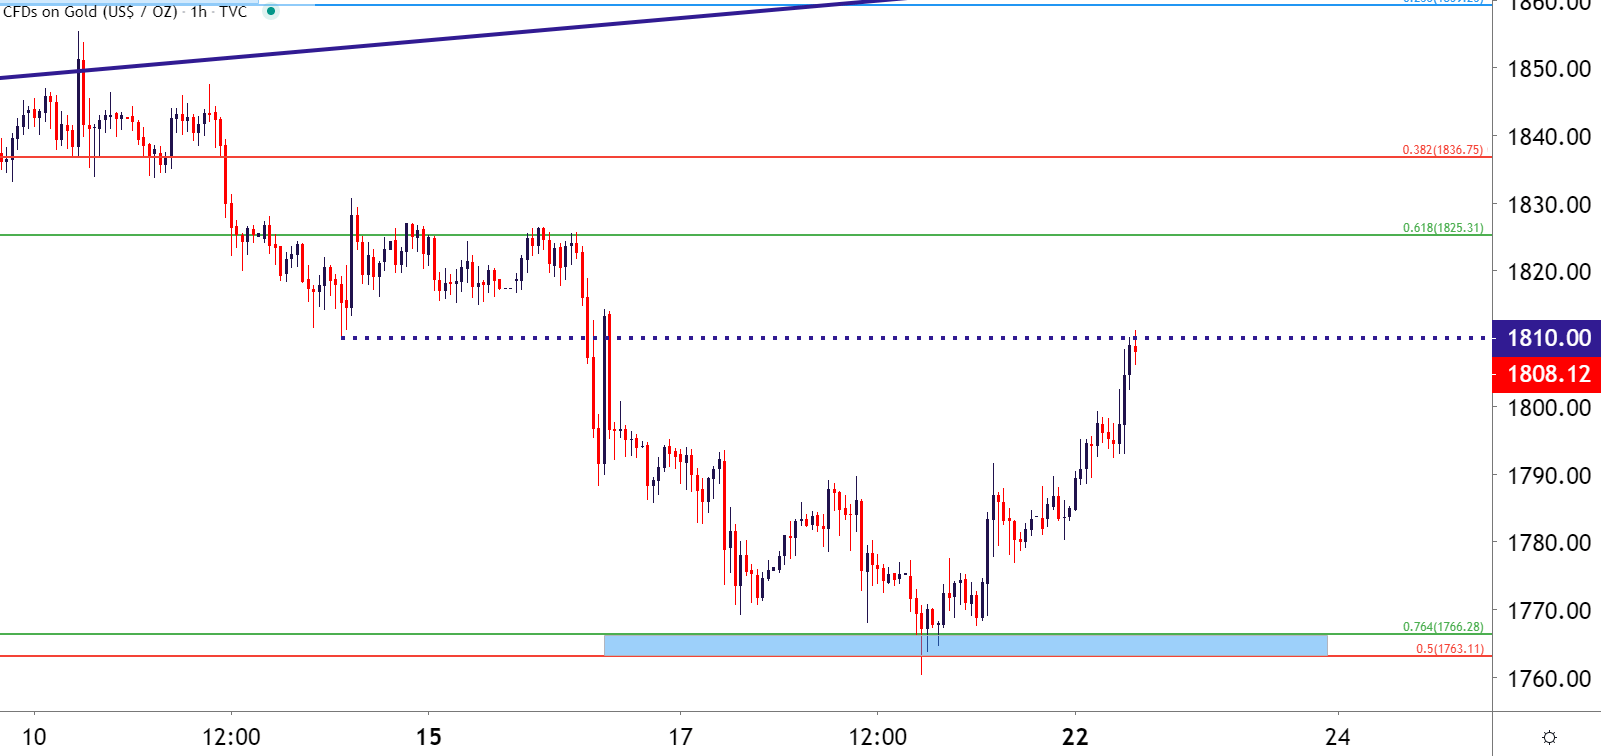
Gold prices are bid today as the yellow metal extends a bounce from a key area of support on the chart. The zone from 1763-1766 was looked at a couple of weeks ago. This area contains two different Fibonacci levels and when it came into play in late-November, it helped to bring buyers back into the mix, and that led into a bounce that entailed a run of more than $200 in a little over a month as buyers backed the bid coming into 2021.
But New Year price action hasn’t been all that friendly to Gold bulls, as a downdraft developed in January that’s lasted through the bulk of February. Last Thursday saw prices develop a fresh seven-month-low, temporarily testing below this confluent zone of support; and bulls have since come back into the matter to push prices back above the 1800 psychological level.
Gold Hourly Price Chart: Support Bounce
Chart prepared by James Stanley; Gold on Tradingview
Gold Strength: Can Gold Bulls Push Even with Rising Rates in the US?
At the source of that recent weakness in Gold has been the fear of diminished real rates, brought upon by a loose and passive FOMC that’s avoiding tighter policy, even in the event that inflation begins to rise. That fear around inflation remains a hot-button item at the moment, and this can be witnessed in the US Treasury curve as the 10-year note has risen to its highest levels since the pandemic came into the equation last March.

Recommended by James Stanley
Download our Gold Forecast
A plethora of US data points on the calendar for this week can serve to keep these themes in the spotlight, with the Friday release of PCE numbers, the Fed’s preferred inflation gauge, likely garnering considerable attention.
For Gold price action – prices have already caught a quick bit of resistance from a prior swing-low around 1810. But just ahead is a huge zone of potential resistance, as taken from support between two different Fibonacci levels running from 1825-1836.
Gold Four-Hour Price Chart
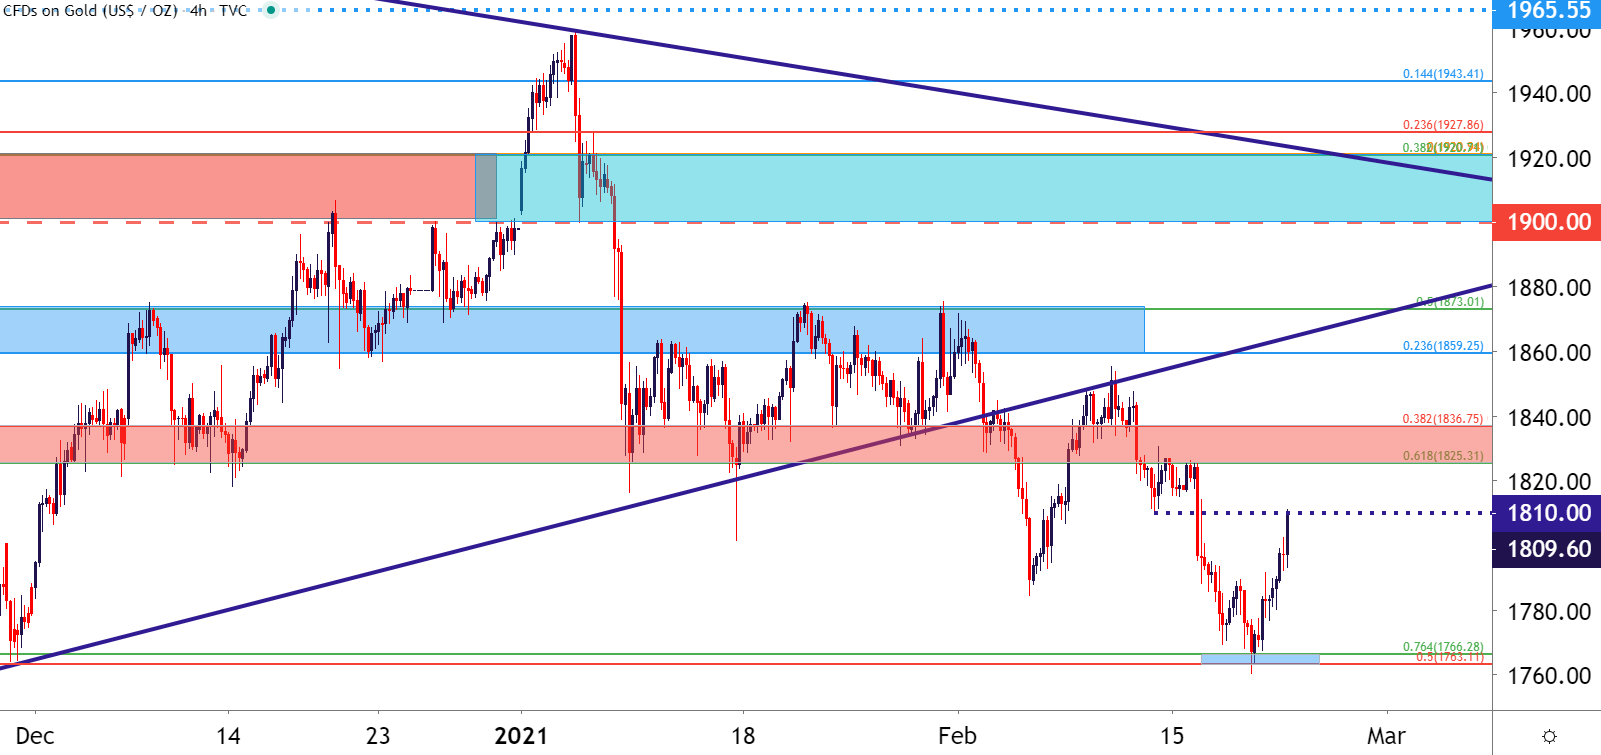
Chart prepared by James Stanley; Gold on Tradingview
Gold Price Strategy Moving Forward
Going back to the Daily chart to get some scope on the matter, and this is still a bear market bounce following the early-February extension of the sell-off. Price action broke below a symmetrical triangle formation earlier this month and after a quick check-back for resistance, continued the sequence of lower-lows and lower-highs until the current zone of support came into play.
To learn more about the symmetrical triangle, join us in DailyFX Education
At this point, the bearish side of the matter can remain interesting, especially if sellers can take-over at or before a test of the resistance zone from 1825-1836.
For signs of bullish themes returning, a breach through the 1859-1873 zone could make matters look considerably different but, until then, there’ll still be some conjecture as to whether bears are in control given that recent sequencing of lower-highs and lower-lows in price action.
Gold Price Daily Chart

Chart prepared by James Stanley; Gold on Tradingview
— Written by James Stanley, Senior Strategist for DailyFX.com
Contact and follow James on Twitter: @JStanleyFX
Be the first to comment